Six sigma TQM ISO 9000 1980 1950 1940


 Center Line (CL) Lower Control")
 Chart X - MR (Individual. Moving Range) Chart X-S")


 Center Line (CL) Lower Control 超出控制上限 Limit (LCL)")
 Center Line (CL) Lower Control Limit (LCL) 超出控制下限")

 Center Line (CL) Lower Control Limit (LCL) 连续七点上升")
 Center Line (CL) Lower Control Limit (LCL) 连续七点下降")
 Center Line (CL) Lower Control Limit (LCL) 连续七点在控制中限的")
 Center Line (CL) Lower Control Limit (LCL) 连续七点在控制中限的")
 Center Line (CL) Lower Control Limit (LCL) 过于规则的分布")
 Center Line (CL) Lower Control Limit (LCL) 明显多于")
 Center Line (CL) Lower Control Limit (LCL) 明显少于")

 Center Line (CL) 0 超出控制上限 SPC")
 Center Line (CL) 0 连续七点在控制中限的 下方 SPC")
 Center Line (CL) 0 连续七点在控制中限的 上方 SPC")
 Center Line (CL) 0 连续七点上升 SPC")
 Center Line (CL) 0 连续七点下降 SPC")
 Center Line (CL) Lower Control Limit (LCL) 过于规则的分布")
 Center Line (CL) Lower Control Limit (LCL) 明显多于")
 Center Line (CL) Lower Control Limit (LCL) 明显少于")
 X (CL) (LCL) (UCL) MR (CL) (LCL) 时间 2/11 3/11 4/11")


 (LCL) 日期 5/11 6/11 检验样 本数 7/11 968 1216 8/11")

 Center Line (CL) Lower Control 超出控制上限 Limit (LCL) SPC")
 Center Line (CL) Lower Control Limit (LCL) 超出控制下限 SPC")
 Center Line (CL) Lower Control Limit (LCL) 连续七点上升 SPC")
 Center Line (CL) Lower Control Limit (LCL) 连续七点下降 SPC")


- Slides: 138
质量管理发展历程 Six sigma TQM ISO 9000 1980 统计技术 1950 独立检验部 1940 长 1930 操作人员 1900 SPC
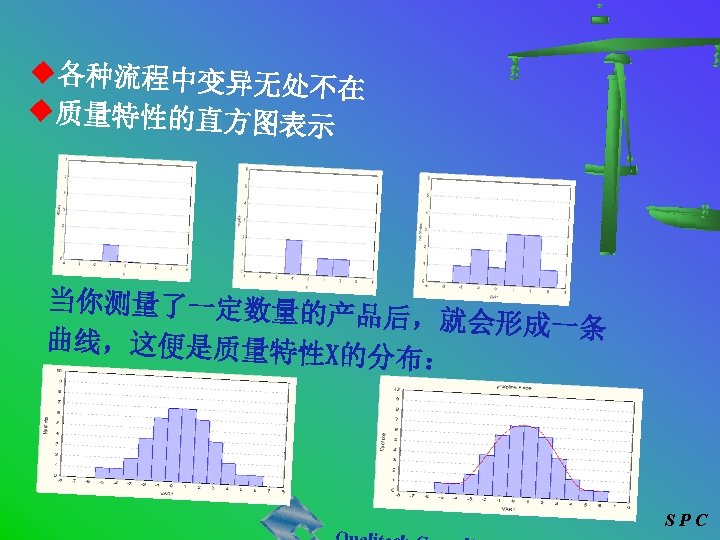
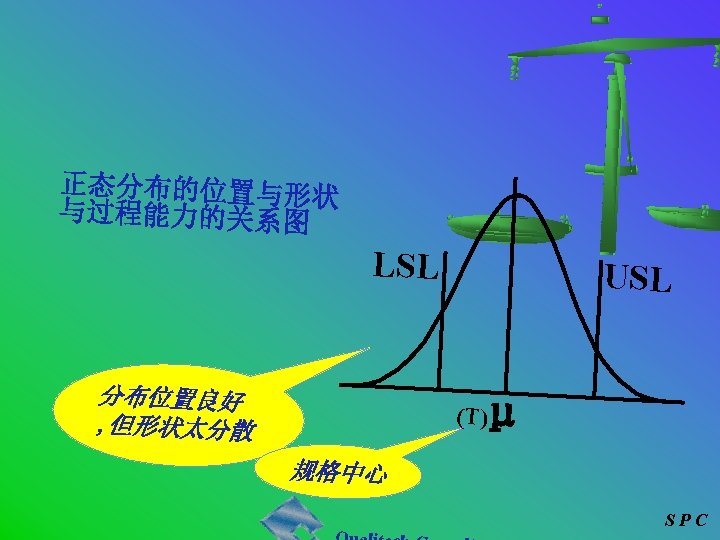
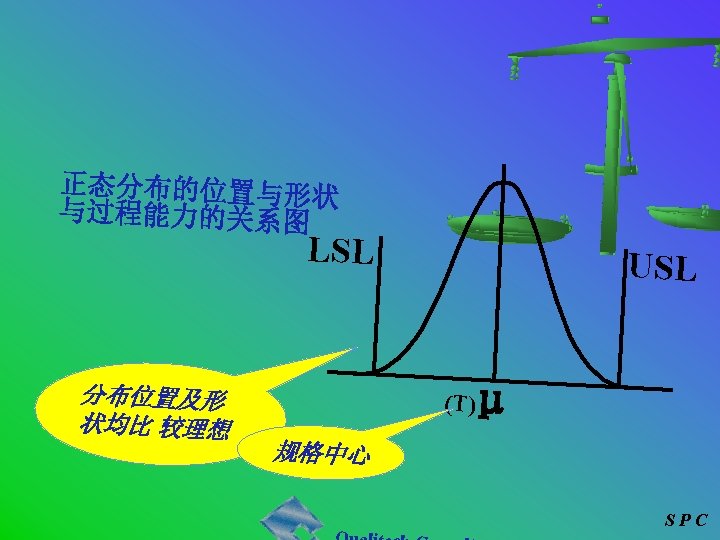
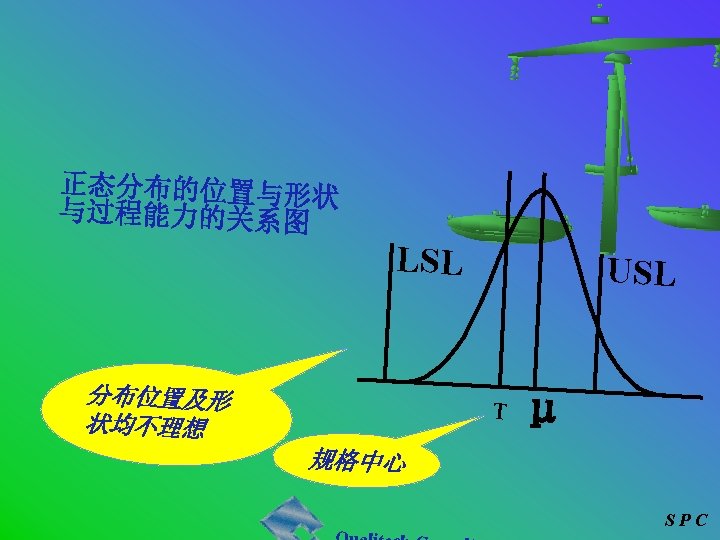
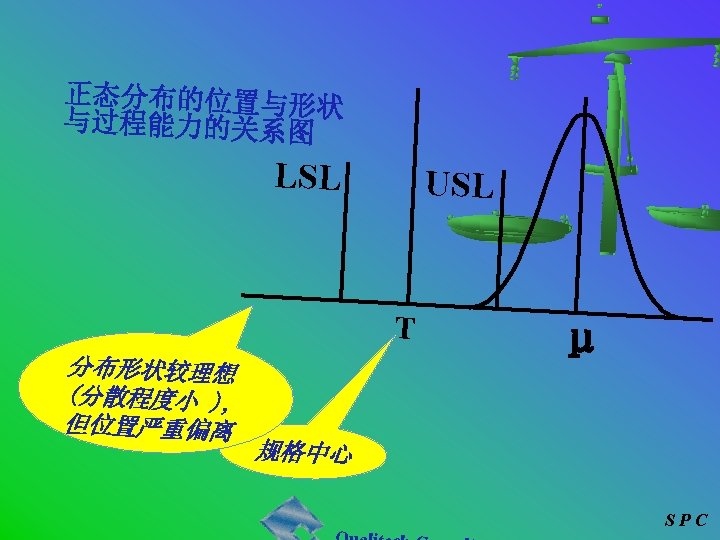
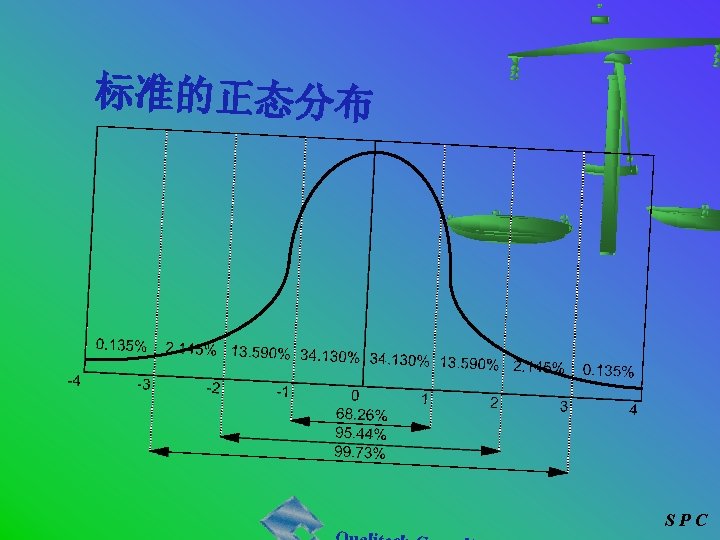
变差的起源…… 测量 Measurement 环境 Mother-natured 人力 Manpower 机械 Machine 变差 方法 Methods 物料 Material SPC
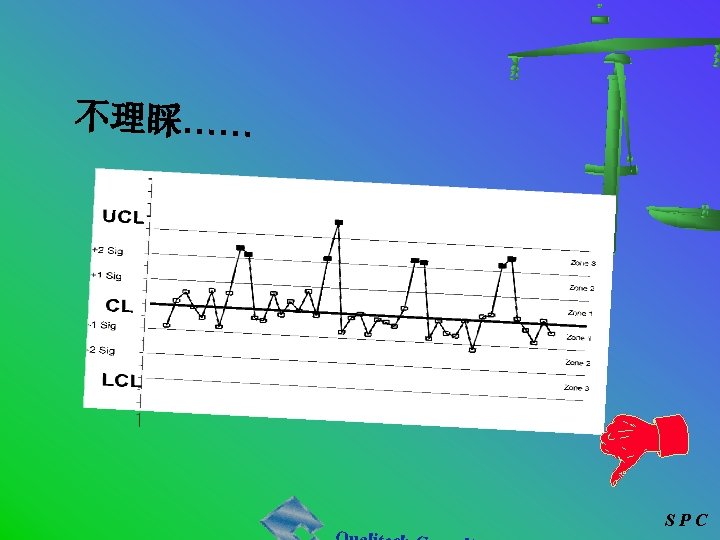
控制图-控制过程的 具 典型的控制图由三条线 组成 : Upper Control Limit (UCL) Center Line (CL) Lower Control CL :控制中限 UCL: 上控制限 LCL: 下控制限 Limit (LCL) SPC
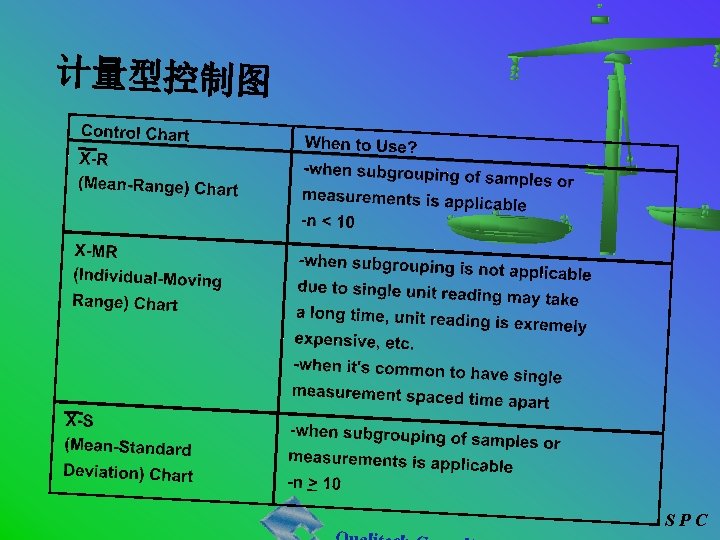
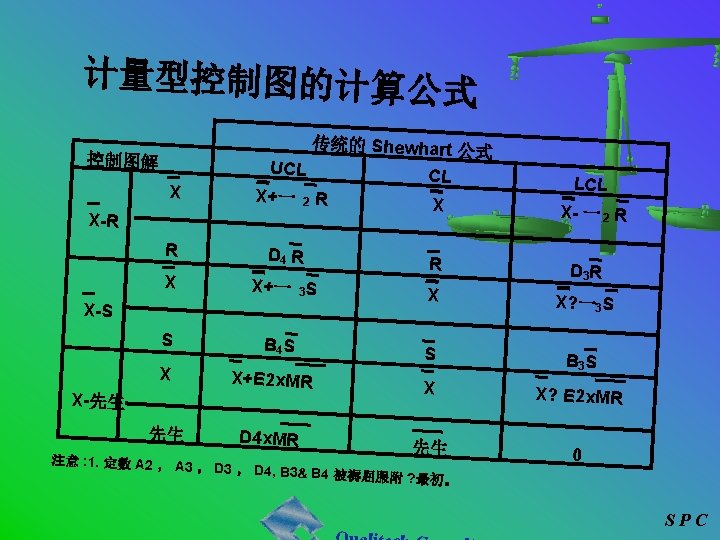
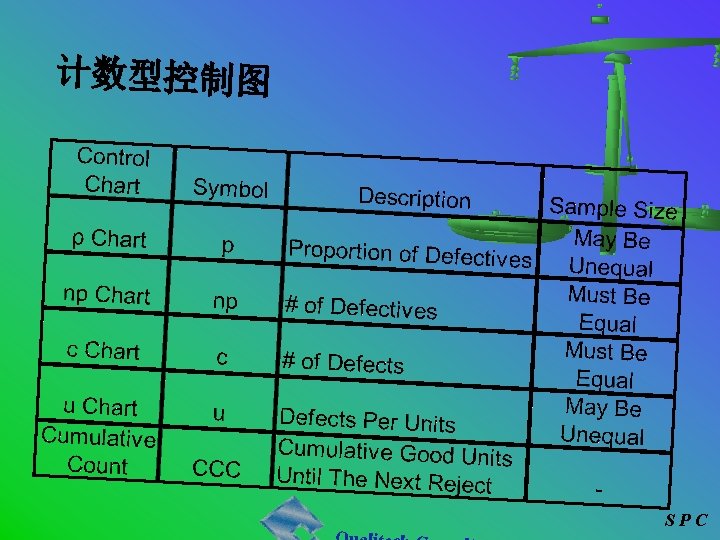
计量型控制图 Control Chart X-R (Mean-Range) Chart X - MR (Individual. Moving Range) Chart X-S (Mean-Standard Deviation) Chart Symbol Description Sample Size Must Be Equal X Mean of Sample R Range of Sample X Individual Measureme MR One nt Two Range Between Individual Measureme nt X Mean of Sample S Standard Deviation of Sample Must Be Equal SPC
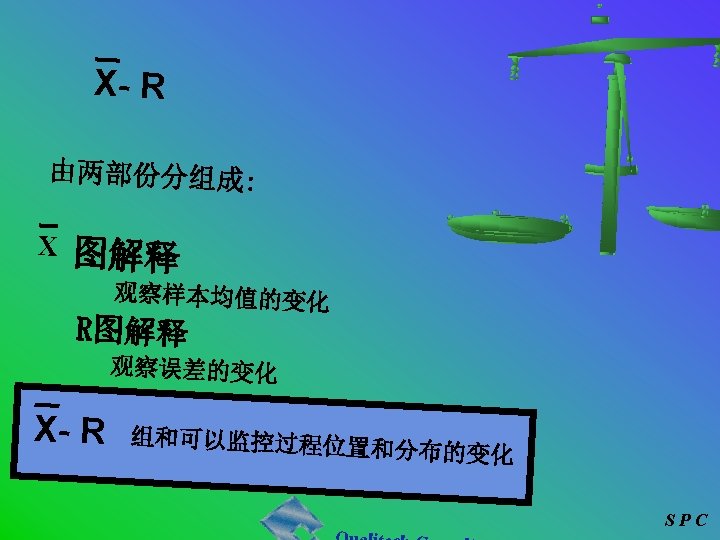
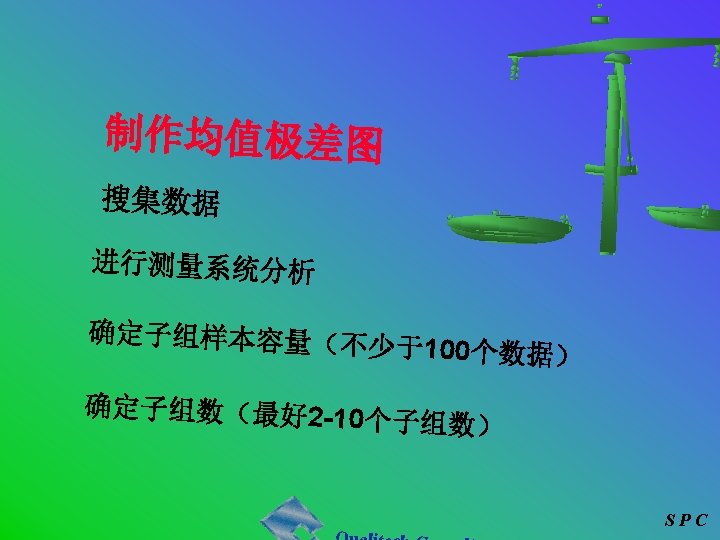
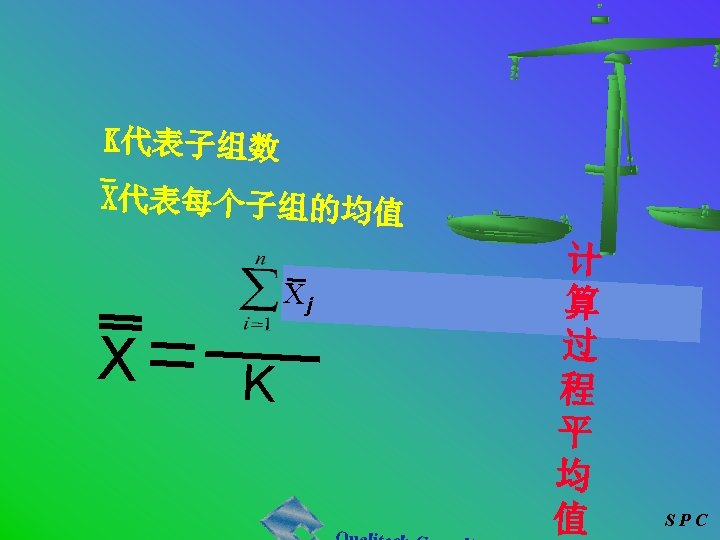
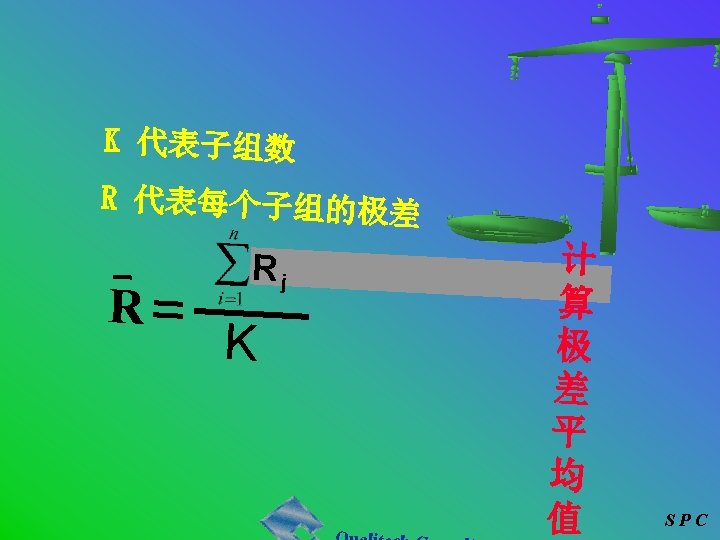
X R Chart 均值极差图 SPC
UCL CL LCL 日期 8/5 9/5 10/5 1 0. 23 2 0. 20 0. 19 3 0. 21 0. 24 0. 21 4 0. 18 0. 19 0. 22 0. 24 和 0. 86 0. 21 X 0. 85 0. 22 0. 83 R 0. 21 0. 05 0. 20 0. 06 0. 03 …… 均值 极差 SPC
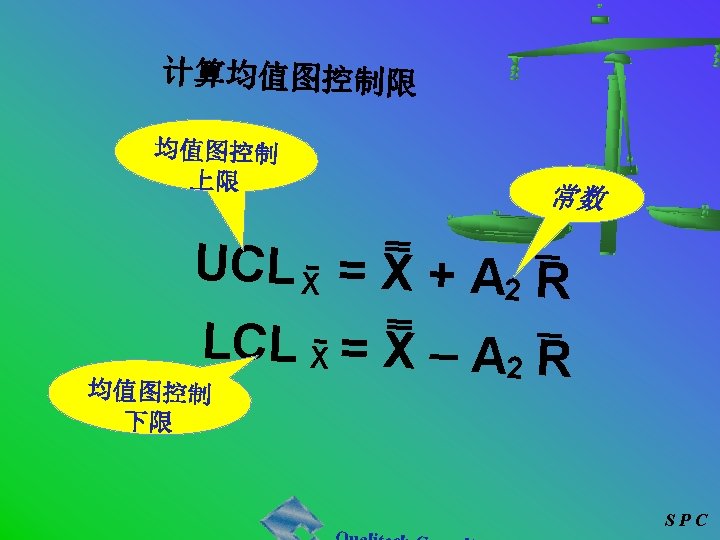
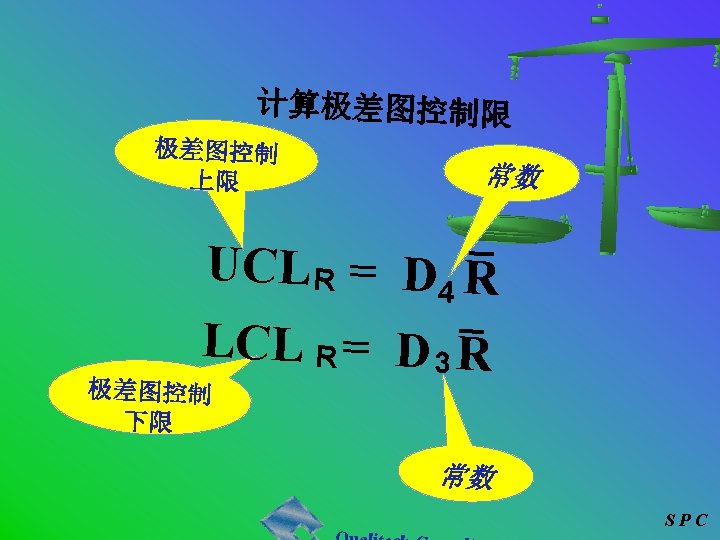
X-R图常数表 n 2 D 4 D 3 A 2 3 3. 27 1. 88 2. 57 1. 02 4 5 6 7 8 9 10 2. 28 2. 11 2. 00 1. 92 1. 86 1. 82 1. 78 0. 08 0. 14 0. 18 0. 22 0. 42 0. 37 0. 34 0. 31 0. 73 0. 58 0. 48 SPC
X UCL CL LCL R UCL CL LCL 日期 8/5 9/5 10/5 1 0. 23 2 0. 20 0. 19 3 0. 21 0. 24 0. 21 4 0. 18 0. 19 0. 22 0. 24 和 0. 86 0. 21 X 0. 85 0. 22 0. 83 R 0. 21 0. 05 0. 20 0. 06 0. 03 …… 均值 极差 SPC
SPC
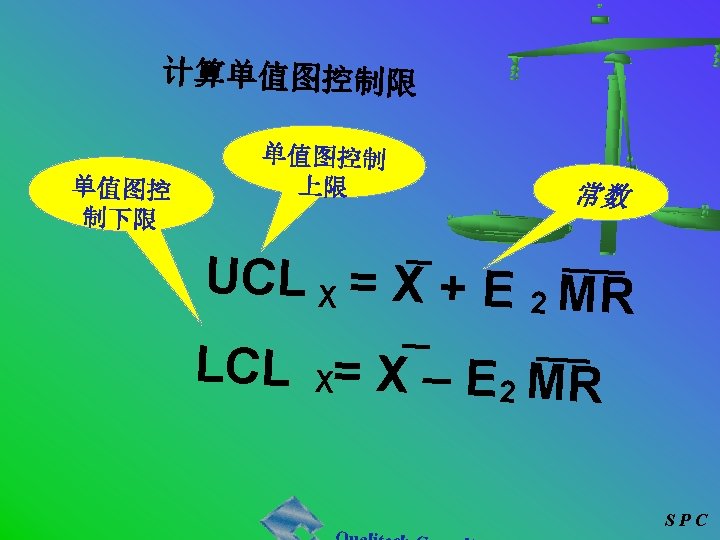
X 图 Upper Control Limit (UCL) Center Line (CL) Lower Control 超出控制上限 Limit (LCL) SPC
X 图 Upper Control Limit (UCL) Center Line (CL) Lower Control Limit (LCL) 超出控制下限 SPC
X 图 Upper Control Limit (UCL) Center Line (CL) Lower Control Limit (LCL) 连续七点上升 SPC
X 图 Upper Control Limit (UCL) Center Line (CL) Lower Control Limit (LCL) 连续七点下降 SPC
X 图 Upper Control Limit (UCL) Center Line (CL) Lower Control Limit (LCL) 连续七点在控制中限的 下方 SPC
X 图 Upper Control Limit (UCL) Center Line (CL) Lower Control Limit (LCL) 连续七点在控制中限的 上方 SPC
X 图 Upper Control Limit (UCL) Center Line (CL) Lower Control Limit (LCL) 过于规则的分布 连续 14 点交替上升和 下降 SPC
X 图 Upper Control Limit (UCL) Center Line (CL) Lower Control Limit (LCL) 明显多于 80% 的点在 CL 的 附近 SPC
X 图 Upper Control Limit (UCL) Center Line (CL) Lower Control Limit (LCL) 明显少于 40% 的点在 CL 的 附近 SPC
R 图 Upper Control Limit (UCL) Center Line (CL) 0 超出控制上限 SPC
R 图 Upper Control Limit (UCL) Center Line (CL) 0 连续七点在控制中限的 下方 SPC
R 图 Upper Control Limit (UCL) Center Line (CL) 0 连续七点在控制中限的 上方 SPC
R 图 Upper Control Limit (UCL) Center Line (CL) 0 连续七点上升 SPC
R 图 Upper Control Limit (UCL) Center Line (CL) 0 连续七点下降 SPC
R 图 Upper Control Limit (UCL) Center Line (CL) Lower Control Limit (LCL) 过于规则的分布 连续 14 点交替上升和 下降 SPC
R 图 Upper Control Limit (UCL) Center Line (CL) Lower Control Limit (LCL) 明显多于 80% 的点在 CL 的 附近 SPC
R 图 Upper Control Limit (UCL) Center Line (CL) Lower Control Limit (LCL) 明显少于 40% 的点在 CL 的 附近 SPC
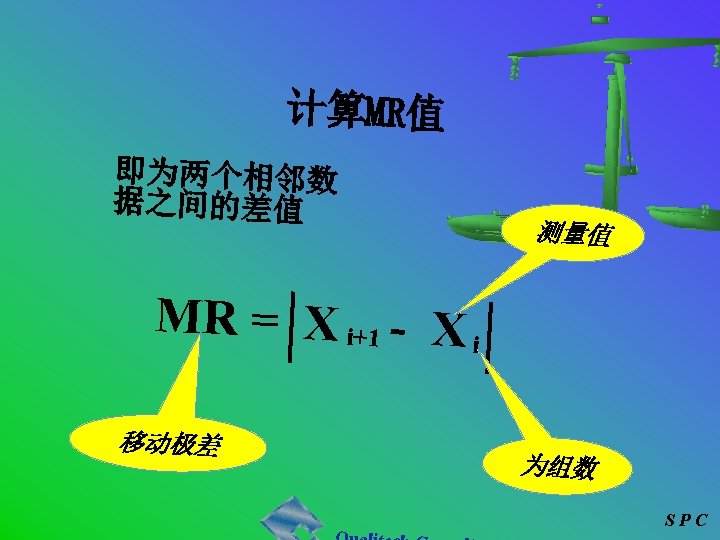
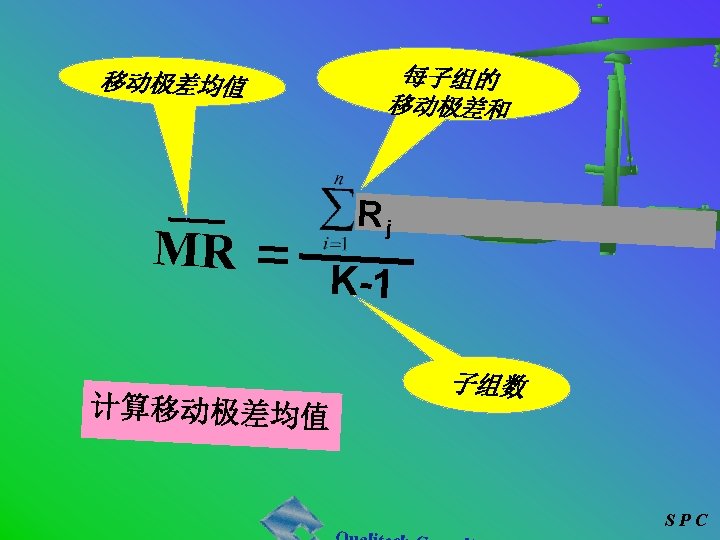
典型的 X-MR图 (UCL) X (CL) (LCL) (UCL) MR (CL) (LCL) 时间 2/11 3/11 4/11 测量值 5/11 8. 0 8. 5 7. 4 10. 5 1. 1 3. 1 移动极差 SPC
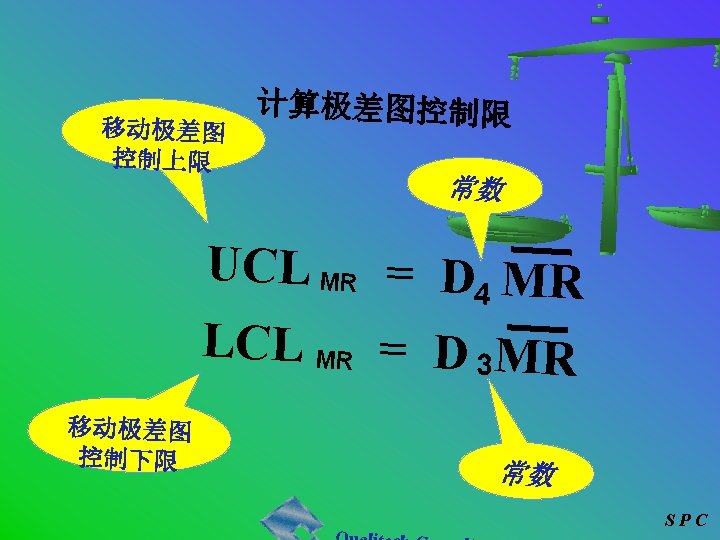
X-MR图常数表 n 2 D 4 D 3 E 2 3 3. 27 2. 66 2. 57 1. 77 4 5 6 7 8 9 10 2. 28 2. 11 2. 00 1. 92 1. 86 1. 82 1. 78 0. 08 0. 14 0. 18 0. 22 1. 11 1. 05 1. 01 0. 98 1. 46 1. 29 1. 18 SPC
SPC
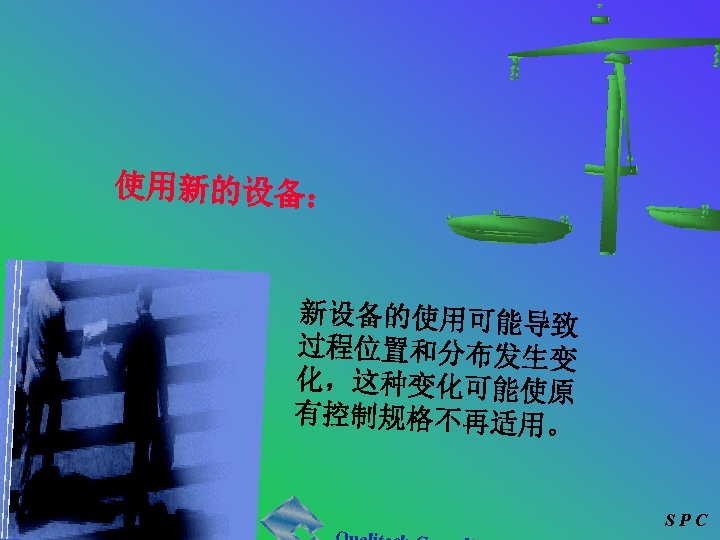
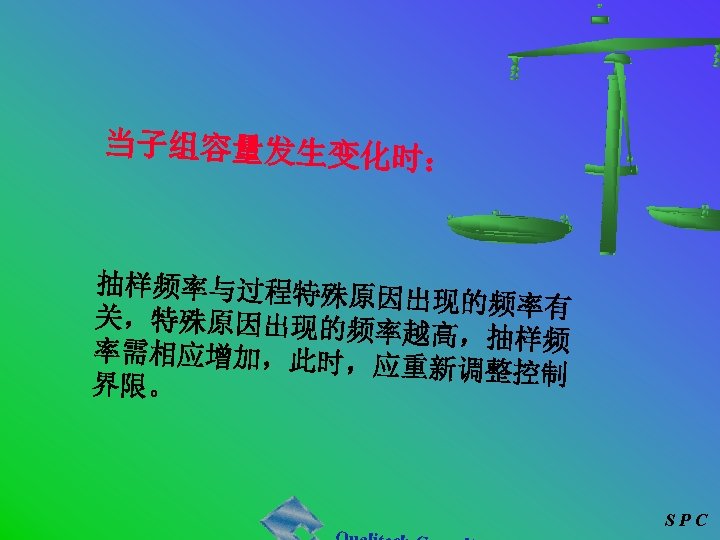
X R Chart X –MR Chart 控制界限的更换篇 SPC
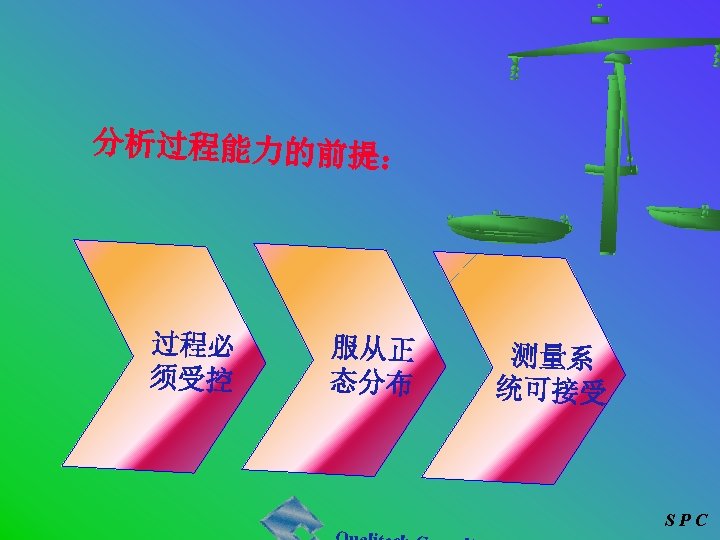
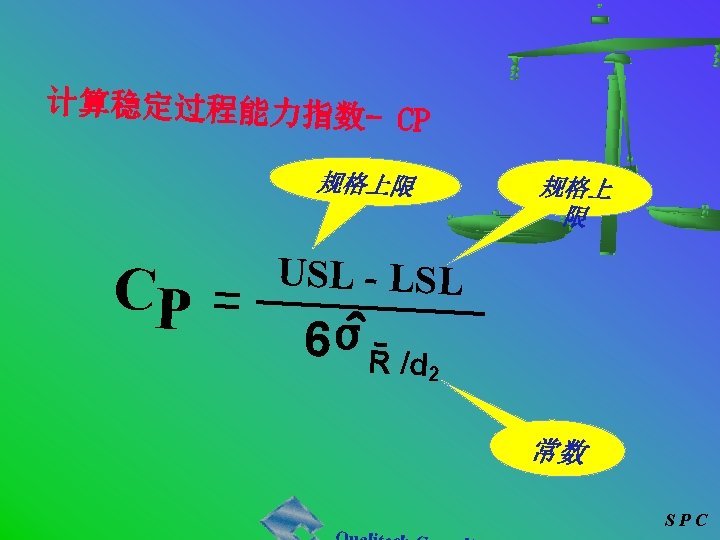
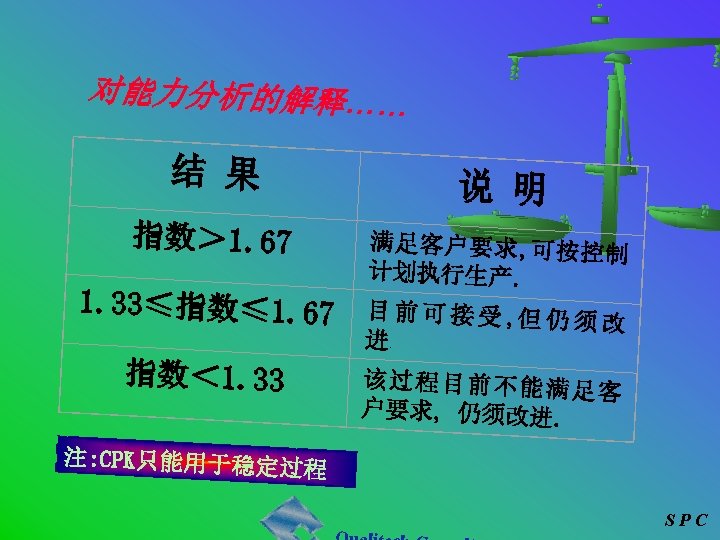
X R Chart X –MR Chart 分析过程能力篇 SPC
常数表 n 2 10 3 4 5 6 7 8 9 2 d 1. 13 1. 69 2. 06 2. 3 3 2. 53 2. 70 2. 85 2. 97 3. 08 SPC
SPC
SPC
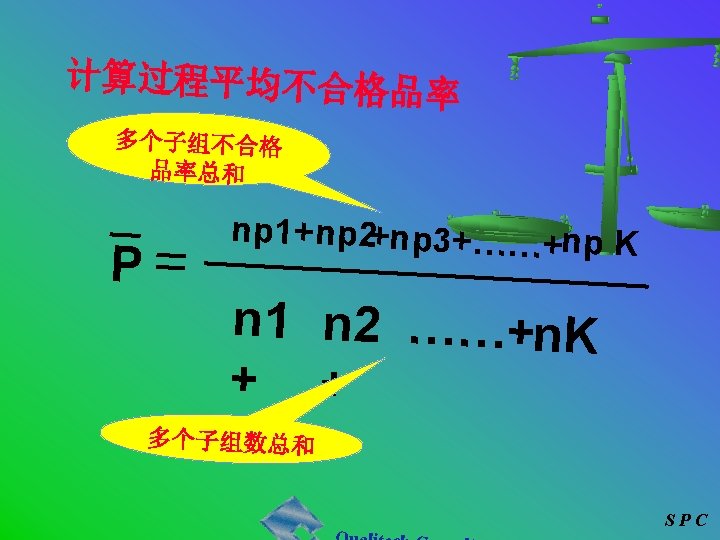
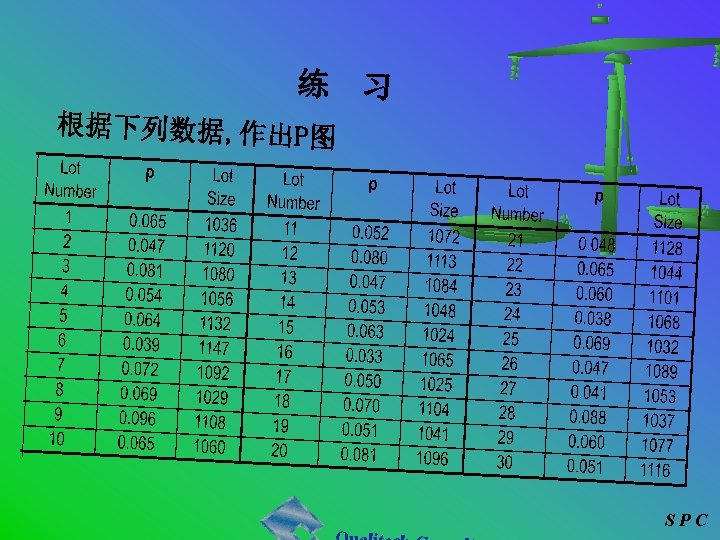
典型的 P 图 (UCL) (LCL) 日期 5/11 6/11 检验样 本数 7/11 968 1216 8/11 804 9/11 1401 10/11 1376 995 不合格 数 不合格 率 8 13 13 16 14 0. 008 15 0. 011 0. 016 0. 011 0. 015 0. 011 SPC
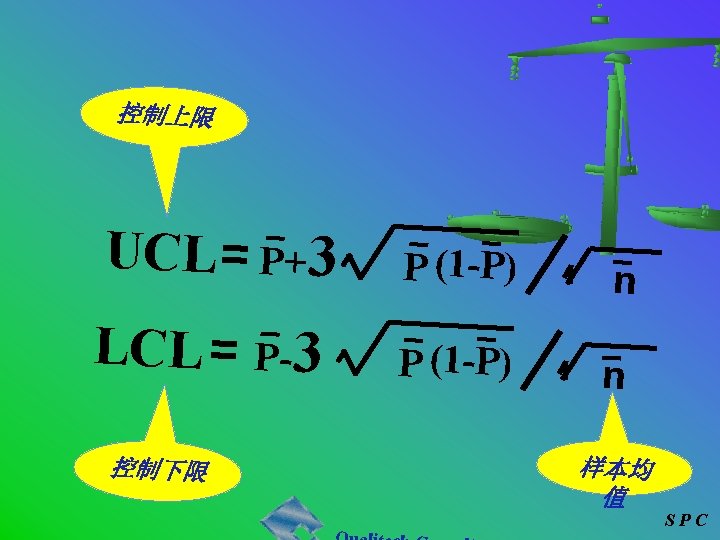
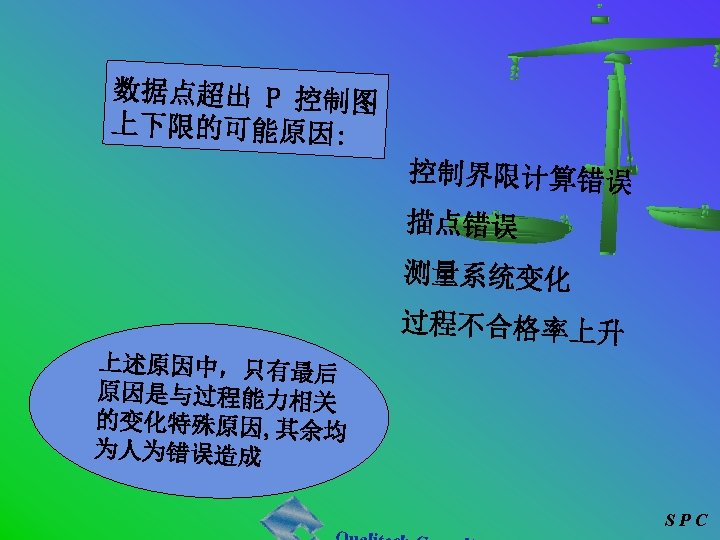
Upper Control Limit (UCL) Center Line (CL) Lower Control 超出控制上限 Limit (LCL) SPC
Upper Control Limit (UCL) Center Line (CL) Lower Control Limit (LCL) 超出控制下限 SPC
Upper Control Limit (UCL) Center Line (CL) Lower Control Limit (LCL) 连续七点上升 SPC
Upper Control Limit (UCL) Center Line (CL) Lower Control Limit (LCL) 连续七点下降 SPC
附录: 常数表 X - R Charts Subgroup Size n 2 3 4 5 6 7 8 9 10 X Chart Factor for Control Limit A 2 1. 880 1. 023 0. 729 0. 577 0. 483 0. 419 0. 373 0. 337 0. 308 X - S Charts R Chart Divisor for Estimate of Standard Deviation d 2 1. 128 1. 693 2. 059 2. 326 2. 534 2. 704 2. 847 2. 970 3. 078 X Chart Factor for Control Limit D 3 0. 076 0. 136 0. 184 0. 223 D 4 3. 267 2. 574 2. 282 2. 114 2. 004 1. 924 1. 864 1. 816 1. 777 Factor for Control Limit A 3 2. 659 1. 954 1. 628 1. 427 1. 287 1. 182 1. 099 1. 032 0. 975 S Chart Divisor for Estimate of Standard Deviation c 4 0. 7979 0. 8862 0. 9213 0. 9400 0. 9515 0. 9594 0. 9650 0. 9693 0. 9727 Factor for Control Limit B 3 0. 030 0. 118 0. 185 0. 239 0. 284 B 4 3. 267 2. 568 2. 266 2. 089 1. 970 1. 882 1. 815 1. 761 1. 716 SPC