Six Sigma and Statistical Quality Control Outline Quality


 • Statistical Quality")


 a process to satisfy a")


 Limits • Determined by the inherent central tendency and dispersion of the")


 • A simple")
")


")


 A Process in which the Specification Limits are Six Standard")


- Slides: 99
Six Sigma and Statistical Quality Control
Outline • Quality and Six Sigma: Basic ideas and history • Juran Trilogy – Control – Improvement – Planning • Quality Strategy • Focus on Statistical Methods – Process Capability ideas and metrics – Control charts for attributes and variables
A Brief History • The Craft System • Taylorism (Scientific Management) • Statistical Quality Control – Pearson, Shewhart, Dodge • Human Relations School – Mayo, Maslow, Simon, Herzberg, Likert • The Japanese Revolution (1950) – Ishikawa, Taguchi, Deming, Juran, Feigenbaum • The USA Wakes Up (1980) – Crosby • 1990 s: Six Sigma • The Need for Organizational Change
JIT and TQM Walter Shewhart 1891 - 1967 Operations -- Prof. Juran W. Edwards Deming 1900 - 1993 4 Joseph M. Juran 1904 - 2008
What is Quality? • Freedom from Defects – Quality Costs Less – Affects Costs • Presence of Features – Quality Costs More – Affects Revenue
Juran Trilogy Planning, Control, Improvement
Juran Trilogy Planning, Control, Improvement Planning Control Improvement Control Sporadic Spike Chronic Waste
Quality Control • Aimed at preventing unwanted changes • Works best if deployed at the point of production or service delivery (Empowerment) • Tools: – – Established, measurable standards Measurement and feedback Control charts Statistical inference
Quality Control Establish Standard Measure Performance Operate Yes OK? Corrective Action No Compare to Standard
Quality Improvement • Aimed at creating a desirable change • Two distinct “journeys” – Diagnosis – Remedy • Project team approach • Tools – – Process flow diagram Pareto analysis Cause-effect (Ishikawa, fishbone) diagram Statistical tools
Quality Improvement • • Identify problem Analyze symptoms Formulate theories Test theories - Identify root cause • Identify remedy • Address cultural resistance • Establish control
Quality Planning • Aimed at creating or redesigning (reengineering) a process to satisfy a need • Project team approach • Tools – – – Market research Failure analysis Simulation Quality function deployment Benchmarking
Quality Planning • • Verify goal Identify customers Determine customer needs Develop product Develop process Transfer to operations Establish control
Strategic Quality Planning • • Mission Vision Long-term objectives Annual goals Deployment of goals Assignment of resources Systematic measurement Connection to rewards and recognition
Strategic Quality Planning • Aimed at establishing long-range quality objectives and creating an approach to meeting those objectives • Top management’s job • Integrated with other objectives – – Operations Finance Marketing Human Resources
Process Capability • The Relationship between a Process and the Requirements of its Customer • How Well Does the Process Meet Customer Needs?
Process Capability • Specification Limits reflect what the customer needs • Natural Tolerance Limits (a. k. a. Control Limits) reflect what the process is capable of actually delivering • These look similar, but are not the same
Specification Limits • Determined by the Customer • A Specific Quantitative Definition of “Fitness for Use” • Not Necessarily Related to a Particular Production Process • Not Represented on Control Charts
Tolerance (Control) Limits • Determined by the inherent central tendency and dispersion of the production process • Represented on Control Charts to help determine whether the process is “under control” • A process under control may not deliver products that meet specifications • A process may deliver acceptable products but still be out of control
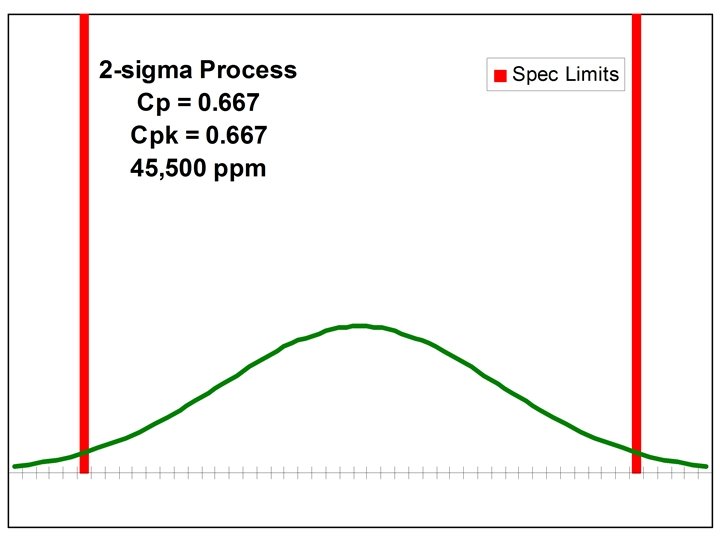
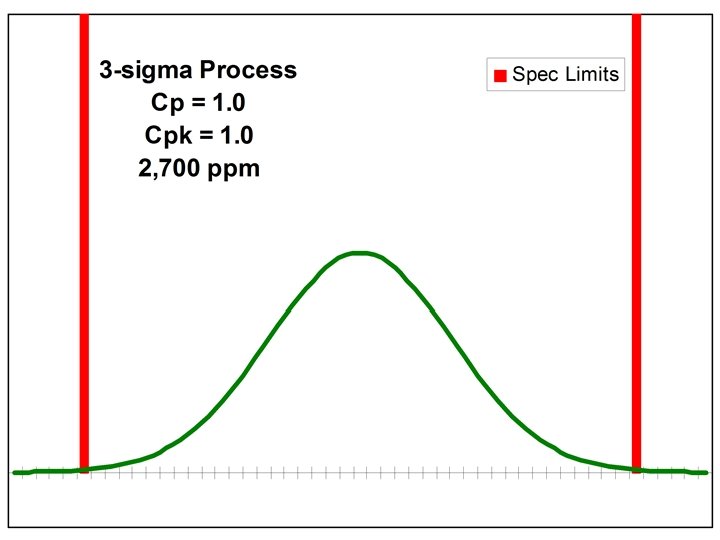
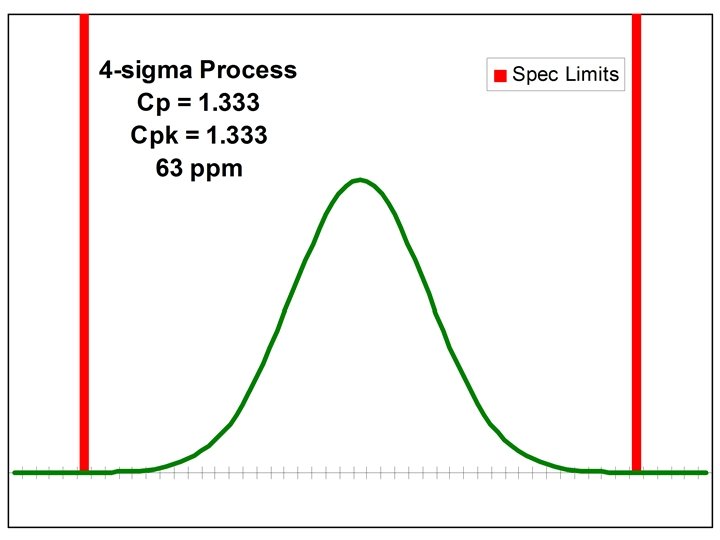
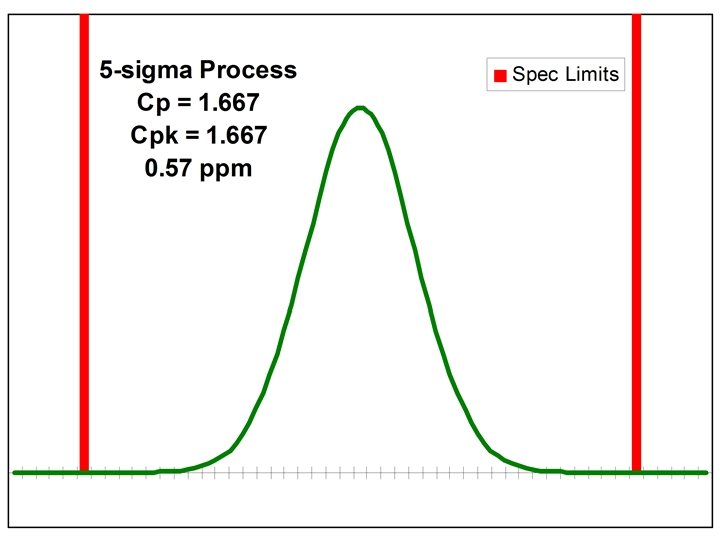
Measures of Process Capability • • Cp Cpk Percent Defective Sigma Level
Example: Cappuccino • Imagine that a franchise food service organization has determined that a critical quality feature of their world-famous cappuccino is the proportion of milk in the beverage, for which they have established specification limits of 54% and 64%. • The corporate headquarters has procured a customdesigned, fully-automated cappuccino machine which has been installed in all the franchise locations. • A sample of one hundred drinks prepared at the company’s Stamford store has a mean milk proportion of 61% and a standard deviation of 3%.
Example: Cappuccino • Assuming that the process is in control and normally distributed, what proportion of cappuccino drinks at the Stamford store will be nonconforming with respect to milk content? • Try to calculate the Cp, Cpk, and Parts per Million for this process. • If you were the quality manager for this company, what would you say to the store manager and/or to the big boss back at headquarters? What possible actions can be taken at the store level, without changing the inherent variability of this process, to reduce the proportion of non-conforming drinks?
Lower Control Limit
Upper Control Limit
Nonconformance
Nonconformance
Nonconformance • 0. 00990 of the drinks will fall below the lower specification limit. • 0. 84134 of the drinks will fall below the upper limit. • 0. 84134 - 0. 00990 = 0. 83144 of the drinks will conform. • Nonconforming: 1. 0 - 0. 83144 = 0. 16856 (16. 856%)
Cp Ratio
Cpk Ratio
Parts per Million
Quality Improvement • Two Approaches: – Center the Process between the Specification Limits – Reduce Variability
Approach 1: Center the Process
Approach 1: Center the Process
Approach 1: Center the Process
Approach 1: Center the Process • 0. 04746 of the drinks will fall below the lower specification limit. • 0. 95254 of the drinks will fall below the upper limit. • 0. 95254 - 0. 04746 = 0. 90508 of the drinks will conform. • Nonconforming: 1. 0 - 0. 90508 = 0. 09492 (9. 492%)
Approach 1: Center the Process • Nonconformance decreased from 16. 9% to 9. 5%. • The inherent variability of the process did not change. • Likely to be within operator’s ability.
Approach 2: Reduce Variability • The only way to reduce nonconformance below 9. 5%. • Requires managerial intervention.
Quality Control Establish Standard Measure Performance Operate Yes OK? Corrective Action No Compare to Standard
Quality Control • Aimed at preventing and detecting unwanted changes • An important consideration is to distinguish between Assignable Variation and Common Variation • Assignable Variation is caused by factors that can clearly be identified and possibly managed • Common Variation is inherent in the production process • We need tools to help tell the difference
When is Corrective Action Required? • Operator Must Know How They Are Doing • Operator Must Be Able to Compare against the Standard • Operator Must Know What to Do if the Standard Is Not Met
When is Corrective Action Required? • Use a Chart with the Mean and 3 -sigma Limits (Control Limits) Representing the Process Under Control • Train the Operator to Maintain the Chart • Train the Operator to Interpret the Chart
Example: Run Chart
When is Corrective Action Required? Here are four indications that a process is “out of control”. If any one of these things happens, you should stop the machine and call a quality engineer: • One point falls outside the control limits. • Seven points in a row all on one side of the center line. • A run of seven points in a row going up, or a run of seven points in a row going down. • Cycles or other non-random patterns.
Example: Run Chart
Type I and Type II Errors
When is Corrective Action Required? One point falls outside the control limits. • 0. 27% chance of Type I Error Seven points in a row all on one side of the center line. • 0. 78% chance of Type I Error A run of seven points in a row going up, or a run of seven points in a row going down. • 0. 78% chance of Type I Error
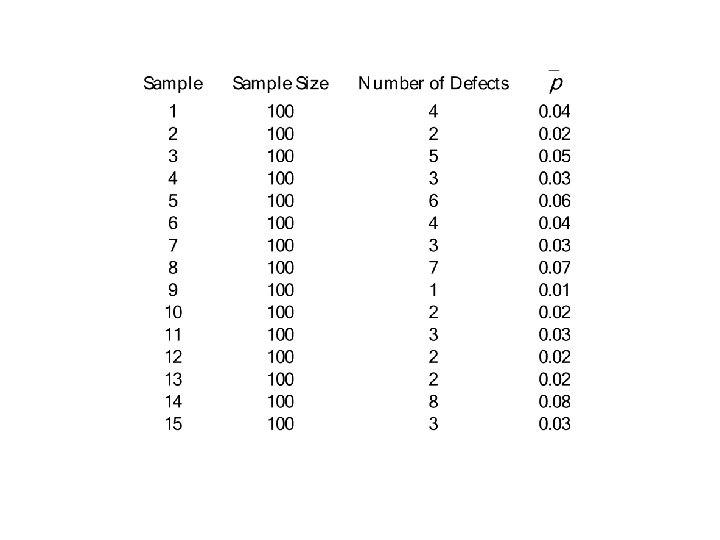
Basic Types of Control Charts Attributes (“Go – No Go” data) • A simple yes-or-no issue, such as “defective or not” • Data typically are “proportion defective” • p-chart Variables (Continuous data) • Physical measurements such as dimensions, weight, electrical properties, etc. • Data are typically sample means and standard deviations • X-bar and R chart
Statistical Symbols (Attributes)
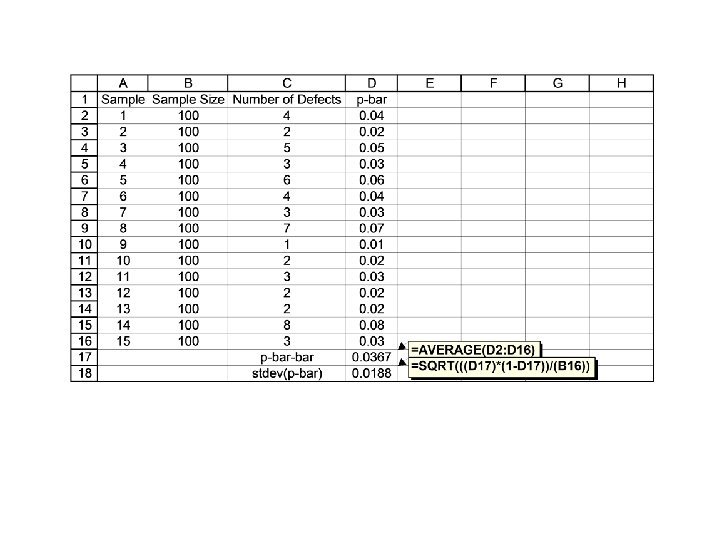
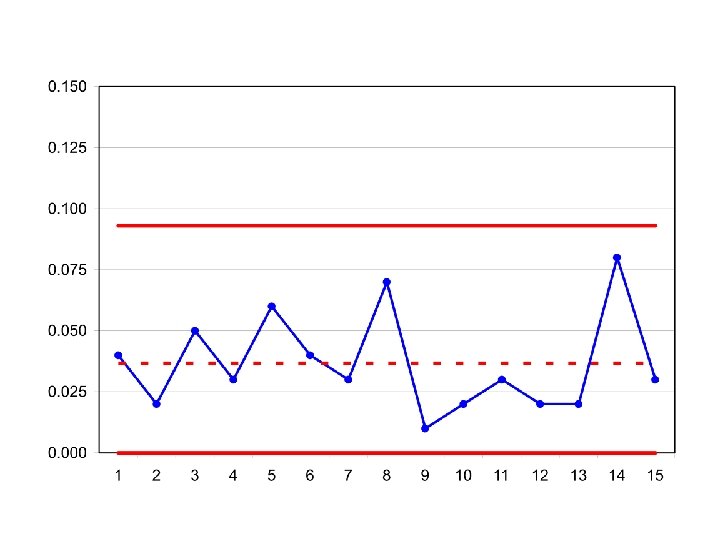
p-chart Example
p-chart Example
Note: If the LCL is negative, we round it up to zero.
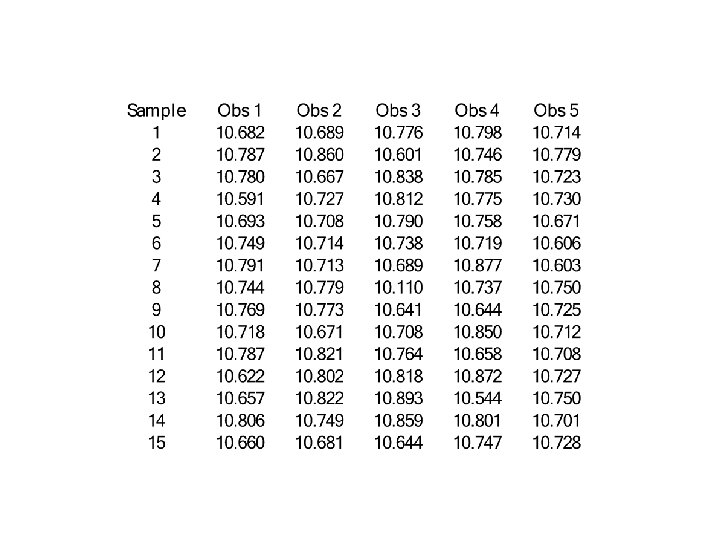
Statistical Symbols (Variables)
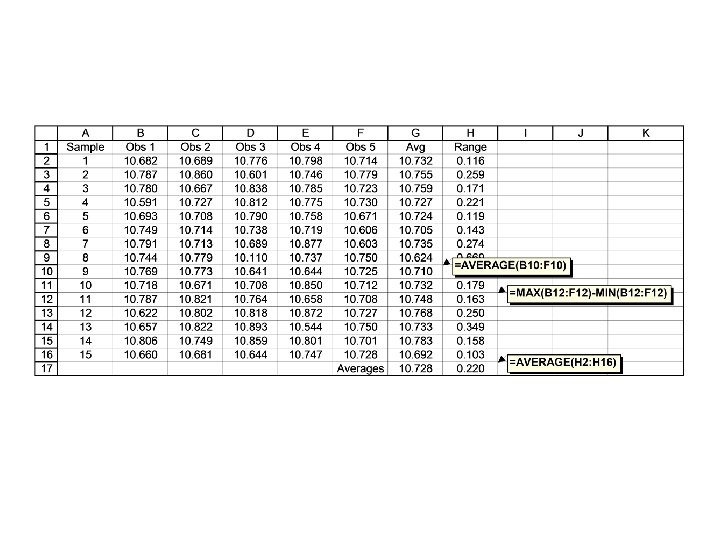
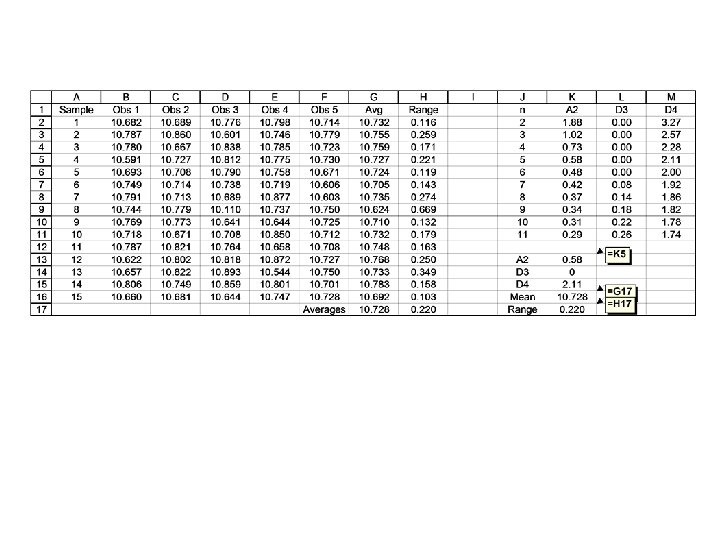
X-bar, R chart Example
From Exhibit TN 7. 7
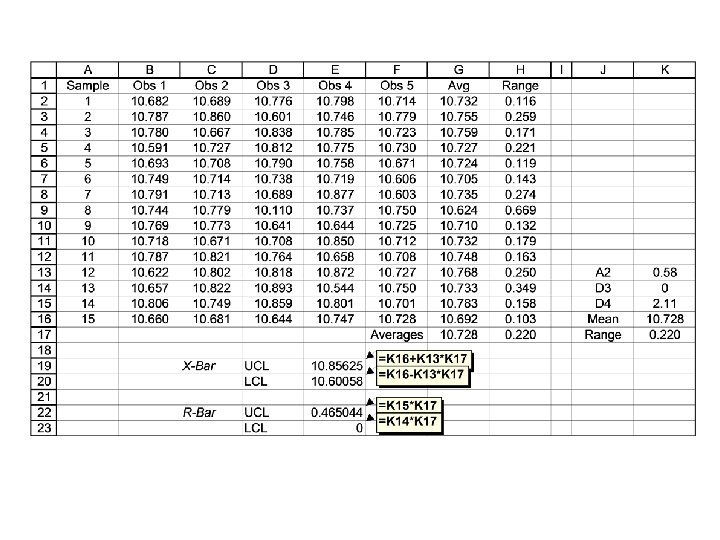
X-bar Chart
R chart
Interpretation • Does any point fall outside the control limits? • Are there seven points in a row all on one side of the center line? • Is there a run of seven points in a row going up, or a run of seven points in a row going down? • Are there cycles or other non-random patterns?
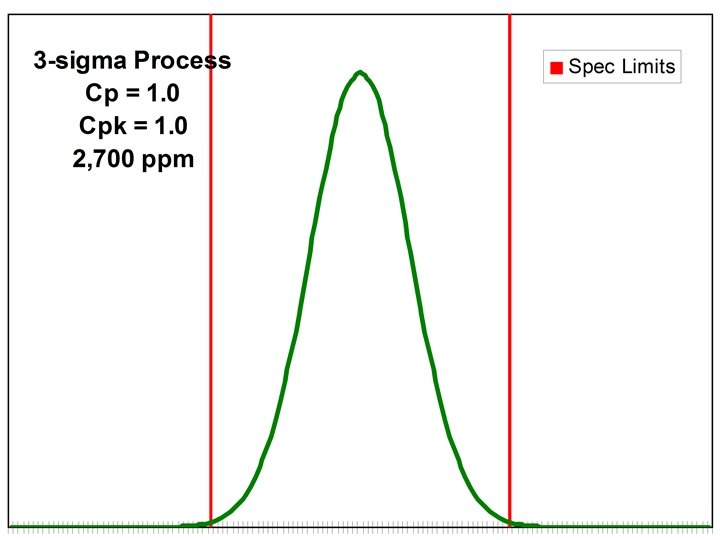
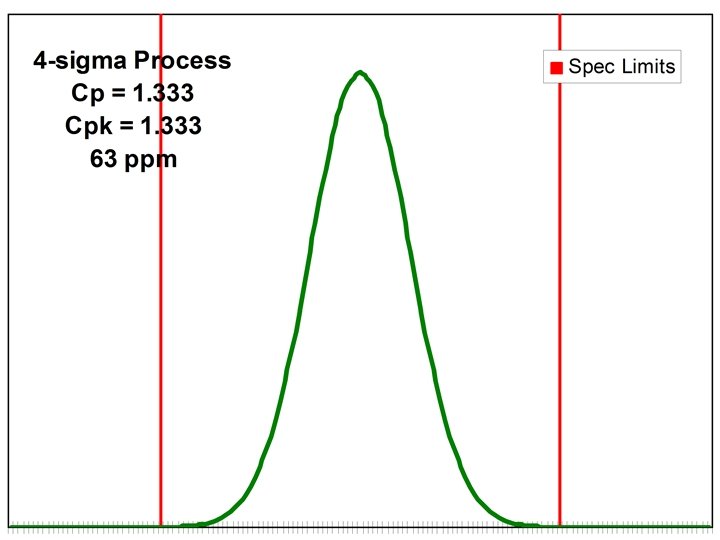
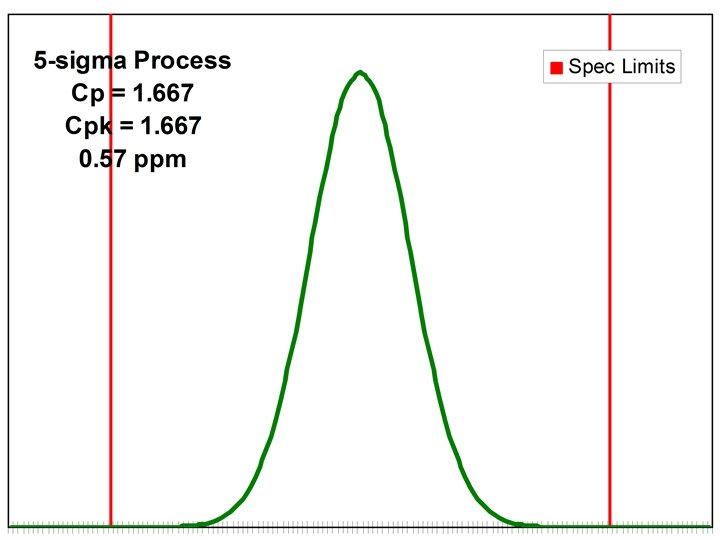
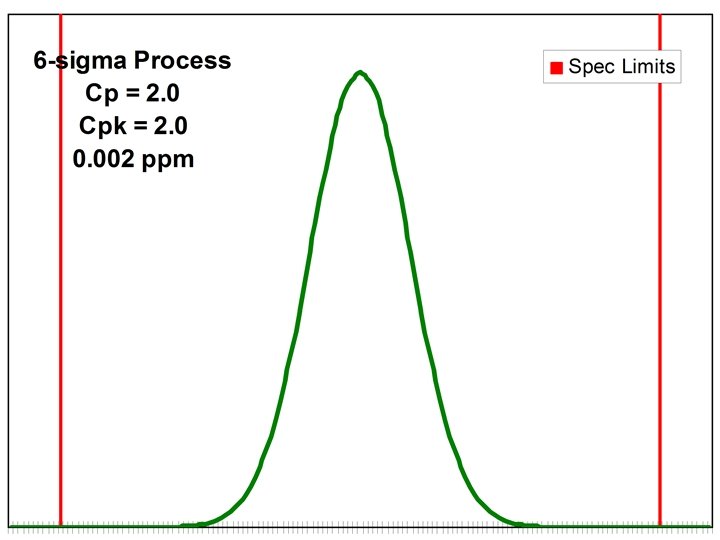
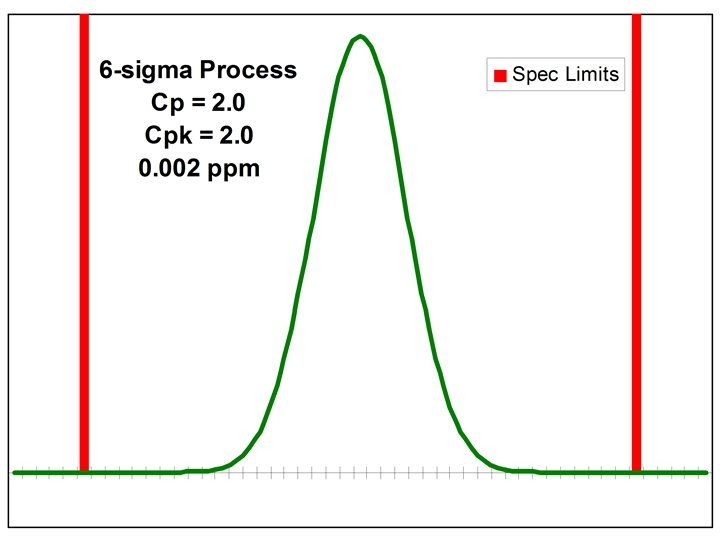
Six Sigma Defined (Low-Level) A Process in which the Specification Limits are Six Standard Deviations above and below the Process Mean Two Approaches: • Move the Specification Limits Farther Apart • Reduce the Standard Deviation
Approach #1 Ask the Customer to Move the Specification Limits Farther Apart.
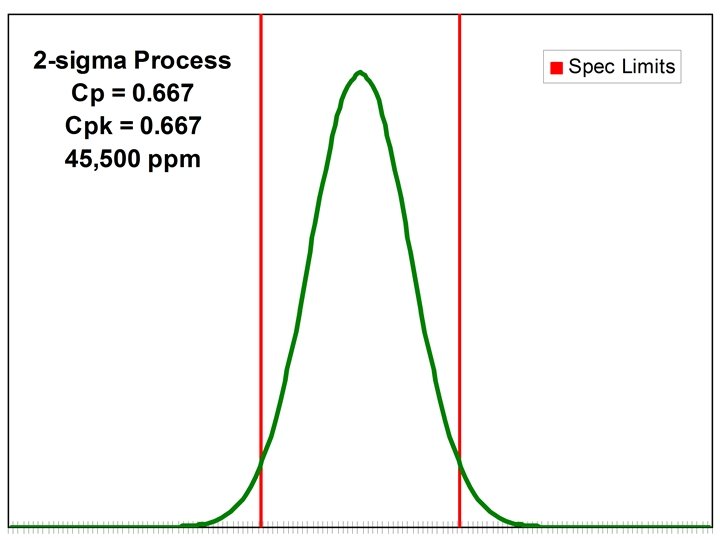
Approach #2 Reduce the Standard Deviation.
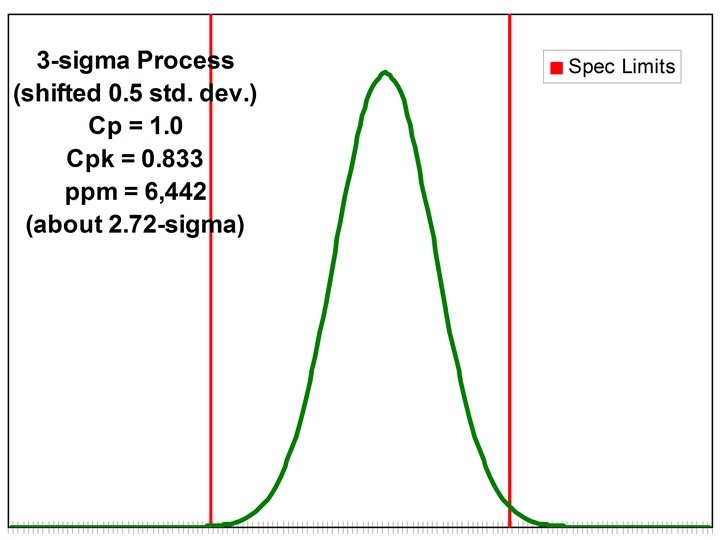
Process Drift What Happens when the Process Mean Is Not Centered between the Specification Limits?
Six Sigma: Many Meanings • • • A Symbol A Measure A Benchmark or Goal A Philosophy A Method
Six Sigma: A Symbol • is a Statistical Symbol for Standard Deviation • Standard Deviation is a Measure of Dispersion, Volatility, or Variability
Six Sigma: A Measure • The “Sigma Level” of a process can be used to express its capability — how well it performs with respect to customer requirements. • Percent Defects, Cpk, PPM
Six Sigma: A Benchmark or Goal • The specific value of 6 Sigma (as opposed to 5 or 4 Sigma) is a benchmark for process excellence. • Adopted by leading organizations as a goal for process capability.
Six Sigma: A Philosophy • A vision of process performance • Tantamount to “zero defects” • A “Management Mantra”
Six Sigma: A Method • Really a Collection of Methods: – Product/Service Design – Quality Control – Quality Improvement – Strategic Planning
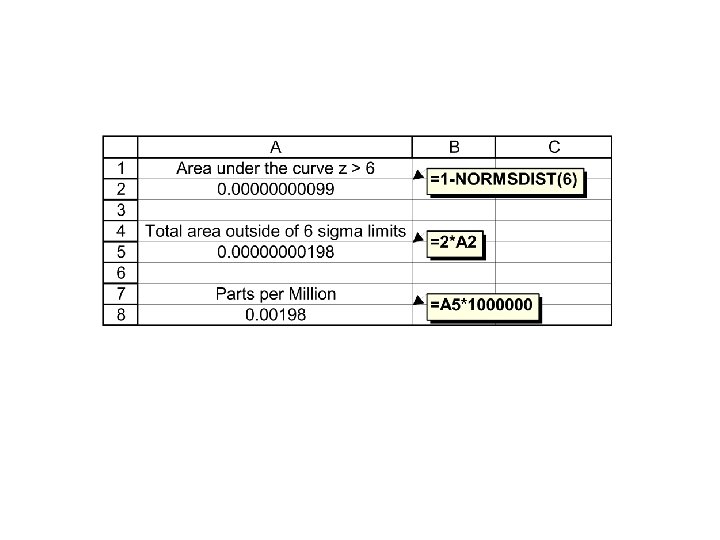
Where Does “ 3. 4 PPM” Come From? • Six Sigma is commonly defined to be equivalent to 3. 4 defective parts per million. • Juran says that a Six Sigma process will produce only 0. 002 defective parts per million. • What gives?
Normal Curve Probabilities
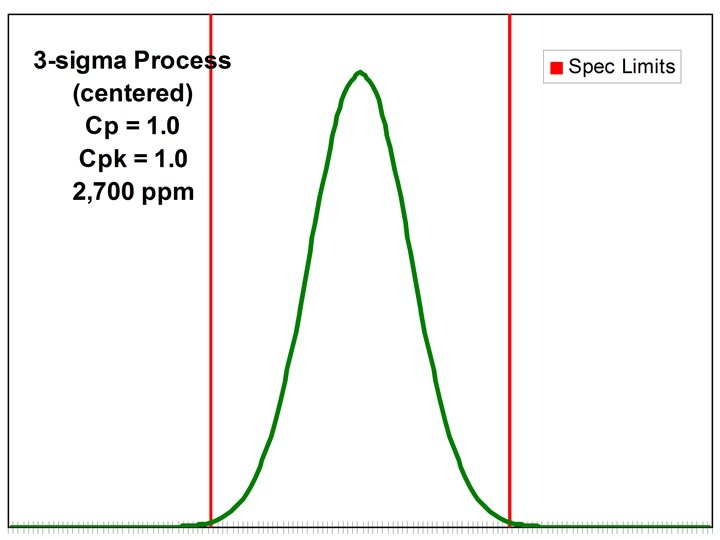
Process Centered between Spec Limits
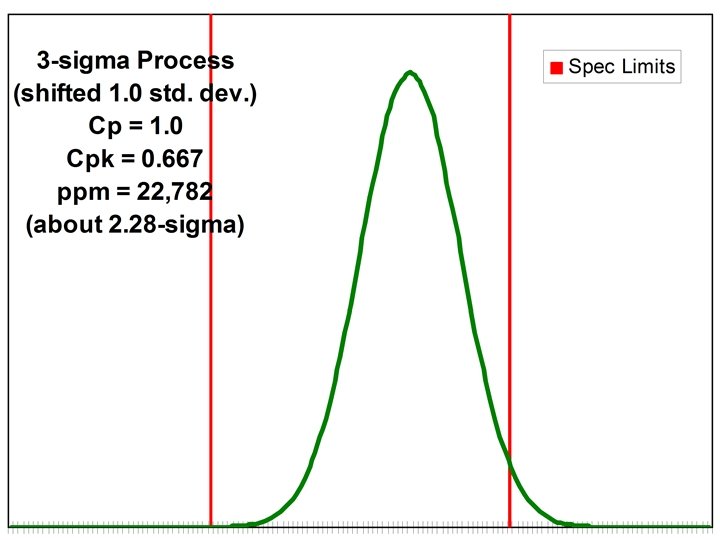
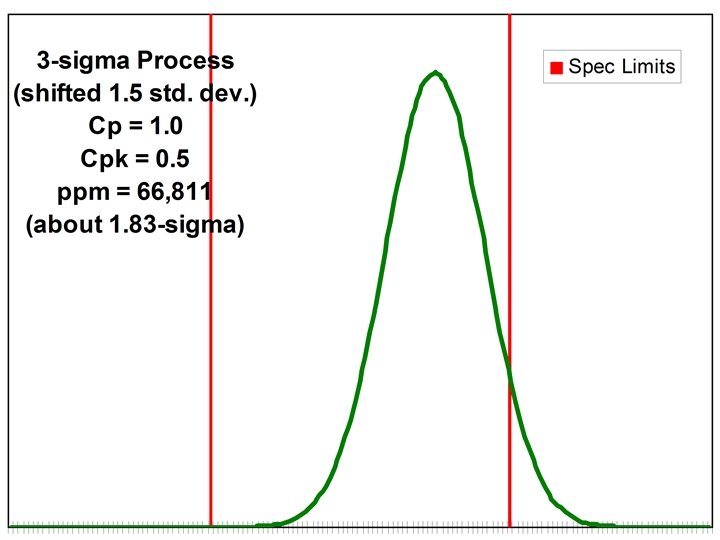
Process Shifted by 1. 5 Standard Deviations
Where Does “ 3. 4 PPM” Come From? • The 3. 4 defective parts per million definition of Six Sigma includes a “worst case” scenario of a 1. 5 standard deviation shift in the process. • It is assumed that there is a very high probability that such a shift would be detected by SPC methods (low probability of Type II error).
Six Sigma in Context • Is Six Sigma dramatically different from old-fashioned quality control? • Is Six Sigma a departure from 1980’sstyle TQM?
Six Sigma in Context • What Is New? – Focus on Quantitative Methods – Focus On Control – A Higher Standard – A New Metric for Defects (PPM) – Lots of training – Linkage between quality goals and employee incentives?
Using Six Sigma • A New Standard; Not Adopted Uniformly across Industries • Beyond Generalities, Need to Develop Organization-Specific Methods • Hard Work, Not Magic • “A Direction Not a Place”
Summary • Quality and Six Sigma: Basic ideas and history • Juran Trilogy – Control – Improvement – Planning • Quality Strategy • Focus on Statistical Methods – Process Capability ideas and metrics – Control charts for attributes and variables