Situation Outlook for Fruits and Vegetables in New

Situation & Outlook for Fruits and Vegetables in New York State Brad Rickard, Assistant Professor Department of Applied Economics & Management Agribusiness Economic Outlook Conference December 9, 2008

Presentation Overview l Situation and Outlook report for key fruit and vegetable crops U. S. farm economy l Looking ahead to 2009 and beyond l Outlook on the role that nutrition information may have for consumption patterns of F&V l Outlook on some Hortmgt activities l Crop budgets l Competitiveness analysis l Public policy and horticultural crops l
 was an above average year")
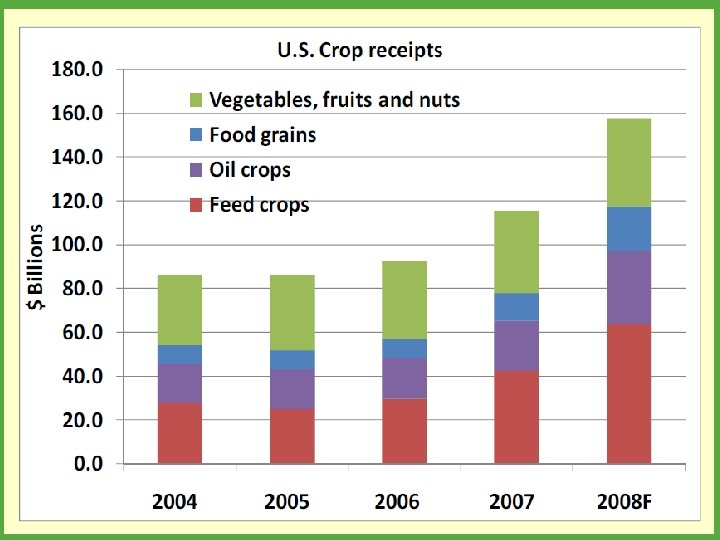
Situation Report for F&V l l Last year (2007) was an above average year for most fruit and vegetable crops, notably for apples and cherries, but not for onions Overall, 2008 is set to be remembered as a very good year for agriculture including F&V crops that were not affected by hail l l Record high prices in September for apples The outlook for 2009 is positive, yet revenues from F&Vs are expected to fall from 2008 l l Stronger USD will slow exports Recession will impact domestic sales Fuel prices are expected to remain lower in 2009 Labor should be more abundant as construction slows

Fruit Production: 2005 to 2007 TABLE 10 -1. COMMERCIAL NONCITRUS AND NONGRAPE FRUIT PRODUCTION 2005 New York 2006 Apples Fresh Processed 523 245 273 625 345 280 Tart Cherries Pears Peaches Fresh Processed Sweet Cherries 3. 8 8. 5 4. 2 2. 0 2. 2 0. 8 5. 2 16. 0 6. 7 3. 1 3. 6 1. 0 United States 2007 2005 2006 ------ Thousand tons -----635 4, 853 4, 926 340 310 6. 5 11. 2 6. 3 3. 0 3. 3 1. 2 2007 4, 671 135 823 700 132 842 651 126 880 610 250. 8 294. 2 323. 7 Sources: New York Agricultural Statistics, 2008; USDA Agricultural Statistics, 2008.

Fruit Prices: 2005 to 2007 TABLE 10 -2. FARM PRICES FOR NONCITRUS AND NONGRAPE FRUITS Apples Fresh Processed Tart Cherries Pears Peaches Fresh Processed Sweet Cherries 2005 New York 2006 324 528 141 864 499 690 900 499 1710 400 604 152 622 429 667 784 570 2290 United States 2007 2005 2006 ------ Dollars per ton -----426 348 458 682 174 672 476 432 497 358 397 634 588 650 754 525 2980 1990 1620 Sources: New York Agricultural Statistics, 2008; USDA Agricultural Statistics, 2008. 2007 516 536 393 578 1830

NFAPP Expectations in Fruit Markets: 2009 to 2011 TABLE 10 -4. ECONOMIC OUTLOOK FOR SELECTED U. S. FRUITS 2009 Apples Acres 375, 408 Yield (pounds per acre) 25, 877 Total U. S. production (million lbs) 9, 715 Total N. Y. production 1, 374 Fresh Production 5, 997 Fresh Price (cents per pound) 25. 52 Retail Price (dollars per pound) 1. 03 Fresh exports (million pounds) 1, 196 Fresh imports (million pounds) 501 Per capita consumption 17. 24 Sweet Cherries Acres 80, 900 Yield (tons per acre) 3. 4 Fresh production 389 Fresh Price 119 Fresh exports 100 Fresh imports 14 Per capita consumption 1 Peaches Acres 143, 800 Fresh production 1, 514 Fresh price 34 Retail price 1. 85 Fresh exports 275 Fresh imports 171 Per capita consumption 5. 08 Sources: National Food and Agricultural Policy Project, 2007. 2010 2011 373, 571 26, 233 9, 800 1, 393 6, 036 24. 37 1. 02 1, 213 516 17. 22 370, 554 26, 397 9, 782 1, 418 6, 062 25. 15 1. 03 1, 233 532 17. 14 82, 400 3. 3 390 123 101 14 1 83, 500 3. 3 390 127 102 15 1 144, 500 1, 535 34 1. 84 273 173 5. 09 145, 200 1, 549 35 1. 86 275 175 5. 07
")
Vegetable Production: 2005 to 2007 TABLE 10 -5. COMMERCIAL VEGETABLE PRODUCTION 2005 Fresh (9) Sweet corn Cabbage Onions Snap beans Cucumbers Tomatoes Pumpkins Squash Cauliflower 2, 679 4, 606 3, 808 300 540 360 795 796 104 New York 2006 3, 216 4, 620 4, 224 587 760 400 798 756 67 2007 United States 2005 2006 ------ Thousand cwt -----3, 300 27, 023 5, 796 24, 275 4, 428 50, 459 554 5, 541 714 9, 691 432 38, 268 1152 10, 756 731 8, 334 114 7, 285 26, 690 24, 823 51, 487 6, 365 9, 709 36, 800 10, 340 9, 224 7, 013 2007 28, 234 25, 824 57, 836 6, 465 9, 352 37, 032 11, 164 7, 888 6, 990 Processing (4) ------ Thousand tons -----Sweet corn 116 115 3, 175 3, 086 2, 897 Snap beans 69 74 819 786 768 Green peas 30 39 383 410 436 Cabbage 76 72 72 Sources: New York Agricultural Statistics, 2008; USDA Agricultural Statistics, 2008.

Vegetable Prices: 2005 to 2007 TABLE 10 -6. FARM PRICES FOR COMMERCIAL VEGETABLES Fresh Sweet corn Cabbage Onions Snap beans Cucumbers Tomatoes Pumpkins Squash Cauliflower New York 2005 2006 22. 60 15. 90 15. 20 76. 80 28. 30 59. 60 27. 60 36. 60 32. 20 23. 50 15. 70 19. 40 82. 00 34. 70 76. 90 23. 60 37. 40 42. 00 2007 United States 2005 2006 ------ Dollars per cwt -----22. 00 22. 10 19. 40 13. 70 12. 60 9. 34 89. 80 54. 20 34. 30 23. 00 75. 20 41. 80 19. 70 9. 64 38. 90 25. 70 34. 10 30. 50 2007 22. 90 14. 10 15. 20 50. 50 25. 30 44. 00 9. 89 24. 20 31. 50 22. 20 16. 40 6. 21 60. 50 24. 40 34. 50 10. 50 28. 80 34. 00 Processing ------ Dollars per ton -----Sweet corn 80. 40 77. 30 68. 40 66. 80 Snap beans 186. 00 204. 00 140. 00 157. 00 Green peas 385. 00 345. 00 266. 00 243. 00 Cabbage 50. 80 55. 10 61. 60 Sources: New York Agricultural Statistics, 2008; USDA Agricultural Statistics, 2008. 81. 80 169. 00 256. 00 -

TABLE 10 -8. ECONOMIC OUTLOOK FOR SELECTED U. S. VEGETABLES Summer Storage Onions Acres Yield (cwt) Production (000 cwt) Grower price ($ per cwt) N. Y. grower price Exports (thousand cwt) Imports Per capita consumption Fall Potatoes Acres Yield Production U. S. grower price N. Y. grower price Retail price (fresh) Fresh consumption Frozen consumption Sweet corn Acres Yield (tons) Production (000 tons) U. S. grower price ($/ton) N. Y. grower price Frozen exports Frozen imports Frozen consumption Canned exports Canned imports Canned consumption Sources: 2009 2010 2011 167, 171 460 76, 902 10. 92 14. 17 5, 581 7, 319 20. 2 167, 909 456 76, 591 11. 61 15. 06 5, 507 7, 626 20. 4 169, 165 460 77, 736 11. 32 14. 68 5, 484 7, 534 20. 7 1, 017, 500 388 412, 816 6. 07 8. 89 0. 58 42. 1 54. 2 1, 018, 200 394 417, 120 6. 07 8. 88 0. 61 42. 0 54. 0 1, 019, 300 399 421, 722 6. 08 8. 90 0. 63 41. 9 53. 9 396, 800 7. 6 2, 860 67. 95 72. 15 236 846 7. 8 248 297 6. 3 393, 800 7. 7 2, 853 67. 70 71. 93 238 854 7. 8 242 287 6. 1 391, 400 7. 7 2, 847 67. 69 71. 92 241 861 7. 8 235 277 5. 9 National Food and Agricultural Policy Project, 2007. NFAPP Expectations for Vegetables: 2009 to 2016

Driving Forces in Markets for F&V l Production l l Trade l l l Technology, yields, acres Exchange rates Competitiveness issues Consumption l l l Per capita consumption rates for many F&V is flat nationally, yet there is a lot of variability among sub-populations Rates are much higher in Canada and EU Income? Promotion? Nutrition information?

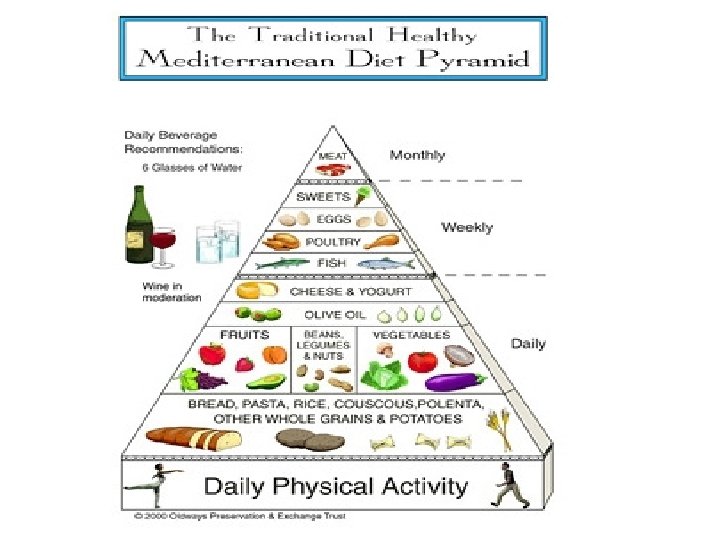
Nutrition Policy In 2005 the USDA released a new version of the Dietary Guidelines for Americans and a new Food Guide Pyramid… My. Pyramid l l l Dietitians, physicians, school teachers, institutions, and some consumers use these tools to develop healthier eating habits Healthier eating habits benefit food consumers and reduce health costs; they would also benefit F&V producers
")
USDA Food Guide (2005)
")
USDA Food Pyramid (1992)
")
Willett Food Pyramid (Harvard)

Mayo Clinic Model
 menus")
Decomposing the Various FGPs into Nutrient Recommendations l l l Follow (or create) menus for each food pyramid and use to establish the daily required nutrient intakes Compare the required intakes with actual consumption patterns among food consumers in the United States Simulate the effects of compliance with various Food Guide Pyramids

Nutrient Consumption Levels: 7 Food Guides and 15 Nutrients

Impacts of Compliance on Agricultural Revenues Compliance with FGPs would ultimately affect demand for nutrients l Agricultural products are comprised of different “baskets” of nutrients… l Given the nutrient composition of agricultural products, we determined how compliance with various food guide pyramids would impact revenues for agricultural products l

Results for 50 Agricultural Products

Results for 50 Agricultural Products
 2) 3) 4) 5) 6) 7) 8)")
Next Step: 15 Nutrients +10 Phyto-chemicals 1) 2) 3) 4) 5) 6) 7) 8) 9) 10) Isothiocyanates Indoles: broccoli, kale Allyl Sulfides: onions, garlic Ellagic Acid: various berries Flavonoids: grapes, cherries, apples Isoflavones: various beans and peas Limonoids: citrus Lycopene: tomatoes, watermelon β-Carotene: carrots, squash, stone fruits Lutein: various dark leafy greens Zeaxanthin: orange peppers, corn

Hortmgt Program Outlook http: //hortmgt. aem. cornell. edu l Continue to work on economic issues that are important to fruit, vegetable, and ornamental sectors in NYS l l Focus on projects that are relevant to stakeholders in NYS Program is organized along the supply chain as many issues apply to a range of horticultural crops Input suppliers producers processors l Wholesalers retailers consumers l

Some Current Projects in Hortmgt Demand for organic vs. local vs. nutrient dense vs. low fat foods l EU policies applied to horticultural products and global implications l Import demand for specialty crops l Examine implications of nutrition policy provisions in the 2008 Farm Bill l Investigating the link between farm bill expenditures, food prices, and obesity in the U. S. and elsewhere l

Competitiveness Issues l l l Develop cost of production studies for key F&V commodities in NYS Review data that describes yields, prices, acreage, and input costs for key F&Vs in New York and Ontario Competitiveness analysis focuses on trends and patterns in: l a) production and technology l b) consumption and marketing l c) activities in supporting industries l d) government policy l e) factors that are external to both NY and ON

UCCE Cost Studies http: //www. coststudies. ucdavis. edu

UCCE Cost Studies http: //www. coststudies. ucdavis. edu

UCCE Cost Studies http: //www. coststudies. ucdavis. edu
 l l l")
Value of F&V Production: NYS and Ontario New York State (2007) l l l l l Crop Value Apples Grapes Sweet Corn Onions Snap beans Cabbage Peaches Berries Cherries (million) $250 $75 $50 $100 $5 $17 $8 Ontario (2007) l l l l l Crop Value Apples Grapes Sweet corn Onions Snap Beans Cabbage Peaches Field tomatoes Greenhouse Veg (million) $75 $80 $25 $15 $35 $70 $300

Farm Bills and Horticultural Crops: Food Conservation and Energy Bill of 2008 l Titles I to XV (5 new Titles from 2002 Farm Bill) l Title I (Commodities): Payment rates, Base-acres l Title III (Trade): new Softwood Lumber Program l Title IV (Nutrition): more programs, more money l Title VII (Research): SCRI introduced l Title IX (Energy): expanded biofuel provisions l Title X (Horticultural and Organic Products) New! l Title XI (Livestock) New! l Title XII (Crop Insurance) New! l Title XIII (Commodity Futures) New! l Title XV (Trade and Taxes) New!

Public Policy Topics that Apply to F&V Sectors l Nutrition policy l l l Trade policy l l l Provisions to include F&V in WIC Food labels Assistance in foreign markets for F&V Food safety regulations Crop insurance Research and development support Policies that govern how producers and processors are organized Restrictions on sales of wine in NYS

Thank you. Comments or questions? bjr 83@cornell. edu
- Slides: 39