
SiteSpecific Criteria Changes Jason Godeaux Water Quality Standards


- Slides: 17
Site-Specific Criteria Changes Jason Godeaux Water Quality Standards Site Specific Coordinator
Use-Attainability Analysis (UAA) • Assessment of the physical, chemical, biological, and economic factors affecting attainment of a water body use • Conducted to evaluate & determine the attainable use of a water body • Used to support adding or removing a use • Prospective analysis of future attainability of designated uses • provides the demonstration necessary to support a use change
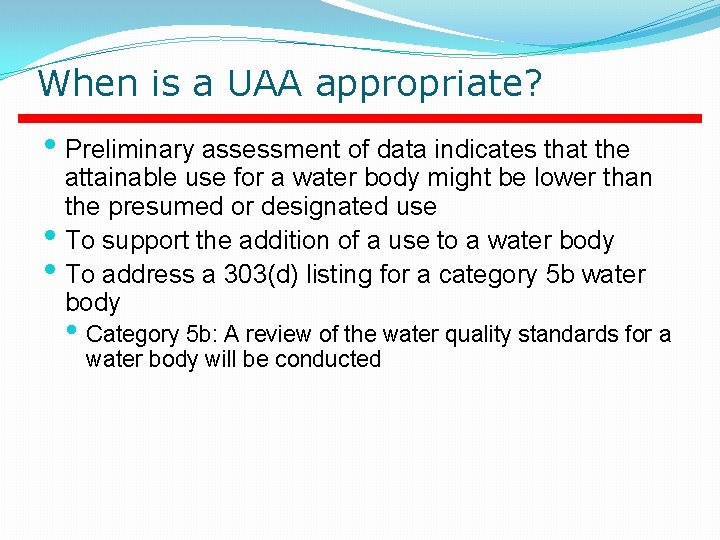
When is a UAA appropriate? • Preliminary assessment of data indicates that the attainable use for a water body might be lower than the presumed or designated use • To support the addition of a use to a water body • To address a 303(d) listing for a category 5 b water body • Category 5 b: A review of the water quality standards for a water body will be conducted
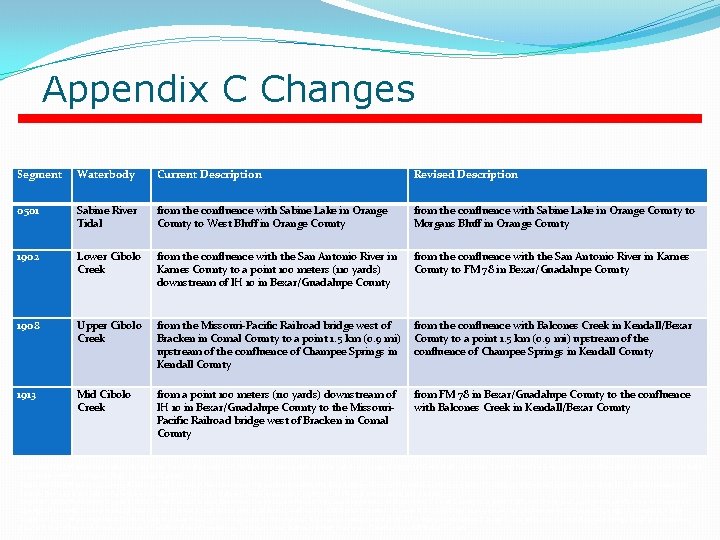
Site-Specific Changes • 4 description changes in Appendix C • 3 changes based on UAAs and RWAs
Appendix C Changes Segment Waterbody Current Description Revised Description 0501 Sabine River Tidal from the confluence with Sabine Lake in Orange County to West Bluff in Orange County from the confluence with Sabine Lake in Orange County to Morgans Bluff in Orange County 1902 Lower Cibolo Creek from the confluence with the San Antonio River in Karnes County to a point 100 meters (110 yards) downstream of IH 10 in Bexar/Guadalupe County from the confluence with the San Antonio River in Karnes County to FM 78 in Bexar/Guadalupe County 1908 Upper Cibolo Creek from the Missouri-Pacific Railroad bridge west of Bracken in Comal County to a point 1. 5 km (0. 9 mi) upstream of the confluence of Champee Springs in Kendall County from the confluence with Balcones Creek in Kendall/Bexar County to a point 1. 5 km (0. 9 mi) upstream of the confluence of Champee Springs in Kendall County 1913 Mid Cibolo Creek from a point 100 meters (110 yards) downstream of IH 10 in Bexar/Guadalupe County to the Missouri. Pacific Railroad bridge west of Bracken in Comal County from FM 78 in Bexar/Guadalupe County to the confluence with Balcones Creek in Kendall/Bexar County Segment 0501 Waterbody Sabine River Tidal Current Description from the confluence with Sabine Lake in Orange County to West Bluff in Orange County Revised Description from the confluence with Sabine Lake in Orange County to Morgans Bluff in Orange County Segment 1902 Waterbody Lower Cibolo Creek Current Description from the confluence with the San Antonio River in Karnes County to a point 100 meters (110 yards) downstream of IH 10 in Bexar/Guadalupe County Revised Description from the confluence with the San Antonio River in Karnes County to FM 78 in Bexar/Guadalupe County Segment 1908 Waterbody Upper Cibolo Creek Current Description from the Missouri-Pacific Railroad bridge west of Bracken in Comal County to a point 1. 5 km (0. 9 mi) upstream of the confluence of Champee Springs in Kendall County Revised Description from the confluence with Balcones Creek in Kendall/Bexar County to a point 1. 5 km (0. 9 mi) upstream of the confluence of Champee Springs in Kendall County Segment 1913 Waterbody Mid Cibolo Creek Current Description from a point 100 meters (110 yards) downstream of IH 10 in Bexar/Guadalupe County to the Missouri-Pacific Railroad Bridge west of Bracken in Comal County Revised Description from FM 78 in Bexar/Guadalupe County to the confluence with Balcones Creek in Kendall/Bexar County
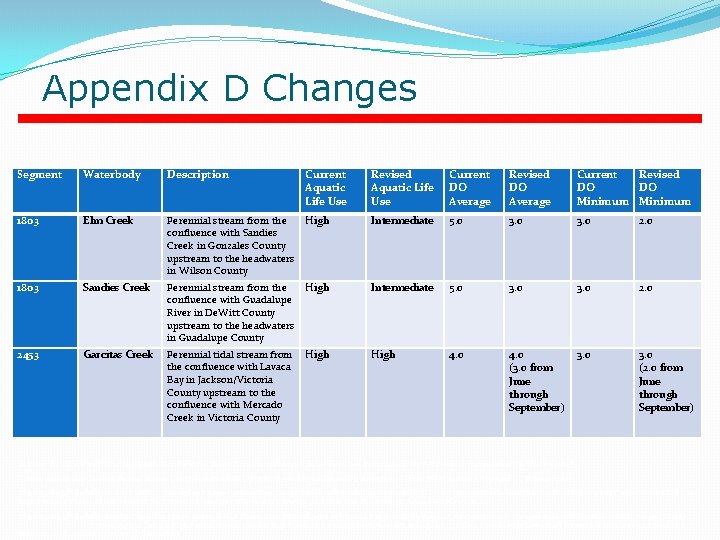
Appendix D Changes Segment Waterbody Description Current Aquatic Life Use Revised Aquatic Life Use Current DO Average Revised DO Average Current Revised DO DO Minimum 1803 Elm Creek Perennial stream from the confluence with Sandies Creek in Gonzales County upstream to the headwaters in Wilson County High Intermediate 5. 0 3. 0 2. 0 1803 Sandies Creek Perennial stream from the confluence with Guadalupe River in De. Witt County upstream to the headwaters in Guadalupe County High Intermediate 5. 0 3. 0 2453 Garcitas Creek Perennial tidal stream from the confluence with Lavaca Bay in Jackson/Victoria County upstream to the confluence with Mercado Creek in Victoria County High 4. 0 (3. 0 from June through September) 3. 0 (2. 0 from June through September) Segment 1803 Waterbody Elm Creek Description Perennial stream from the confluence with Sandies Creek in Gonzales County upstream to the headwaters in Wilson County Current Aquatic Life Use High Revised Aquatic Life Use Intermediate Current DO Average 5. 0 Revised DO Average 3. 0 Current DO Minimum 3. 0 Revised DO Minimum 2. 0 Segment 1803 Waterbody Sandies Creek Description Perennial stream from the confluence with Guadalupe River in De. Witt County upstream to the headwaters in Guadalupe County Current Aquatic Life Use High Revised Aquatic Life Use Intermediate Current DO Average 5. 0 Revised DO Average 3. 0 Current DO Minimum 3. 0 Revised DO Minimum 2. 0 Segment 2453 Waterbody Garcitas Creek Description Perennial tidal stream from the confluence with Lavaca Bay in Jackson/Victoria County upstream to the confluence with Mercado Creek in Victoria County Current Aquatic Life Use High Revised Aquatic Life Use High Current DO Average 4. 0 Revised DO Average 4. 0 (3. 0 from June through September) Current DO Minimum 3. 0 Revised DO Minimum 3. 0 (2. 0 from June through September)
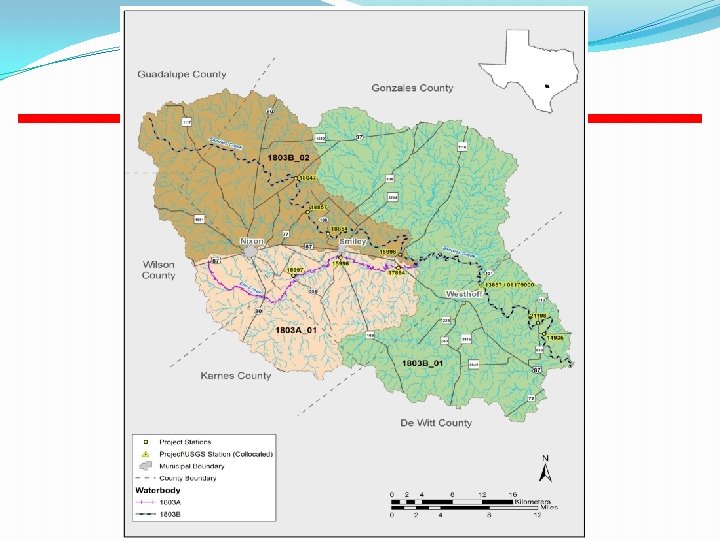
Elm and Sandies Creeks • Two Studies Conducted • Study conducted by Texas Institute for Applied Environmental Research(TIAER) under a contract by the TMDL group in 2002 and 2003 • Follow up study conducted by TIAER under a contract by the WQS group in 2013 and 2014
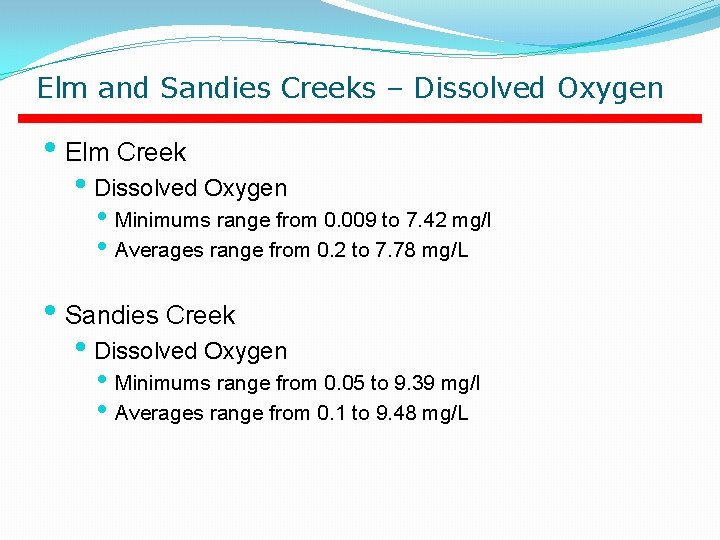
Elm and Sandies Creeks – Dissolved Oxygen • Elm Creek • Dissolved Oxygen • Minimums range from 0. 009 to 7. 42 mg/l • Averages range from 0. 2 to 7. 78 mg/L • Sandies Creek • Dissolved Oxygen • Minimums range from 0. 05 to 9. 39 mg/l • Averages range from 0. 1 to 9. 48 mg/L
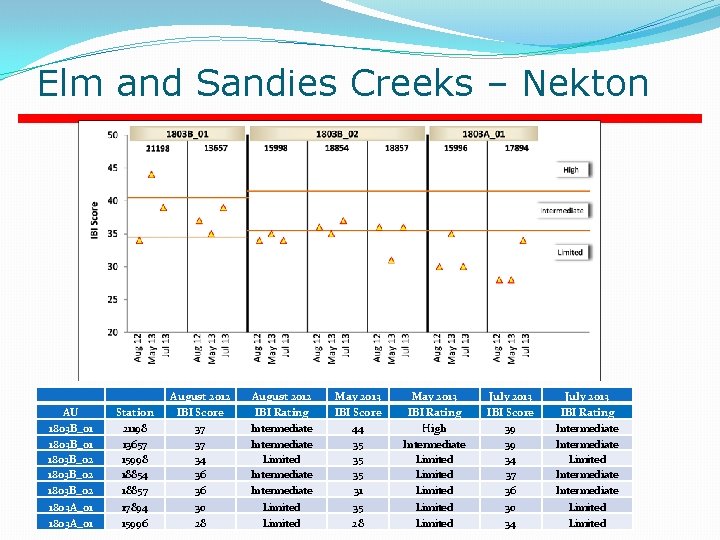
Elm and Sandies Creeks – Nekton August 2012 May 2013 July 2013 1803 B_02 1803 A_01 18854 18857 17894 15996 36 36 30 28 Intermediate Limited 35 31 35 28 Limited 37 36 30 34 Intermediate Limited AU 1803 B_01 Station 21198 August 2012 IBI Score 37 IBI Rating Intermediate May 2013 IBI Score 44 IBI Rating High July 2013 IBI Score 39 IBI Rating Intermediate AU Station 13657 Station IBI Score IBI Rating AU 1803 B_01 August 2012 IBI Score 37 IBI Rating Intermediate May 2013 35 Intermediate July 2013 39 Intermediate AU 1803 B_02 Station 15998 August 2012 IBI Score 34 IBI Rating Limited May 2013 IBI Score 35 IBI Rating Limited July 2013 IBI Score 34 IBI Rating Limited 1803 B_01 21198 37 Intermediate 44 High 39 Intermediate AU 1803 B_02 Station 18854 August 2012 IBI Score 36 IBI Rating Intermediate May 2013 IBI Score 35 Limited July 2013 IBI Score 37 IBI Rating Intermediate AU 1803 B_02 Station 18857 August 2012 IBI Score May 2013 IBI Score 31 July 2013 IBI Score 36 IBI Rating 1803 B_01 13657 3736 IBI Rating Intermediate 35 IBI Rating Limited Intermediate 39 Intermediate AU 1803 A_01 Station 17894 August 2012 IBI Score 30 IBI Rating Limited May 2013 IBI Score 35 IBI Rating Limited July 2013 IBI Score 30 IBI Rating Limited 1803 B_02 15998 34 Limited 35 Limited 34 Limited AU 1803 A_01 Station 15996 August 2012 IBI Score 28 IBI Rating Limited May 2013 IBI Score 28 IBI Rating Limited July 2013 IBI Score 34 IBI Rating Limited
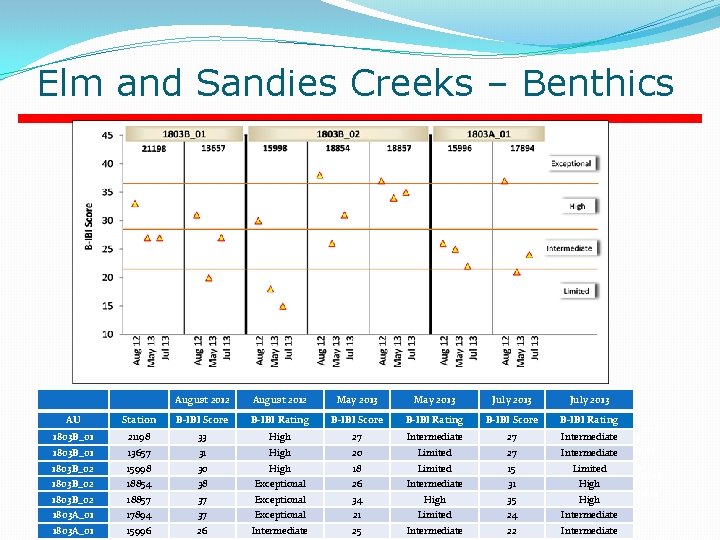
Elm and Sandies Creeks – Benthics August 2012 May 2013 July 2013 AU 1803 B_01 Station 21198 August 2012 B-IBI Score 33 B-IBI Rating High May 2013 B-IBI Score 27 B-IBI Rating Intermediate July 2013 B-IBI Score 27 B-IBI Rating Intermediate AU Station B-IBI Score B-IBI Rating AU 1803 B_01 Station 13657 August 2012 B-IBI Score 31 B-IBI Rating High May 2013 B-IBI Score 20 B-IBI Rating Limited July 2013 B-IBI Score 27 B-IBI Rating Intermediate 21198 August 2012 B-IBI 33 Score 30 B-IBI Rating High May 2013 B-IBI 27 Score 18 B-IBI Intermediate 27 B-IBI Score 15 Intermediate AU 1803 B_01 1803 B_02 Station 15998 Rating Limited July 2013 B-IBI Rating Limited AU 1803 B_02 Station 18854 August 2012 B-IBI Score 38 B-IBI Rating Exceptional May 2013 B-IBI Score 26 B-IBI Rating Intermediate July 2013 B-IBI Score 31 B-IBI Rating 1803 B_01 13657 31 High 20 Limited 27 Intermediate High AU 1803 B_02 Station 18857 2013 B-IBI Score Limited 34 B-IBI Rating High July 15 2013 B-IBI Score Limited 35 B-IBI Rating High 15998 August 2012 B-IBI 30 Score 37 B-IBI Rating High Exceptional May 18 AU 1803 A_01 Station 17894 August 2012 B-IBI Score 37 B-IBI Rating Exceptional May 2013 B-IBI Score 21 B-IBI Rating Limited July 2013 B-IBI Score 24 B-IBI Rating Intermediate 1803 B_02 18854 38 Exceptional 26 Intermediate 31 High AU 1803 A_01 Station 15996 August 2012 B-IBI Score 26 B-IBI Rating Intermediate May 2013 B-IBI Score 25 B-IBI Rating Intermediate July 2013 B-IBI Score 22 B-IBI Rating 1803 B_02 18857 37 Exceptional 34 High 35 High Intermediate 1803 A_01 17894 37 Exceptional 21 Limited 24 Intermediate 1803 A_01 15996 26 Intermediate 25 Intermediate 22 Intermediate
Garcitas Creek • Study conducted by Texas Parks and Wildlife under a contract by the TMDL Team at TCEQ • Data Collected in 2003 and 2004 • Second of three studies on tidally influenced streams • Study objectives • Develop assessment methodology for tidally influenced streams • Identify the most appropriate sampling equipment • Determine appropriate uses
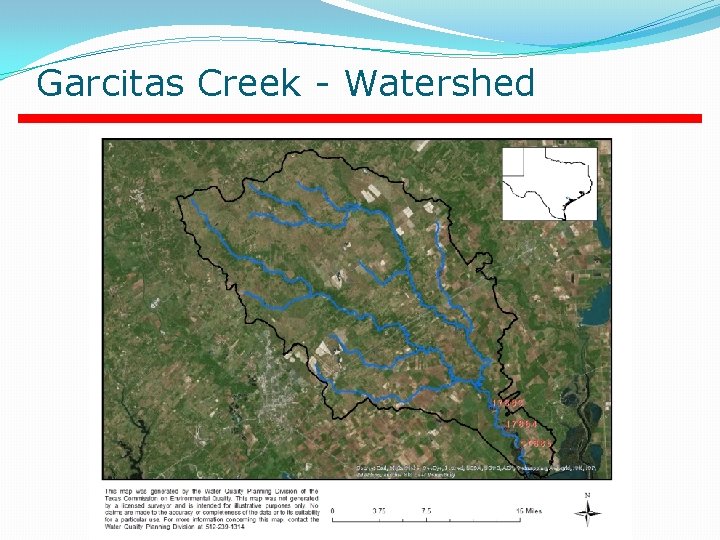
Garcitas Creek - Watershed
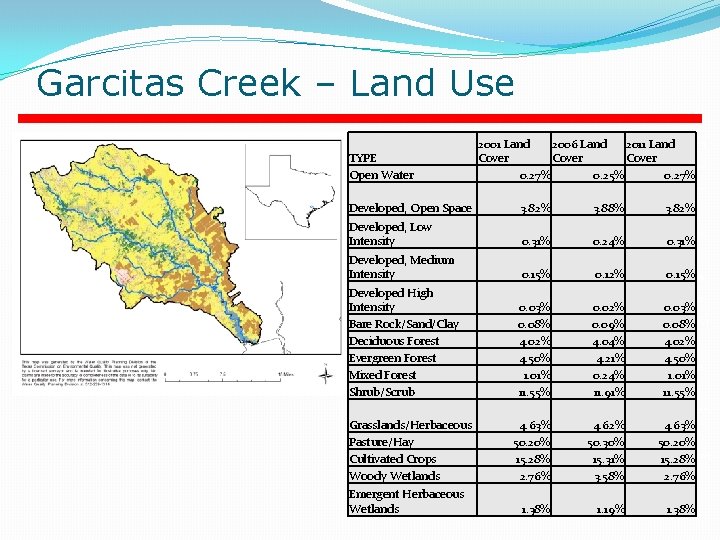
Garcitas Creek – Land Use Land Cover Type Open Water 2001 Land Cover 2006 0. 27%Land 2006 Land 2011 Cover 0. 25% 2011 Land Cover 0. 27% TYPE Cover Land Cover Type Developed, Open Space 2001 Land Cover 3. 82% 2006 Land Cover Open 0. 27% 0. 25% 0. 27% 3. 88%Water 2011 Land Cover 3. 82% Land Cover Type Developed, Low Intensity 2001 Land Cover 0. 31% 2006 Land Cover 0. 24% 2011 Land Cover 0. 31% Developed, Open Space Medium Intensity 3. 82%2001 Land 3. 88% 3. 82% Land Cover Type Developed, Cover 0. 15% 2006 Land Cover 0. 12% 2011 Land Cover 0. 15% Developed, Low Land Cover Type Developed High Intensity 2001 Land Cover 0. 03% 2006 Land Cover 0. 31% 0. 24% 0. 31% Intensity 0. 02% 2011 Land Cover 0. 03% Land Cover Type Bare Rock/Sand/Clay 2001 Land Cover 0. 08% 2006 Land Cover Developed, Medium 0. 09% 2011 Land Cover 0. 08% 0. 12% 0. 15% Intensity Land Cover Type Deciduous Forest 20010. 15% Land Cover 4. 02% 2006 Land Cover 4. 04% 2011 Land Cover 4. 02% Developed High Land Cover Type Evergreen Forest 2001 Land Cover 4. 50% 2006 Land Cover 4. 21% 0. 03% 0. 02% 0. 03% Intensity 2011 Land Cover 4. 50% Land. Rock/Sand/Clay Cover Type Mixed Forest 2001 Land Cover 1. 01% 2006 Land Cover 0. 24% 2011 Bare 0. 08% 0. 09% 0. 08% Land Cover 1. 01% Deciduous Forest 4. 02% 4. 04% 4. 02% Land Cover Type Shrub/Scrub 2001 Land Cover 11. 55% 2006 Land Cover 11. 91% 2011 Land Cover 11. 55% Evergreen Forest 4. 50% 4. 21% 4. 50% Land Cover Type Grasslands/Herbaceous 2001 Land Cover 4. 63% 2006 Land Cover Mixed Forest 1. 01% 0. 24% 1. 01% 4. 62% 2011 Land Cover 4. 63% Land Cover Type Pasture/Hay 2001 Land Cover 50. 20% 2006 Land Cover 50. 30% Shrub/Scrub 11. 55% 11. 91% 11. 55% 2011 Land Cover 50. 20% Land Cover Type Cultivated Crops 2001 Land Cover 15. 28% 2006 Land Cover 15. 31% 2011 Land Cover 15. 28% Grasslands/Herbaceous 4. 63% 4. 62% 4. 63% Land Cover Type Woody Wetlands 2001 Land Cover 2. 76% 2006 Land Cover 3. 58% Pasture/Hay 50. 20% 50. 30% 50. 20% 2011 Land Cover 2. 76% Land Cover Type Emergent Herbaceous Wetlands 2001 Land Cover 1. 38% 2006 Land Cultivated Crops 15. 28% 15. 31% 15. 28% Cover 1. 19% 2011 Land Cover 1. 38% Woody Wetlands 2. 76% 3. 58% 2. 76% Emergent Herbaceous Wetlands 1. 38% 1. 19% 1. 38%
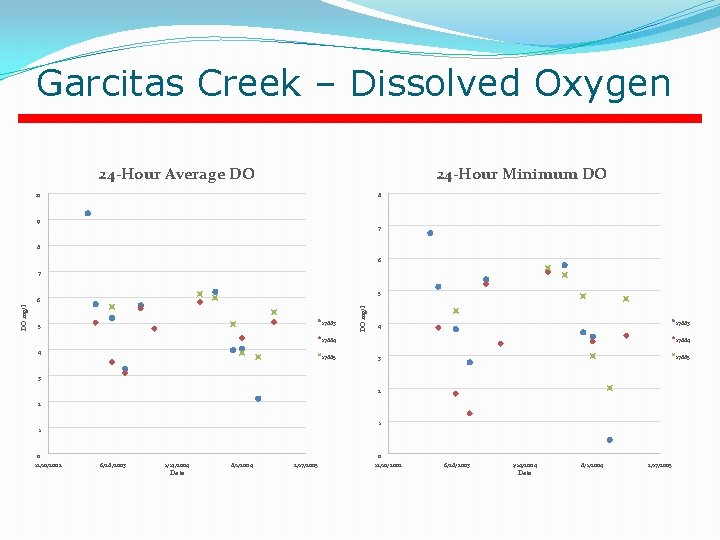
Garcitas Creek – Dissolved Oxygen 24 -Hour Average DO 24 -Hour Minimum DO 10 8 9 7 8 6 7 5 17883 5 DO mg/l 6 17883 4 17884 4 17885 17884 17885 3 3 2 2 1 1 0 12/10/2002 0 6/28/2003 1/14/2004 Date 8/1/2004 2/17/2005 12/10/2002 6/28/2003 1/14/2004 Date 8/1/2004 2/17/2005
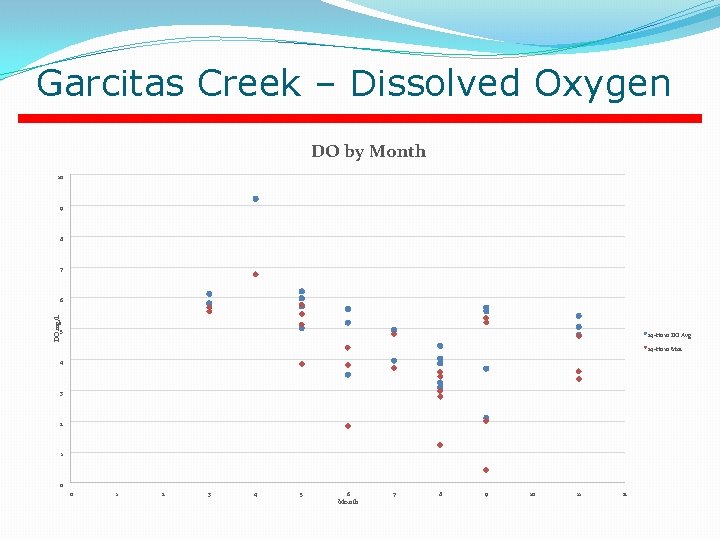
Garcitas Creek – Dissolved Oxygen DO by Month 10 9 8 7 DO mg/L 6 5 24 -Hour DO Avg 24 -Hour Min 4 3 2 1 0 0 1 2 3 4 5 6 Month 7 8 9 10 11 12
Contact Information Jason Godeaux jason. godeaux@tceq. texas. gov (512) 239 -2495 Email general questions to: standards@tceq. texas. gov