Sistemas de observacin en Meteorologa y Clima algo
")
Sistemas de observación en Meteorología y Clima (+algo de paleoclima)

Estación meteorológica convencional Cobertizo meteorológico: Mediciones una vez al día o cada 6 horas Termómetro (Hg) normal y max/min Termómetro de bulbo húmedo/seco (q) Higrómetro de cabello (HR) Barómetro (presión) Pluviómetro Anemómetro-veleta Heliógrafo (horas de sol)
 Observaciones met. cada 6 horas")
Red de estaciones Sinópticas en Superficie (tierra + océanos) Observaciones met. cada 6 horas (UTC): 0, 6, 12, 18 (Chile HL=UTC-4)

Estación meteorológica automática • Mediciones más frecuentes (1 h, 1 min, 1 seg, etc. . . ) • Monitoreo en tiempo real / remoto / continuo • Post-procesamiento de la información (alertas) Termómetro e higrómetro Piranómetro (Rad. Solar / neta) Pluviómetro Anemómetro-veleta Otros sensores Datalogger – modulo memoria Sistema de transmisión (tel. , radio, sat) Muchas instituciones poseen EMAS para sus propósitos específicos…. (e. g. , calidad del aire, seguridad vial, etc. )
 http: //vismet. cr 2. cl Incorpora estaciones DMC,")
Visualizador Meteorológico CR 2 (Vis. Met) http: //vismet. cr 2. cl Incorpora estaciones DMC, DGA, Agro. Met
 Perfiles verticales (hasta unos 20 km de altura) de")
Red de Radiosondas (OMM, GTS) Perfiles verticales (hasta unos 20 km de altura) de Temperatura, Humedad, viento, presión. Lanzamientos cada 12 / 24 hr @ 300 US$/vuelo

Radares meteorológicos: emplean dispersión de ondas de radio por hidrometeoros y efecto doppler para determinar precipitación y viento. Muy usados pero caros (US$ 1 Mill)…no existen en Chile 200 km ea Ar de n ció ita ip ec pr sa n te in

Imagen Visible Satélite TERRA MODIS 14 HL 23 Abril 2015 Nubes Santiago Múltiples satélites ambientales, la Concepción mayoría de orbita polar (1 paso por día) Plu m lca a nic a Vo Nub es GFS-HYSPLIT Trayectoria Pronosticada Partículas entre 7 -10 km Puerto Montt Fuente: NASA World. View https: //earthdata. nasa. gov/labs/worldview/ © CR 2 + DGF-UCh

GOES: Geostationary Environmental Satellite. NOAA-EEUU Posee un radiómetro multicanal para obtener imágenes visibles, infrarrojas, vapor de agua, etc. Actualmente GOES-16 cada 15 min! IR WV VIS

Gracias GOES-16 1 km – 15 min! 6 -Sep-2018 – 12: 45 HL
 Temporal coverage and")
Climate data issues • • • Temporal resolution (daily, monthly, yearly) Temporal coverage and continuity Quality and QControl Station data versus gridded products Spatial context Multi variable records (T, P, …. ) Data sources Data formats (ASCII, Net. CDF, never Excel!) Data sharing etiquette
 Precipitation Mean Temperature All stations (anytime, any length) Century-long")
Global Historical Climate Network (GHCN) Precipitation Mean Temperature All stations (anytime, any length) Century-long stations (Ti<1905, Tf>1995, missdata<20%)
 Surface Observations Gridding Method (Re)Analysis")
DATA SOURCES AND PRODUCTS Gridded fields (T, Prec, SLP) Surface Observations Gridding Method (Re)Analysis (all atmos vars) Upper air data Satellite Products Assimilation Numerical Model
…which one suits you better? Station data Gridded datasets (Re)")
Climate data (>30 years long)…which one suits you better? Station data Gridded datasets (Re) Analysis Data source Surface obs (mostly over land) of R, T, SLP Surface and upper air obs, of all meteorological variables, satellite data Interpolation method No interpolation Statistical method (cokrigging, etc) Assimilation of obs on first guess fields provided by a numerical model Available vars T, R, SLP (each derived independently) All atmospheric variables (even if not measured such as R, w, radiation…) Coverage Mostly continents Global Spatial resolution Point data From 2. 5º down to 5 km From 2. 5º down to 50 km Temporal span From mid or early 20 th century to date. Temporal resolution Daily, monthly…. Monthly 6 -h, daily, monthly…. . Advantages The actual stuff, no bias Direct method, very close to reality, no bias, no gaps Full 3 D, physically consistent representation of atmospheric circulation, no gaps… Disadvantages Local information. May have gaps. Limited to land areas with enough observation Computationally expensive, model dependent, may contain biases A few examples GHCN, local weather service CRU, GHCN, UDEL NCEP-NCAR Reanalysis 1, NN 20 th century reanalysis, ERA-5, MERRA

Table 1. Main features of datasets commonly used in climate studies Dataset Input data Variables Key references Spatial resolution Coverage Time span Time resolution Station GHCN Peterson and Vose (1997) Sfc. Obs Precip and SAT N/A Land only 1850(*) – present Daily and Monthly Gridded GHCN Peterson and Vose (1997) Sfc. Obs Precip and SAT 5° lat-lon Land only 1900 – present Monthly Gridded UEA-CRU New et al. 2000 Sfc. Obs Precip and SAT 3. 75° 2. 5° lat-lon Land only 1900 – present Monthly Gridded UEA-CRU 05 Mitchell and Jones (2005) Sfc. Obs Precip and SAT 0. 5° lat-lon Land only 1901 – present Monthly Griddded U. Delware Legates and Willmott (1999 a, b) Sfc. Obs Precip and SAT 0. 5° lat-lon Land only 1950 – 1999 Monthly Gridded SAM-CDC data Liebmann and Allured (2005) Sfc. Obs Precip 1° lat-lon South America 1940 – 2006 Daily and Monthly Gridded CMAP Xie and Arkin (1987) Sfc. Obs. ; Sat. data Precip 2. 5° lat-lon Global 1979 – present Pentad and Monthly Gridded GCPC Adler et al. (2003) Sfc. Obs. ; Sat. data Precip 2. 5° lat-lon Global 1979 – present Monthly NCEP-NCAR Reanalysis (NNR) Kalnay et al. 1996 Kistler et al. 2001 Sfc. Obs. ; UA Obs; Sat. data Pressure, temp. , winds, etc. 2. 5° lat-lon, 17 vertical levels Global 1948 – present 6 hr, daily, monthly ECMWF Reanalysis (ERA-40) + ERA 5 Uppala et al. (2005) Sfc. Obs. , UA Obs, Sat. data Pressure, temp. , winds, etc. 2. 5° lat-lon, 17 vertical levels Global. 0. 5° 1948 – present 6 hr, daily, monthly Sfc. Obs. ; UA Obs; Sat. data Pressure, temp. , winds, etc. 2. 5° lat-lon, 17 vertical levels Global 1890– p 2017 6 hr, daily, monthly NCEP-NCAR Reanalysis 20 th century

Reanalysis? ! Because analysis are produced in real-time, some data is not assimilated, but it was archived. In the 90’s the NCEP-NCAR (USA) began a major project in which they re-run their assimilation system with all the available data. The result is the widely used “Reanalysis” data, including many fields (air temperature, wind, pressure) on a regular 2. 5°x 2. 5° lat-lon grid, from 1948 to present every 6 hours (also available daily, monthly and longterm-means). Fields are 2 - or 3 -Dimensional. Preferred data format: Net. CDF. Freely available.

Reanalysis system also includes a meteorological model from which precipitation and other not-observed variables (e. g. , vertical motion) are derived. Reanalysis data is great for studying interannual and higher frequency variability. Interdecadal variability and trends are not so well depicted (we don’t trust much before the 70’s, particularly in the SH). European Center (ECMWF) did a similar effort (ERA 15 and ERA-40). Higher horizontal resolution (1. 25°x 1. 25°), but harder to get.

http: //www. cdc. noaa. gov http: //www. ncdc. noaa. gov http: //iridl. ldeo. columbia. edu/

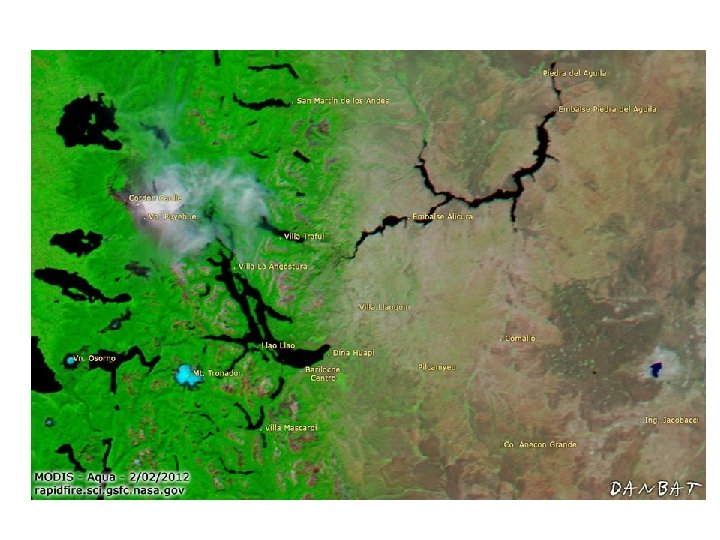
Vegetation Indices may help in areas of sharp precipitation gradient, low station density

Rudiman…

Fuentes de Información Climática del pasado reciente Estaciones Meteorológicas Desde 1900 Corales Desde 1980 Registros históricos Hasta 6000 años Anillos de árbol Hasta 1000 años

Fuentes de Información climática del pasado lejano Rocas y minerales Hasta 4. 000 Mill años Sedimentos de lagos Hasta 13. 000 años Testigos de Hielo Hasta 800. 000 años

Sedimentos Marinos Fósiles de vegetación pasada

Modelos además presentan problemas en climas pasados Termostato tropical? Múltiples equilibrios? GCMs (cambios CO 2 + geografía) Ruddiman: Earth’s Climate, Chapter 4

La aparente existencia de un termostato tropical y su falta de representación en GCMs es un problema… Sin embargo una buena culebra ayuda Head et al. Nature 2009

Head et al. Nature 2009
- Slides: 27