Singlecell sequencing analysis by cellspecific network Reveal Dark
 Key Laboratory")
Single-cell sequencing analysis by cell-specific network Reveal “Dark Gene” Luonan Chen (陈洛南) Key Laboratory of Systems Biology Chinese Academy of Science

Characterizing one cell One cell ✔ ✔ Gene expression Protein expression Metabolomics Methylation Multiple cells ✘ Network

Question ? Can we construct a network by a single cell ? YES Cell Specific Network (CSN)

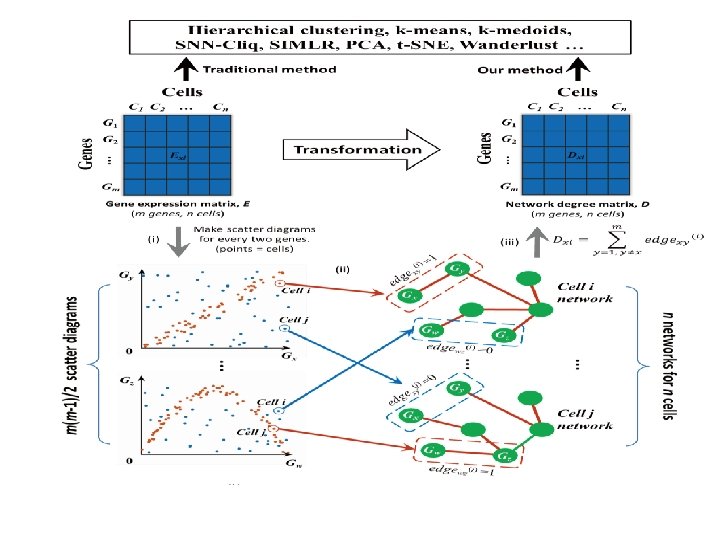
Traditional network construction Network construction requires multiple cells/samples Gene-pair correlation Cell-1 Cells s 1 s 2 s 3 s 4 s 5 Cell-2 g 1 Correlation Cell-3 … Genes g 2 gn Cell-4 Cell-5 s l l e c i t l u M Network

Dai et al. NAR 2019 Construct a network by a single cell data Cell-Specific Network method
 • Necessary and sufficient condition in")
Mutual independency of genes x , y (network) • Necessary and sufficient condition in a cell X Y
 unreliable data of single-cell data no association ρxy")
sparse neighbors ρxy<0 small p(x, y) unreliable data of single-cell data no association ρxy < 0 p(x, y) log p(x, y)/p(x)p(y) < 0 negative mutual-information contribution Statistic Gene y For cell-k yk n cells 0 xk Gene x X Y

H 0 hypothesis: independence of x , y Distribution of edge x-y • Normal distribution for n cells X Y Quantify gene-gene associations in a single cell Cell-Specific Network n=500 cells

Random Linear genes x and y independent genes x and y correlated in partial cells Nonlinear genes x and y correlated in partial cells genes x and y dependent
 is larger")
Red plots of genes x and y represent that the statistic ρxy(k) is larger than the significant level of 0. 01 and edgexy(k) = 1, which corresponds to the red area in the density function graphs
 (GEM) Different colors represent")
Our method network degree matrix and gene expression matrix (NDM) (GEM) Different colors represent different cell types.
 Kolod Chu- Chu. Pollen Zeisel Darmanis Kim Trapnell")
Comparison of adjusted random index (ARI) Kolod Chu- Chu. Pollen Zeisel Darmanis Kim Trapnell ziejczyk type time 0. 48 0. 49 0. 95 0. 55 0. 63 0. 75 0. 67 0. 66 0. 08 0. 82 0. 99 0. 96 0. 53 0. 91 0. 77 0. 72 0. 73 0. 24 0. 31 0. 53 0. 90 0. 39 0. 58 0. 73 0. 59 0. 60 0. 14 0. 74 0. 80 0. 87 0. 43 0. 77 0. 70 0. 83 0. 44 0. 32 0. 99 0. 94 0. 60 0. 67 0. 98 0. 66 0. 16 0. 97 1. 00 0. 85 0. 62 0. 86 0. 99 0. 68 1. 00 0. 43 0. 30 0. 99 0. 94 0. 62 0. 65 0. 98 0. 69 0. 72 0. 16 0. 94 1. 00 0. 85 0. 65 0. 85 0. 99 0. 69 1. 00 0. 47 0. 14 0. 03 0. 91 0. 43 0. 36 0. 60 0. 43 0. 57 0. 00 0. 31 0. 73 0. 89 0. 11 0. 23 0. 76 0. 41 0. 61 0. 23 0. 92 0. 99 0. 90 0. 56 0. 75 0. 74 0. 66 0. 97 0. 21 1. 00 0. 92 0. 67 0. 90 0. 75 0. 67 0. 95 0. 31 0. 00 0. 90 0. 50 0. 20 0. 64 0. 30 0. 58 0. 00 0. 50 0. 65 0. 90 0. 60 0. 01 0. 61 0. 36 0. 58 0. 24 Buettner GEM NDM GEM k-means NDM Hierarchical GEM (t. SNE) NDM k-means GEM (t. SNE) NDM GEM k-medoids NDM GEM SIMLR NDM GEM SNN-Cliq NDM Hierarchical

Single cell Bulk Network biomarker Dark Gene Network biomarker 网络标志物 Dark Gene Network biomarker (A) Correlation network of grouped cells and CSN of a single cell. (B) t-SNE plots of Chu-type dataset, where different cell types could be distinguished clearly (ARI = 0. 98). (C) Scatter diagrams of genes POU 5 F 1 and GATA 6, colored by the cell types listed in (B). (D) Performance of edge POU 5 F 1 - GATA 6 in the t-SNE plots. (E -J) Performance of genes FBXO 33 and ZHX 2 in the t-SNE plots, colored by (E) gene expression level of FBXO 33, (F) network degree level of FBXO 33, (G) FBXO 33 -KDR, (H) gene expression level of ZHX 2, (I) network degree level of ZHX 2, (J) normalized statistic of edge ZHX 2 -PECAM 1.

0 h 96 h 12 h 72 h 24 h 36 h Networks to produce definitive endoderm cells from human embryonic stem cells. The top 25 upregulated and 25 downregulated genes identified by Wave-Crest at 36 h. Each network is the average of all CSNs at the same time points. Chu-time dataset.
 Clustering performance (t-SNE) of Xin dataset based")
Cell type analysis Two sub-cell types (A) Clustering performance (t-SNE) of Xin dataset based on GEM and NDM. Different colors represent different cell types (pp cells, alpha cells, beta cells and delta cells). (B) Clustering performance of Xin dataset based on GEM and NDM. Different colors represent different cell sources (T 2 D and non-diabetic). (C) The expression levels of genes HSP 90 AB 2 P and PPY.

Single-sample network for bulk data Comparison of GEM and NDM based on TCGA adenocarcinoma and squamous cell carcinoma two subtypes (A) Clustering performance (t-SNE) between GEM and NDM. Different colors represent different cell types. (B) The expression level FPKM and network degree of gene SPRR 2 E. (C) Squamous cell carcinoma can be divided into two parts S 1 and S 2 based on NDM, and the survival analysis shows the significant difference between S 1 and S 2.

Dai et al. NAR 2019; Liu et al. NAR 2016; Yu et al. NAR 2017 Conclusion • Construct Cell Specific Network (CSN): one network for one cell • From “unstable” gene expression form to “stable” gene association form on a single-cell basis. sc. RNA-seq, sc. ATAC-seq, sc. Hi-C, sc. Methy + DNA-editing • Linear and nonlinear interactions • 单细胞基因调控网络图谱 “Dark” genes among non-differential genes Single-cell gene regulatory network atlas • Single-sample network for bulk RNA-seq data • Any existing methods can be applied

Dai et al. NAR 2019; Liu et al. NAR 2016; Yu et al. NAR 2017 Acknowledgement • Dai Hao, Lin Li, Xiangtian Yu, Tao Zeng, Chinese Academy of Sciences • Xiaoping Liu, Shandong University • Shiping Liu BGI

Markov-Chain Entropy 3. Quantify Waddington’s epigenetic landscape -single cell potency量化单细胞干性 Markov Chain
")
Quantifying cell potency High potency Low potency Conrad Hal Waddington (1905 -1975)

Shi et al. Briefs in Bioinformatics 2018; Shi et al. PLo. S Computational Biology 2019 Markov-Chain Entropy (MCE) (one cell) Edge Entropy (network flow entropy) single-cell potency 1. Whole entropy of information flow induced by Markov chain on a network 2. A measurement of heterogeneity of a network in terms of actual flow 3. For Theone more homogeneous of interactions the higher MCE is matrix cell, given gene expression π, wethe cannetwork solve theis, network P – its transition network Markov Chain stationary distribution

Landscape

Jiang et al. Bioinformatics 2018 ; Shi et al. Briefs in Bioinformatics 2018 Summary of RNA-Seq experiments
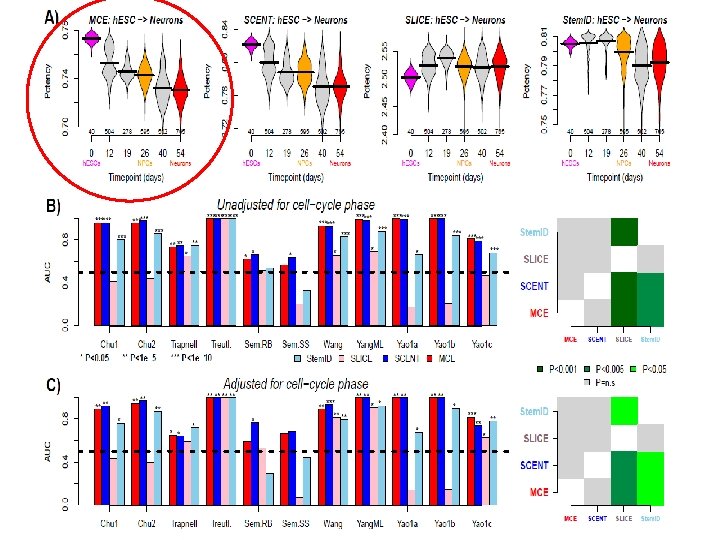

Integration with network information underpins the association of MCE with cell-potency

Ribosomal mitochondrial genes enriched for overexpressed network hubs

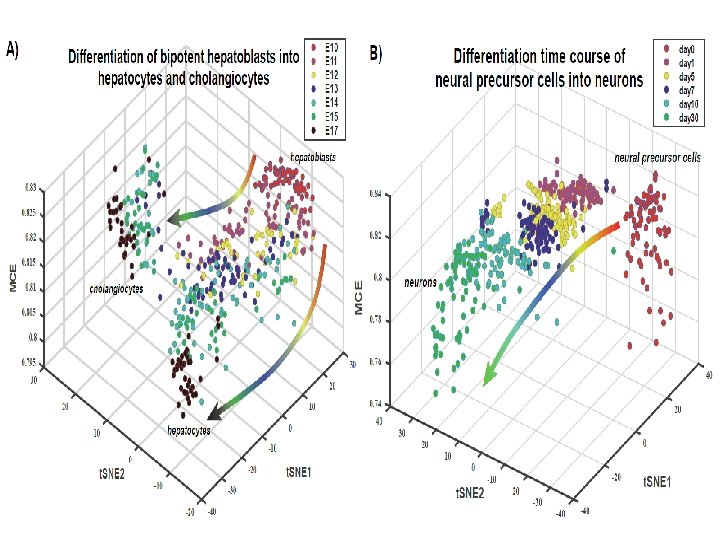
Jiang et al. Bioinformatics 2018; Shi et al. Briefs in Bioinformatics 2018; Shi et al. PLo. S CB 2019 Markov Chain Entropy (MCE) Edge Entropy • Quantify Waddington’s epigenetic landscape • Measure single-cell potency • Construct pseudo-time trajectory

Acknowledgments • Jifan Shi, Tiejun Li Peking University • Andrew E Teschendorff CAS Max-Planck Partner Institute for Computational Biology • Hao Jiang Renmin University Jiang et al. Bioinformatics 2018; Shi et al. Briefs in Bioinformatics 2018; Shi et al. PLo. S CB 2019
- Slides: 30