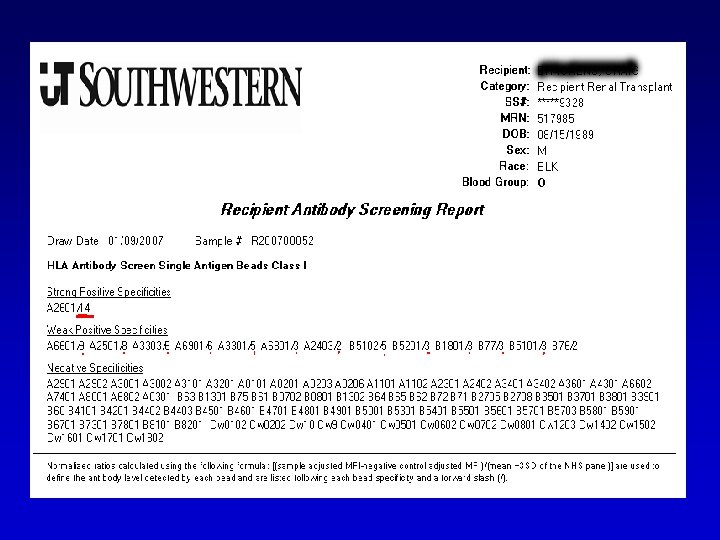
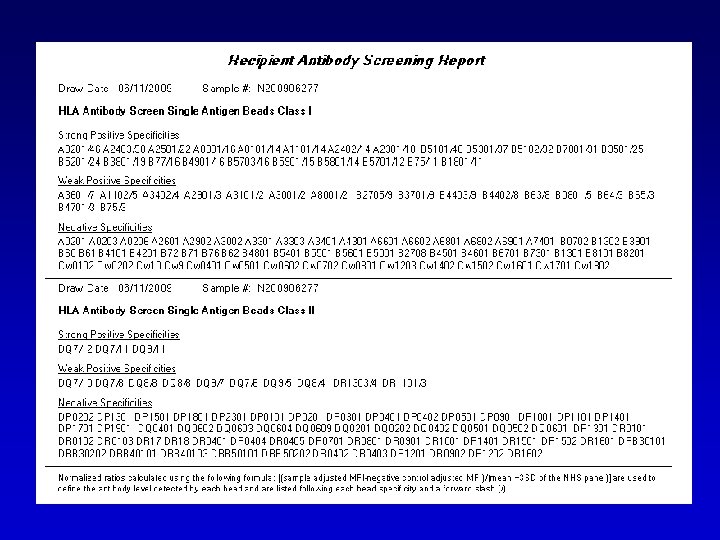
Single HLA Antigen Bead Data Interpretation Normalized Ratios

Single HLA Antigen Bead Data Interpretation: Normalized Ratios Peter Stastny Transplantation Immunology Division Departments of Internal Medicine and Pathology UT Southwestern Medical Center Dallas, Texas, USA

Determine a Cut-off for each of the Single Antigen Beads

NORMALIZED RATIOS • Normalized ratios are a method of expressing the results of SA assays developed at UT Southwestern. • Normalized ratios : [(Raw MFI x ag density corr. factor) - NC)]/NHS Mean+3 SD • Each bead has a different cutoff value. • NR of >2 x are considered positive. Above 10 x strong positive.

Antigen Density on the Beads

12000 0 A 3001 A 1102 B 1801 B 62 B 75 B 2708 A 3002 B 5001 B 5703 Cw 10 B 5301 B 3501 B 76 B 4901 B 2705 A 2403 B 6701 B 5801 A 3402 A 2501 B 4501 A 2901 B 5601 B 64 A 0301 B 8201 B 7301 B 63 B 7801 Cw 10 A 3401 A 3303 B 4701 B 0801 B 4201 A 2902 A 3201 B 0702 A 6801 A 0206 A 2402 A 6802 A 2301 A 6601 A 3101 Cw 9 A 0101 Cw 0801 A 6901 A 7401 B 4601 B 5701 A 2601 B 5101 A 6602 B 8101 Cw 1802 Cw 1601 B 60 A 4301 B 77 B 65 B 3901 B 4402 A 0201 B 3701 Cw 0102 A 3601 B 61 B 5401 B 1302 B 5501 Cw 0202 Cw 1402 B 71 B 72 Cw 1701 Cw 0501 B 4101 A 0203 B 3801 Cw 0702 Cw 1502 A 3301 B 5201 A 8001 B 4403 Cw 0602 B 4801 B 5901 B 5102 Cw 1203 Cw 0401 Bead MFI ANTIGEN DENSITY One Lambda SA 1 Group 4 Lot 001 Antigen Density 10000 8000 6000 4000 2000

ANTIGEN DENSITY

ANTIGEN DENSITY

Monoclonal antibodies used for antigen density correction • HLA Class I: w 6/32 • HLA Class II – HLA-DR: – HLA-DQ: – HLA-DP: L 243 SPVL 3 (Beckman) SPM 421 (Abcam)

The Reactions of Normal Human Sera

HLA Class I Beads

HLA Class II Beads

Mean plus 3 SD 99. 6 %

Variation in Ranges of Binding of Ig. G from Normal Human Sera to SA Class I Beads NHS Mean plus 3 SD MFI 2 X (Mean Plus 3 SD) Cut-off at 1000 MFI Cut-off at 500 MFI SA Beads HLA Class I

Variation in Ranges of Binding of Ig. G from Normal Human Sera to SA Class II Beads MFI NHS Mean plus 3 SD 2 X (Mean Plus 3 SD) SA Beads HLA Class II

NORMALIZED MFI • • No correction for antigen density. No individual cutoff based on NHS panel. Fix 1000 NMFI cutoff. Normalized MFI are obtained by subtracting negative ctrl from raw MFI.

METHOD • Analyze two consecutive sera from 30 patients using normalized ratios and fixed 1000 NMFI cutoff and compared the results.

NR vs NMFI: Number of positive beads 1039 Number of positive beads 875 + 18. 7% 588 + 15. 6%

Patients with additional specificities identified by normalized ratios Class II 30% 53% 47% 70% Additional specificies No additional specificies 21/30 patient with additional specificities 14/30 patient with additional specificities

Analysis of consecutive sera for the 21 discrepant patients for class I antibodies

Analysis of consecutive sera for the 14 discrepant patients for class II antibodies 10 9 64. 3% 57. 1% Number of patients 8 7 42. 8% 6 35. 7% 5 4 3 2 1 0 Normalized MFI Normalized ratio POS/POS 0 9 POS/NEG 0 5 NEG/NEG 8 0 NEG/POS 6 0

Antibodies detected as positive with normalized ratio but negative with normalized MFI can cause a positive crossmatch Negative ctrl Patient Positive ctrl Normalized DSA Ratio MFI A 0203 >2 x 478 A 0201 >2 x 413 Cw 0304 3 x 450 Negative ctrl Patient Positive ctrl MESF 2062 5738 35455 Delta MESF 3676 33393 Positive Cutoff: Delta MESF of 2250 T CELL FLOW CYTOMETRY XM

Antibodies detected as positive with normalized ratio but negative with normalized MFI can cause a positive crossmatch Negative ctrl Patient Positive ctrl DSA Cw 07 Normalized Ratio MFI 3 X 720. 5 Cw 07 is a regraft antigen. Negative ctrl Patient Positive ctrl MESF 1022 5430 70013 Delta MESF 4408 68991 Positive Cutoff: Delta MESF of 2169 B CELL FLOW CYTOMETRY XM

CONCLUSIONS • Normalized ratios generally identified more weak positive specificities than normalized MFI. • Normalized ratios yielded more reproducible results when comparing sequential serum samples than normalized MFI. • Normalized ratios has a different cutoff for each bead. • Specificities that were identified with normalized ratios but not with normalized MFI could yield a positive crossmatch. • Methods used to analyze SA tests can impact the antibody specificities identified.

An early batch from Source A Class I Beads sorted by MFI

Trimmed Mean Fluorescence Antigen Density with W 6/32 Source B Class I Beads sorted by MFI SA Beads for HLA Class I

Antigen Density with W 6/32 A more recent batch from Source A
 • Weak positive: 2 X to 10 X")
Normalized Ratios • MFI/(Mean +3 SD) • Weak positive: 2 X to 10 X • Strong positive: greater than 10 X

Analysis of Results obtained with Single Antigen Beads • Antigen density correction Monoclonal antibodies for HLA class I and class II antigens • Ig binding from normal sera Mean + 3 SD • Normalized ratios MFI/(Mean +3 SD for each bead)

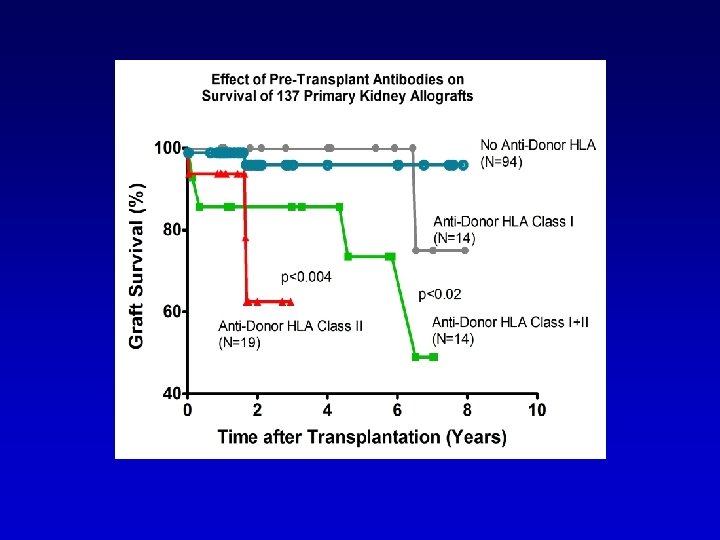
Ig. G Antibodies against Donor HLA Antigens

Primary Kidney Allografts Effect of DSA detected with SA beads when T-cell flow-cytometry crossmatch was negative.

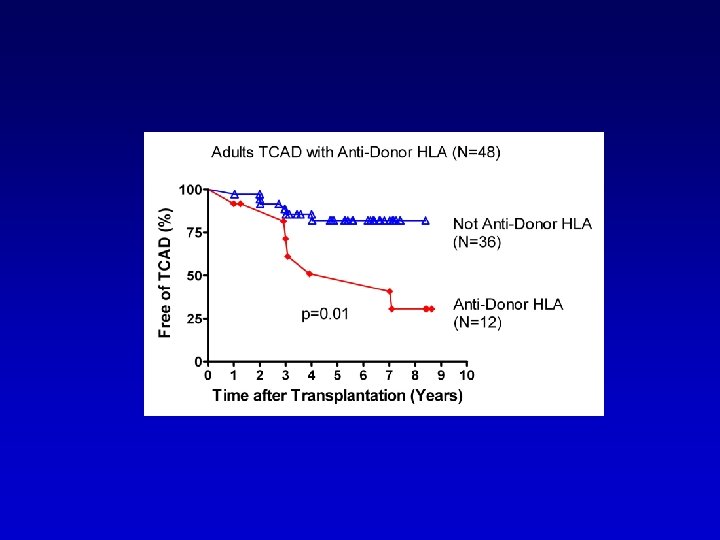
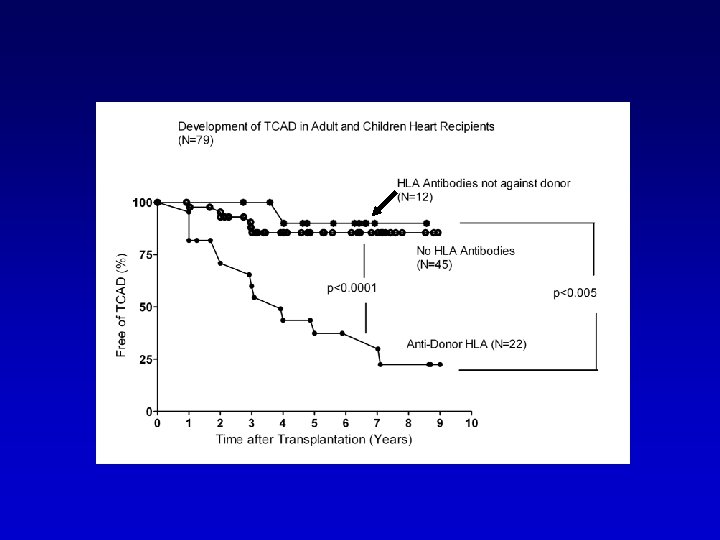
Heart Transplants Association of anti-donor HLA antibodies with transplant-related coronary artery disease.

Donor-Specific Antibodies Effect of antibodies against HLA antigens not present in the graft

Antibodies against HLA antigens not expressed in the graft did not harm the heart transplant in 5 ½ years From: Stastny et al, Antibodies against donor HLA and the outcome of cardiac allografts in adults and children, Transplantation 84: 738, 2007.
- Slides: 38