
Single Cell RNASeq Data Analysis Ion Mandoiu Computer




- Slides: 41
Single Cell RNA-Seq Data Analysis Ion Mandoiu Computer Science & Engineering Department ion@engr. uconn. edu
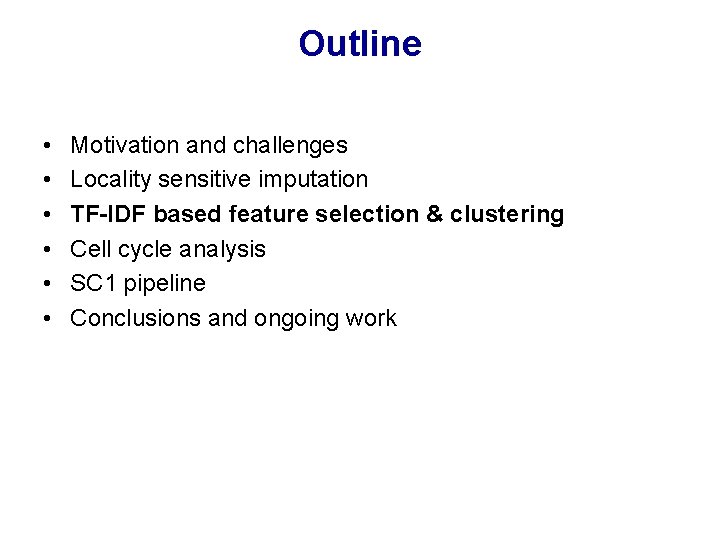
Outline • • • Motivation and challenges Locality sensitive imputation TF-IDF based feature selection& clustering Cell cycle analysis SC 1 pipeline Conclusions and ongoing work
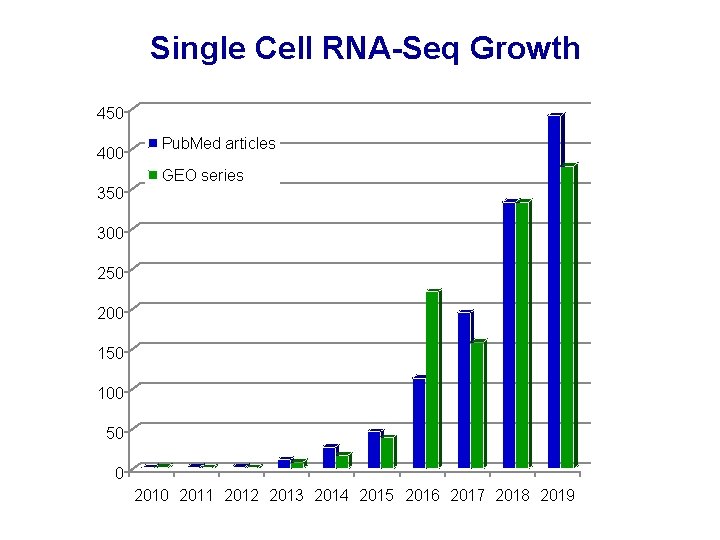
Single Cell RNA-Seq Growth 450 400 350 Pub. Med articles GEO series 300 250 200 150 100 50 0 2011 2012 2013 2014 2015 2016 2017 2018 2019
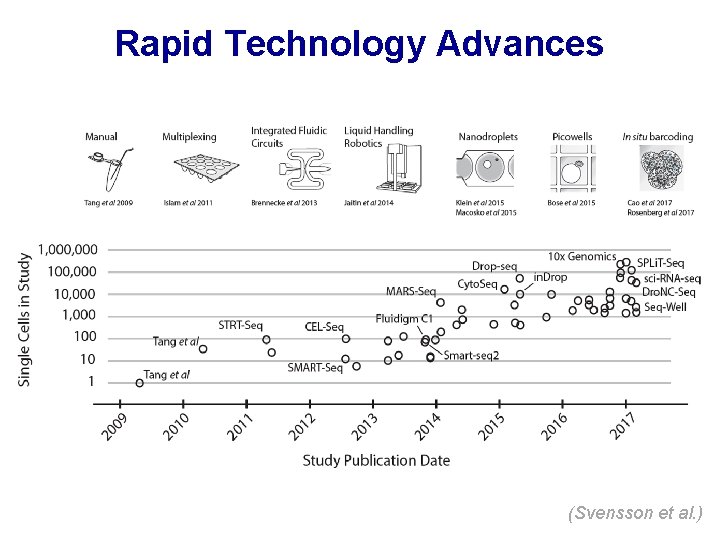
Rapid Technology Advances (Svensson et al. )
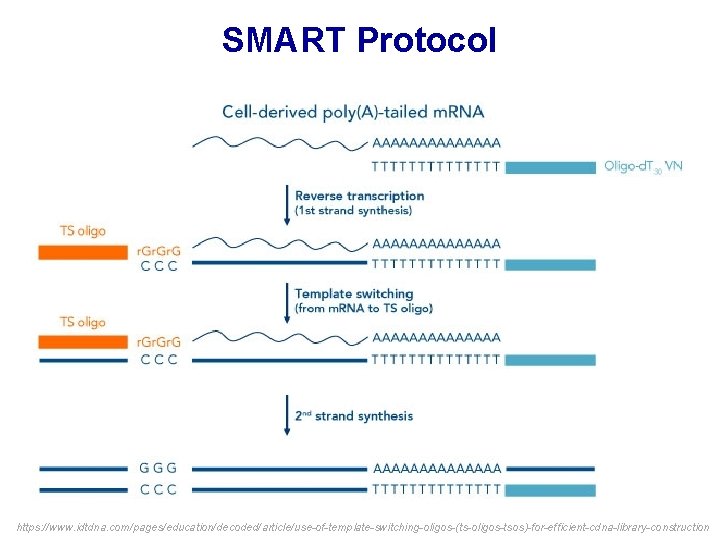
SMART Protocol https: //www. idtdna. com/pages/education/decoded/article/use-of-template-switching-oligos-(ts-oligos-tsos)-for-efficient-cdna-library-construction
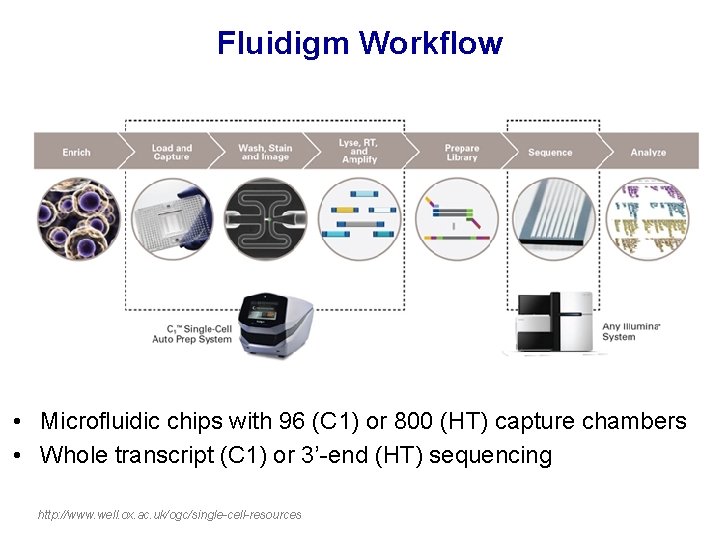
Fluidigm Workflow • Microfluidic chips with 96 (C 1) or 800 (HT) capture chambers • Whole transcript (C 1) or 3’-end (HT) sequencing http: //www. well. ox. ac. uk/ogc/single-cell-resources
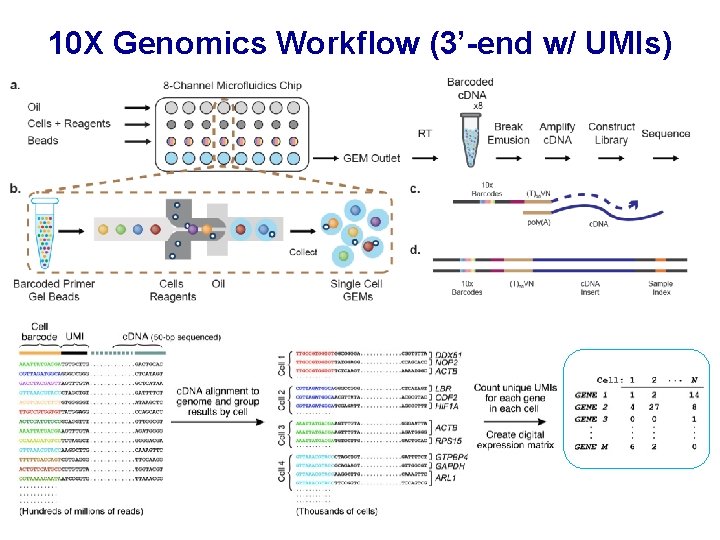
10 X Genomics Workflow (3’-end w/ UMIs)
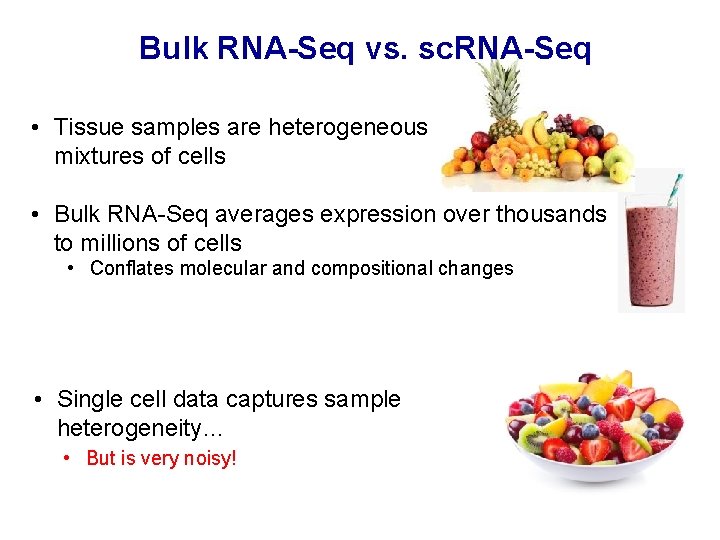
Bulk RNA-Seq vs. sc. RNA-Seq • Tissue samples are heterogeneous mixtures of cells • Bulk RNA-Seq averages expression over thousands to millions of cells • Conflates molecular and compositional changes • Single cell data captures sample heterogeneity… • But is very noisy!
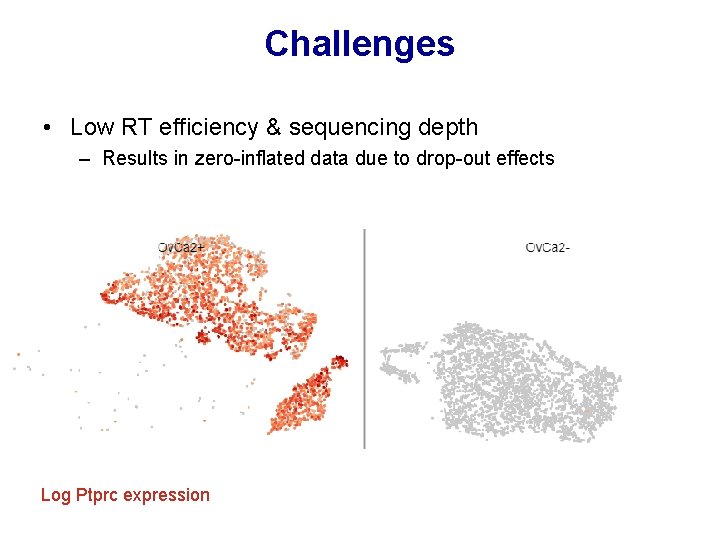
Challenges • Low RT efficiency & sequencing depth – Results in zero-inflated data due to drop-out effects Log Ptprc expression
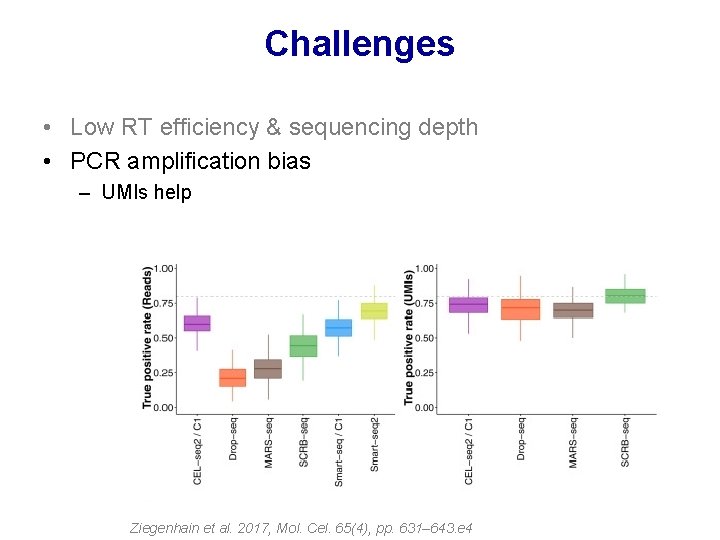
Challenges • Low RT efficiency & sequencing depth • PCR amplification bias – UMIs help Ziegenhain et al. 2017, Mol. Cel. 65(4), pp. 631– 643. e 4
Challenges • Low RT efficiency & sequencing depth • PCR amplification bias • Cell quality – – – Live/dead Stress response Contaminant m. RNA Empty droplets Multiple cells
Challenges • • Low RT efficiency & sequencing depth PCR amplification bias Cell quality Stochastic effects – Cells captured in different cell cycle phases – Transcriptional bursting hard to distinguish from technical artifacts
Challenges • • • Low RT efficiency & sequencing depth PCR amplification bias Cell quality Stochastic effects Cell capture bias – Capture rates may not be representative of population frequencies
Challenges • • • Low RT efficiency & sequencing depth PCR amplification bias Cell quality Stochastic effects Cell capture bias Analysis tools lagging behind – Protocols still evolving rapidly – Many analysis methods do not scale well with #cells
Outline • • • Motivation and challenges Locality sensitive imputation TF-IDF based feature selection & clustering Cell cycle analysis SC 1 pipeline Ongoing work
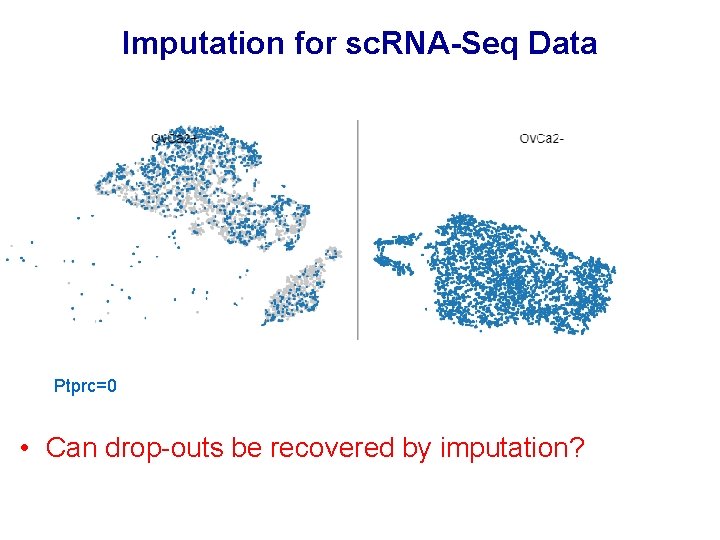
Imputation for sc. RNA-Seq Data Ptprc=0 • Can drop-outs be recovered by imputation?
Existing Imputation Methods • • BISCUIT (Azizi et al. , GCB 2017) CIDR (Lin, Troup, & Ho, Genome Biol. 2017) DRImpute (Kwak et al. , bio. Rxiv 2017) LSImpute (Moussa & Mandoiu, ISBRA 2018) MAGIC (van Dijk et al. bio. Rxiv. 2017) net. Smooth (Ronen & Akalin, F 1000 Res. 2018) sc. Impute (Li & Li, Nat. Comm. 2018) …
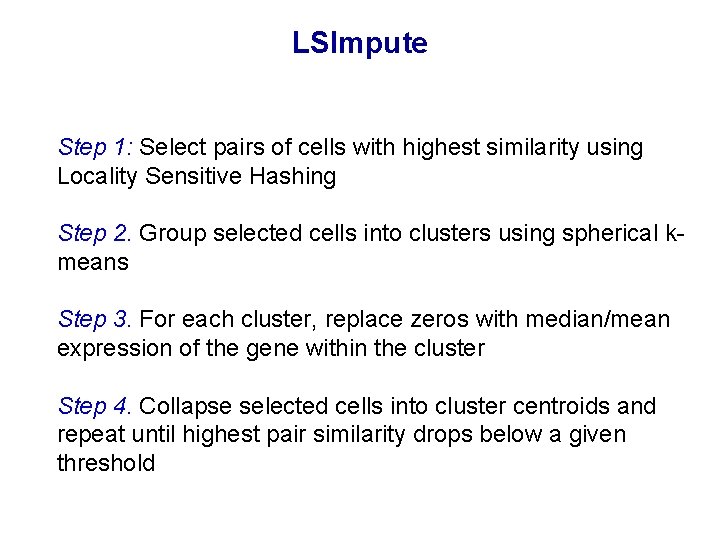
LSImpute Step 1: Select pairs of cells with highest similarity using Locality Sensitive Hashing Step 2. Group selected cells into clusters using spherical kmeans Step 3. For each cluster, replace zeros with median/mean expression of the gene within the cluster Step 4. Collapse selected cells into cluster centroids and repeat until highest pair similarity drops below a given threshold
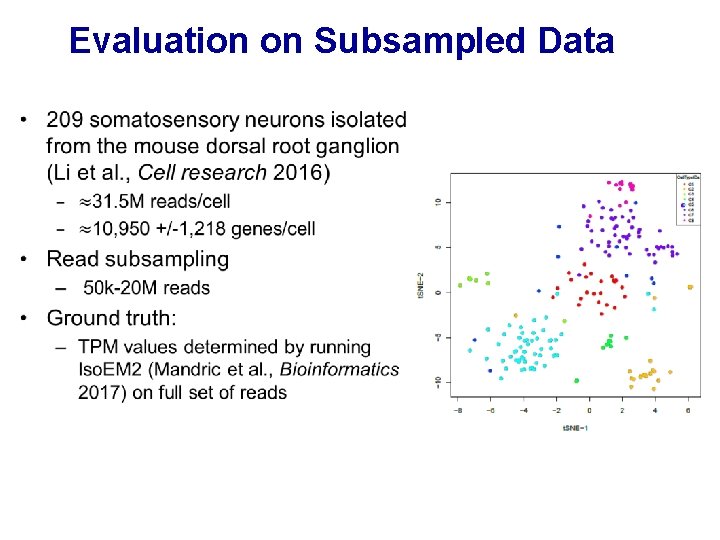
Evaluation on Subsampled Data •
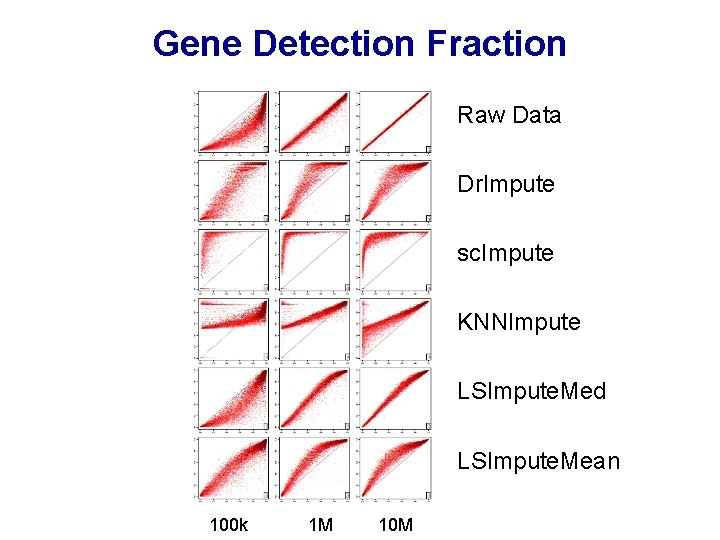
Gene Detection Fraction Raw Data Dr. Impute sc. Impute KNNImpute LSImpute. Med LSImpute. Mean 100 k 1 M 10 M
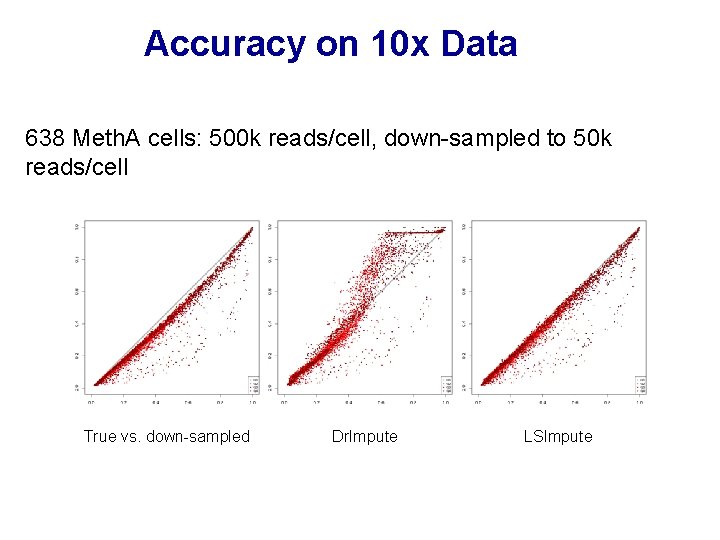
Accuracy on 10 x Data 638 Meth. A cells: 500 k reads/cell, down-sampled to 50 k reads/cell True vs. down-sampled Dr. Impute LSImpute
Outline • • • Motivation and challenges Locality sensitive imputation TF-IDF based feature selection & clustering Cell cycle analysis SC 1 pipeline Conclusions and ongoing work
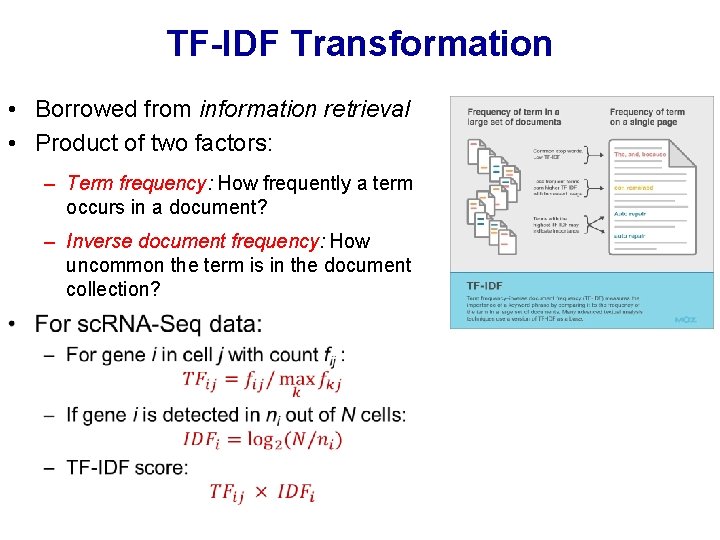
TF-IDF Transformation • Borrowed from information retrieval • Product of two factors: – Term frequency: How frequently a term occurs in a document? – Inverse document frequency: How uncommon the term is in the document collection?
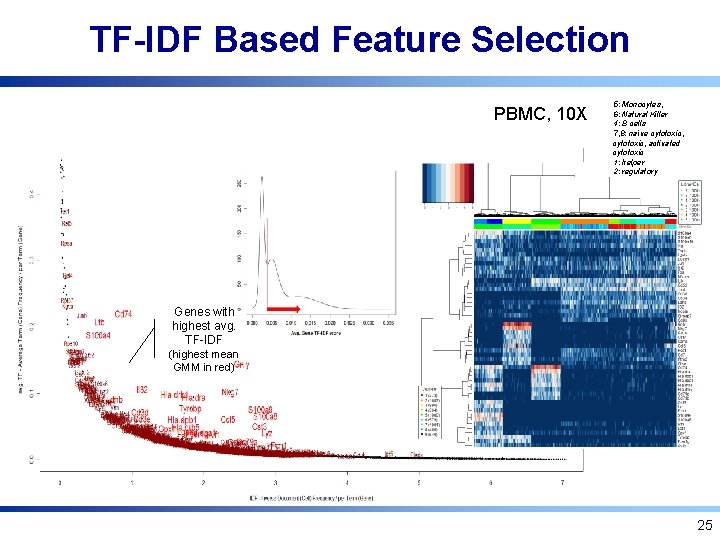
TF-IDF Based Feature Selection PBMC, 10 X 5: Monocytes, 6: Natural Killer 4: B cells 7, 8: naïve cytotoxic, activated cytotoxic 1: helper 2: regulatory Genes with highest avg. TF-IDF (highest mean GMM in red) 25
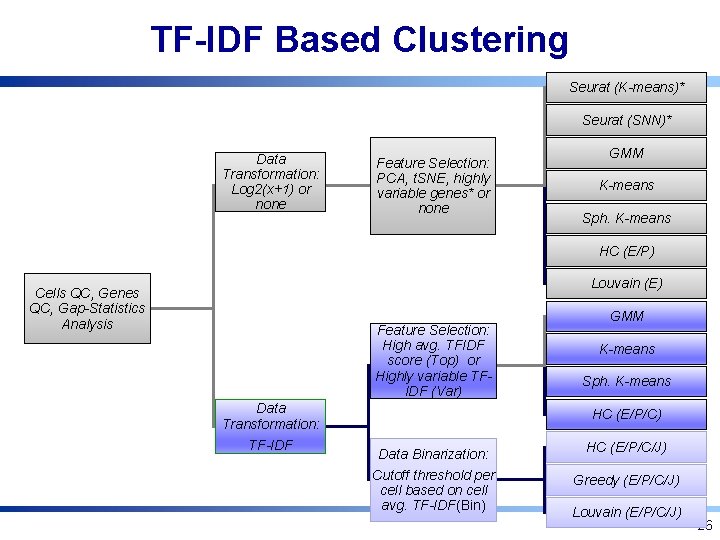
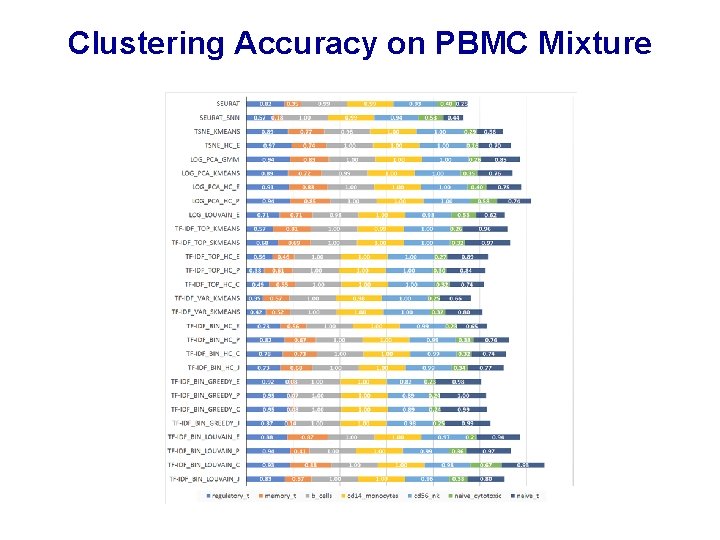
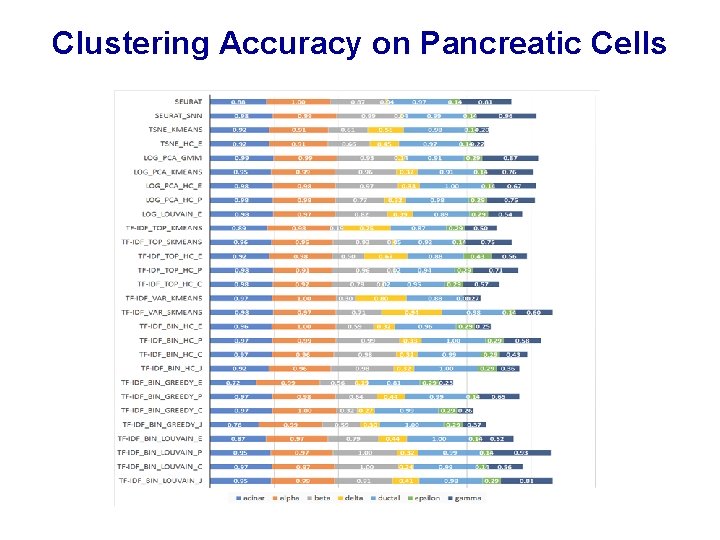
TF-IDF Based Clustering Seurat (K-means)* Seurat (SNN)* Data Transformation: Log 2(x+1) or none Feature Selection: PCA, t. SNE, highly variable genes* or none GMM K-means Sph. K-means HC (E/P) Louvain (E) Cells QC, Genes QC, Gap-Statistics Analysis Feature Selection: High avg. TFIDF score (Top) or Highly variable TFIDF (Var) Data Transformation: TF-IDF GMM K-means Sph. K-means HC (E/P/C) Data Binarization: Cutoff threshold per cell based on cell avg. TF-IDF(Bin) HC (E/P/C/J) Greedy (E/P/C/J) Louvain (E/P/C/J) 26
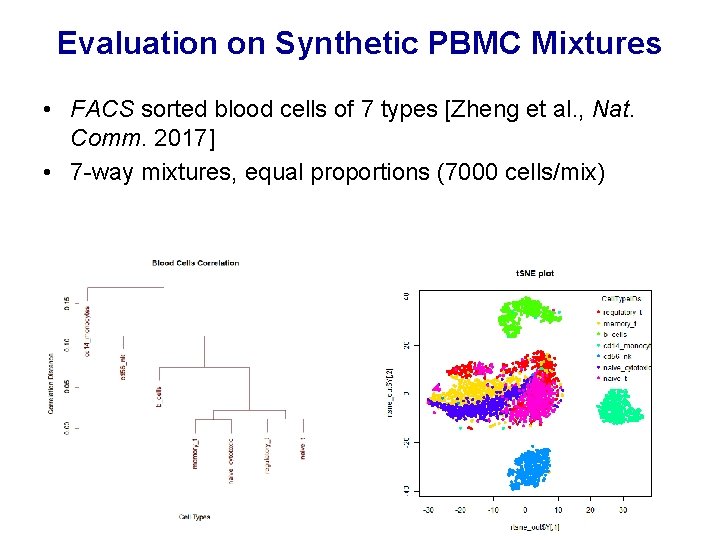
Evaluation on Synthetic PBMC Mixtures • FACS sorted blood cells of 7 types [Zheng et al. , Nat. Comm. 2017] • 7 -way mixtures, equal proportions (7000 cells/mix)
Clustering Accuracy on PBMC Mixture
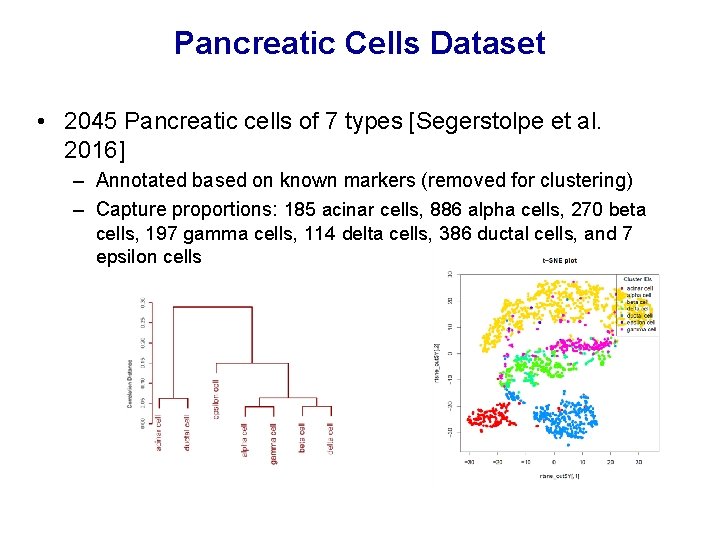
Pancreatic Cells Dataset • 2045 Pancreatic cells of 7 types [Segerstolpe et al. 2016] – Annotated based on known markers (removed for clustering) – Capture proportions: 185 acinar cells, 886 alpha cells, 270 beta cells, 197 gamma cells, 114 delta cells, 386 ductal cells, and 7 epsilon cells
Clustering Accuracy on Pancreatic Cells
Outline • • • Motivation and challenges Locality sensitive imputation TF-IDF based feature selection & clustering Cell cycle analysis SC 1 pipeline Conclusions and ongoing work
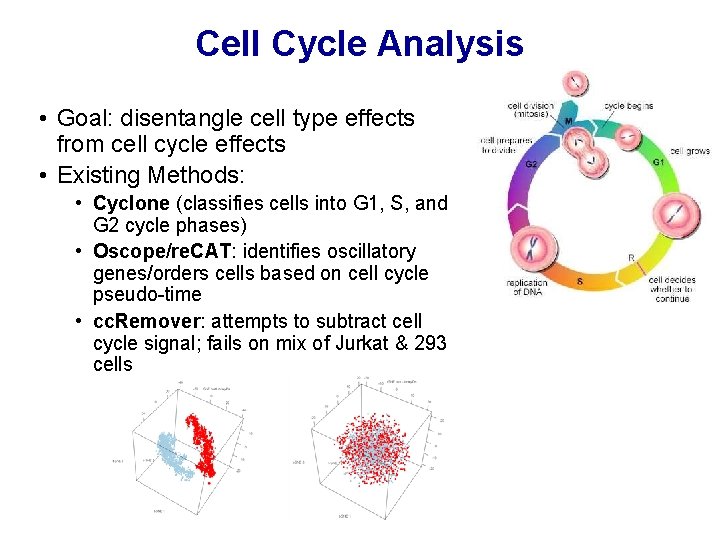
Cell Cycle Analysis • Goal: disentangle cell type effects from cell cycle effects • Existing Methods: • Cyclone (classifies cells into G 1, S, and G 2 cycle phases) • Oscope/re. CAT: identifies oscillatory genes/orders cells based on cell cycle pseudo-time • cc. Remover: attempts to subtract cell cycle signal; fails on mix of Jurkat & 293 cells
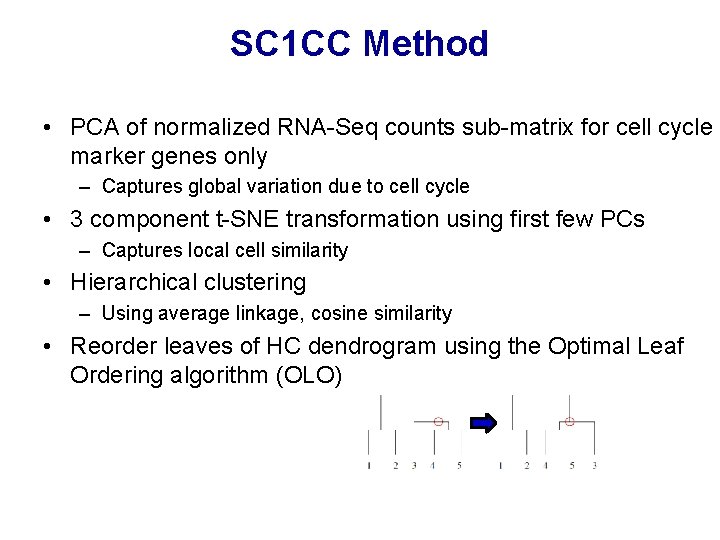
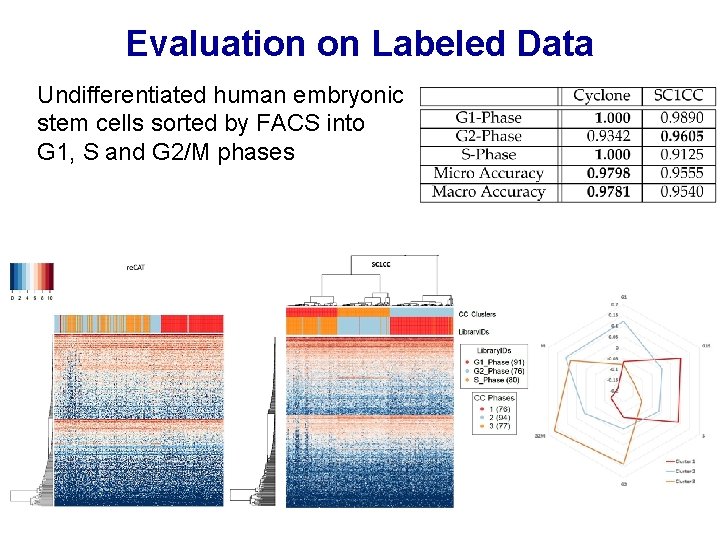
SC 1 CC Method • PCA of normalized RNA-Seq counts sub-matrix for cell cycle marker genes only – Captures global variation due to cell cycle • 3 component t-SNE transformation using first few PCs – Captures local cell similarity • Hierarchical clustering – Using average linkage, cosine similarity • Reorder leaves of HC dendrogram using the Optimal Leaf Ordering algorithm (OLO)
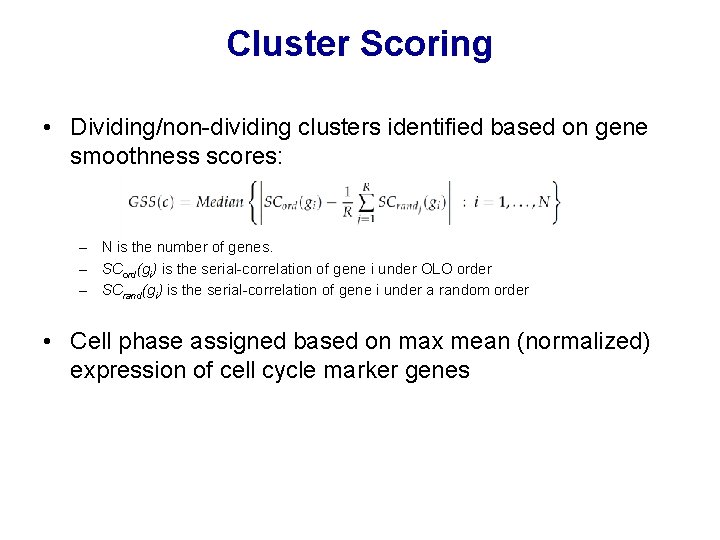
Cluster Scoring • Dividing/non-dividing clusters identified based on gene smoothness scores: – N is the number of genes. – SCord(gi) is the serial-correlation of gene i under OLO order – SCrand(gi) is the serial-correlation of gene i under a random order • Cell phase assigned based on max mean (normalized) expression of cell cycle marker genes
Evaluation on Labeled Data Undifferentiated human embryonic stem cells sorted by FACS into G 1, S and G 2/M phases
Outline • • • Motivation and challenges Locality sensitive imputation TF-IDF based feature selection & clustering Cell cycle analysis SC 1 pipeline Conclusions and ongoing work
SC 1 Analysis Workflow https: //sc 1. engr. uconn. edu
Outline • • • Motivation and challenges Locality sensitive imputation TF-IDF based feature selection & clustering Cell cycle analysis SC 1 pipeline Conclusions and ongoing work
Conclusions • The range of single-cell applications continues to expand rapidly, fueled by rapid advances in technology – Analysis tools lagging behind • Our contributions – – Scalable imputation method based on LSH TF-IDF based gene selection and clustering Robust methods for cell cycle analysis Web-based workflow for sc. RNA-Seq analysis and interactive visualization
Ongoing Work • Additional pipeline components in progress – – – – Correction for m. RNA contamination Batch effect removal Lineage inference RNA velocity Cell type matching Integration of sc. TCR-Seq, sc. ATAC-Seq, … …
Acknowledgments Marmar Moussa
Questions?