Since last midterm 1 the decibel scale 2

Since last midterm: 1. the decibel scale 2. resonances 3. normal vibration modes (standing waves) • strings • tubes 3. human hearing
 Intensity (I) ~ (pressure difference)2 W/m")
The decibel scale (a way of measuring loudness) Intensity (I) ~ (pressure difference)2 W/m 2 = J/m 2 s minimum audible sound

The only problem are the … Logarithms Powers of 10

log ab = log a + log b log 1/a = -log a

NO CALCULATORS DURING THE MIDTERM

The point of using the decibel scale is the Weber-Fetchner “Law” A doubling of volume feels like the same increase, regardless of how much increase in intensity actually occurred.

Thresholds for hearing and pain

i c h Environmental Noise Weakest sound heard 0 d. B s Normal conversation (3 -5') u 60 -70 d. B s Normal piano 60 -70 d. B t Telephone dial tone 80 d. B a i City Traffic (inside car) 85 d. B n Walkman on 5/10 94 d. B e Subway train at 200‘ 95 d. B d Level at which sustained exposure may result in hearing e 9 loss 90 - 95 d. B x 0 p Power mower 107 d. B o Symphonic music peak 120 -137 d. B s Pain begins 125 d. B u 9 r Jet engine at 100‘ 140 d. B 5 e d Rock concert peak 150 d. B B m Death of hearing tissue 180 d. B a

Normal modes of vibration, standing waves If you bang on an object, it will vibrate in a complicated way. But this complicated motion is a superposition of NORMAL MODES (just like a complicated sound can be decomposed into simple sine waves).
 fundamental 3 rd harmonic 2 nd harmonic 4")
Normal modes of strings (standing waves) fundamental 3 rd harmonic 2 nd harmonic 4 th harmonic Animation courtesy of Dr. Dan Russell, Kettering University

Standing waves are a superposition of two counter moving waves Animation courtesy of Dr. Dan Russell, Kettering University

Frequencies of standing modes of a string L l 1 =2 L f 1 = v/l 1 = v/(2 L) l 2 = L f 2 = v/l 2 = v/L=2 f 1 …

How the velocity depends on the string: Mersenne’s laws length fundamental frequency tension mass per length

Other objects have their normal modes too: Square membrane:

Circular membrane:

Bottle of beer:

Standing sound waves in air tubes This is not a string now, it’s the graph of the pressure x distance

air tubes x strings vstring nodes at the ends vsound nodes or antinodes at the ends

closed end pressure displacement open end

l/4

Voice

Anatomy
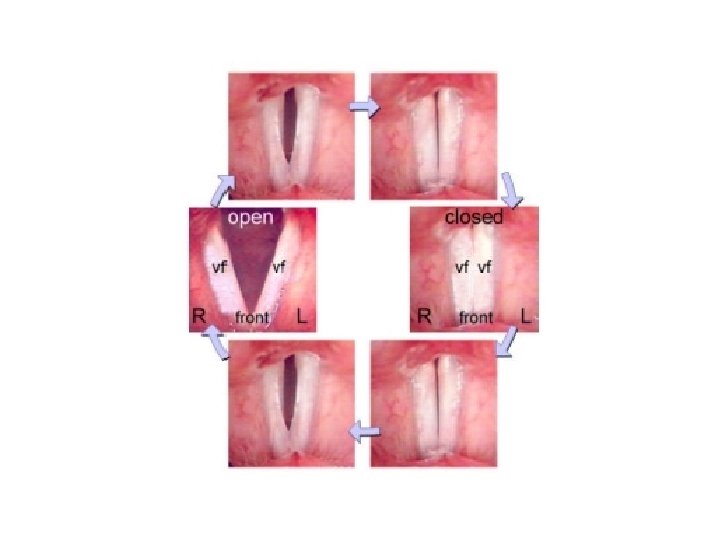

The sound wave produces by the vocal chords contains many frequencies that may or may not be enhanced by the resonances (formants) of the vocal tract 6 d. B/octave

Formants stay fixed as pitch changes
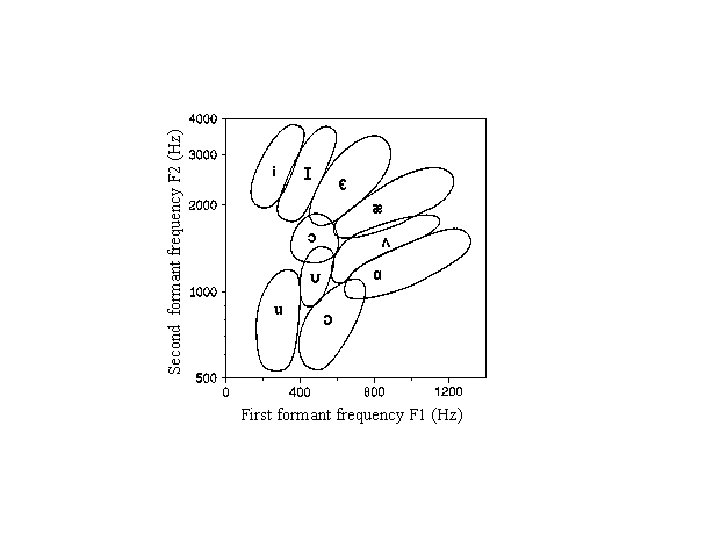

1. vocal chords vibrate with a given frequency 2. formants enhance some of the overtones (harmonics) 3. different formats = different vowels 4. consonants are formed with non-steady changes in lips, tongue, …

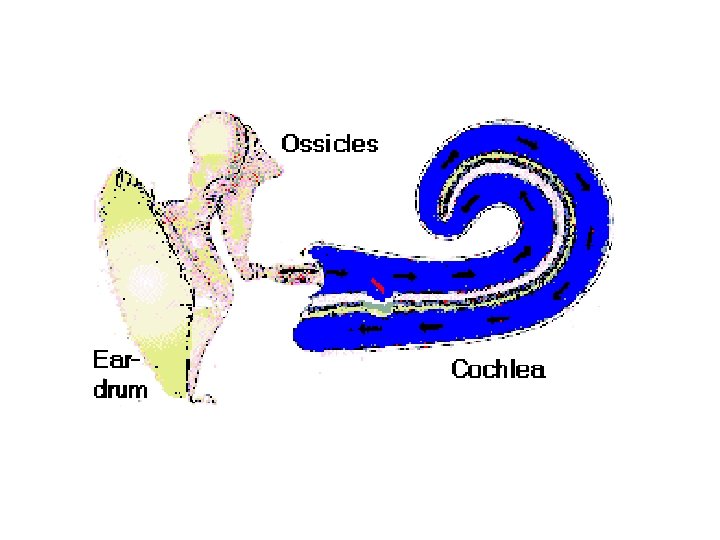
1. Physiology Hearing 2. Place Theory 3. Psychophysics of hearing • Fundamental tracking • Aural harmonics • Sheppard tones and pitch perception 4. Sound localization • interaural level difference • interaural time difference • head-transfer function

3. 2 mm 2 55 mm 2
 stiffer http: //www. howstuffworks. com/hearing 1. htm limber")
Uncoiled cochlea (schematic) stiffer http: //www. howstuffworks. com/hearing 1. htm limber

Cross section of cochlea
 3. 5 mm “same” interval corresponds")
Two frequencies f and 2 f (one octave) 3. 5 mm “same” interval corresponds to the same frequency ratio (fixed distance along the cochlea)

excited hair cells distance along the basilar membrane sharpening The amount of sharpening determined the just noticeable difference in frequencies

frequency up and down by 0. 001 = 0. 1% frequency up and down by 0. 005 = 0. 5%

Fundamental tracking: the absence of the fundamental does not change the perceived pitch note D minus fundamental and 2 nd harmonic
+ 0. 2 sin(2 p 100 t) +0. 1")
Aural harmonics sin(2 p 50 t)+ 0. 2 sin(2 p 100 t) +0. 1 sin(2 p 150 t) +… extra frequencies “aural harmonics” 400 Hz, 400 Hz+802 Hz, 400 Hz+1202 Hz

Shepard tones

Sound localization How do we know where the sound is coming from ? • interaural level differences (ILD) • interaural time differences (ITD) • head-related transfer function (HRTF) http: //www. aip. org/pt/nov 99/locsound. html

Interaural level difference: one ear will be on the shadow cast by the head we can detect even 0. 5 d. B in ILD diffraction makes it ineffective at low frequencies

Interaural time difference: peaks and through will arrive at ears at different times t ~ L/v ~ (0. 15 m)/(340 m/s) ~ 0. 0005 s difference in arrival time distance between ears much shorter than synaptic delays !

Phase ambiguity: l/2=10 cm, f=340 m/s /0. 2 m = 1700 Hz distance between ears

300 Hz: 2000 Hz:

Head-related transfer function: includes the reflection, refraction and diffraction from ears, chest, head, …
- Slides: 44