Simulation of Short Circuit Flow Paths and Transient


 program")
 program NAWQA topical study: Transport of Anthropogenic")
 program TANC goal: determine controls on movement")


 61 rows 122 columns Age & CFC")


 (unconfined wells only)")
")


- Slides: 33
Simulation of Short Circuit Flow Paths and Transient Conditions to Understand Vulnerability of Public Supply Wells to Contamination in the High Plains Aquifer, York, Nebraska Brian Clark Matt Landon Leon Kauffman George Hornberger 4/12/2005
Take-Home Messages • Wellbores drilled through confining units can act as “short circuits” • Transient stresses provide opportunities for pulses of flow • Combination of transient stresses and wellbores through confining units can allow contaminants to lower layers
Study Background USGS National Water-Quality Assessment (NAWQA) program
Study Background USGS National Water-Quality Assessment (NAWQA) program NAWQA topical study: Transport of Anthropogenic and Natural Contaminants (TANC) to public supply wells
Study Background USGS National Water-Quality Assessment (NAWQA) program TANC goal: determine controls on movement of contaminants to public supply wells
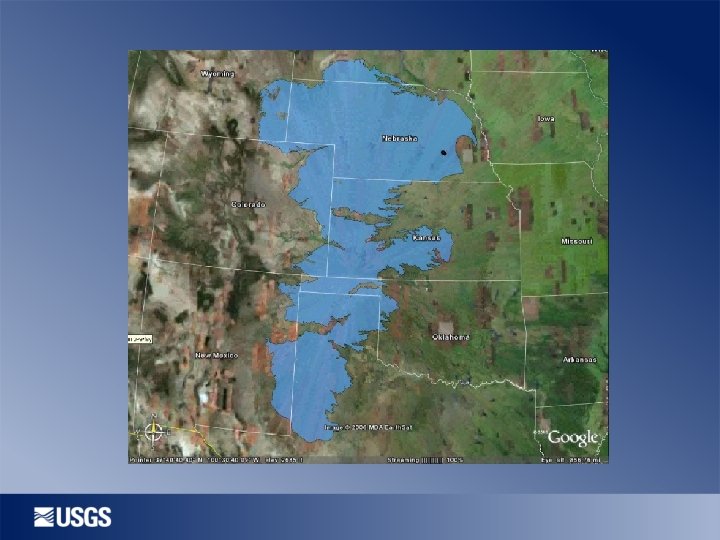
Study area
Study area !. RCRA, LST, NPDES !. Water / wastewater !. Landfill / livestock !. Superfund Potential contaminant sources
Study area Recharge zones
Study area Recharge zones Multi-node pumping wells
Study area FP 5 FP 4 FP 3 FP 1 Recharge zones Observation wells
Study area FP 5 FP 4 FP 3 FP 1 Recharge zones Transect
Hydrogeology unconfined sand upper confined sand Well screens Electrical Resistivity logs
Confined and unconfined water-levels Date • many wells are commonly screened in unconfined and confined layers
Model discretization unconfined sand upper confined sand
Model discretization
Model discretization Specific yield 0. 2 to 0. 25 HK values 0. 3 15 upper confined-4 Specific -7 1 x 10 7 x 10 Storage sand Fine coarse m/d per meter
Transient stresses • Simulation time – Sept 1944 to Sept 2004 • Seasonal stress periods – Irrigation pumpage off during winter
Transient stresses • Multi-node wells allow flow through wellbores Halford, K. J. and Hanson, R. T. , 2002
Hydrograph comparison unconfined Simulated Observed
Hydrograph comparison confined Simulated Observed
Hydrograph comparison confined Simulated Observed
Hydrograph comparison confined Simulated Observed
Hydrograph comparison unconfined Simulated Observed
Hydrograph comparison unconfined Simulated Observed
Residual Statistics YEAR MEAN MIN MAX RMS MEAN ABS COUNT 1964 0. 08 -2. 33 1. 54 1. 47 1. 20 6 1974 -0. 07 -2. 88 1. 42 1. 29 0. 95 9 1984 0. 10 -2. 18 2. 53 1. 42 1. 00 10 1994 0. 15 -2. 60 1. 75 1. 31 1. 07 12 2004 -0. 26 -3. 12 2. 97 1. 13 0. 76 43 all units in meters Residuals = observed minus simulated
Transport model sub-grid 13 layers (2 -14) 61 rows 122 columns Age & CFC boundary by layer Version of GWT to support MNW observation wells
Simulated age animation Age, in years 100 90 80 70 60 50 40 30 20 10 0 Cross-sectional view
Simulated age animation Age, in years 100 90 80 70 60 50 40 30 20 10 0 Map view cutaway
Age of water vs depth below water table (measured= tritium-helium ages) (unconfined wells only)
CFC concentration vs depth below water table (confined wells only)
Conclusions • Wellbores drilled through confining units act as “short circuits” for flow • Simulated transient stresses provide pulses of flow • Transient stresses and wellbores through confining units allow flow and contamination to lower layers
Contact information Brian Clark - brclark@usgs. gov Matt Landon – landon@usgs. gov Leon Kauffman – lkauff@usgs. gov George Hornberger – gzhornbe@usgs. gov 4/12/2005