SIMULATION OF GROUNDWATER FLOW IN THE ERIN AQUIFER


 definition, parameters, geometry, gw level, etc… For a:")


")

 Semiconfined layers FC-124: sandy layer (190 m thickness) FC-200: sandy layer")


 Specific yield 2. 05 E-5 0. 18 Layer 2 1. E-9")


- Slides: 29
SIMULATION OF GROUNDWATER FLOW IN THE ERIN AQUIFER Objective: conceptual model definition and steady state simulation of groundwater flow
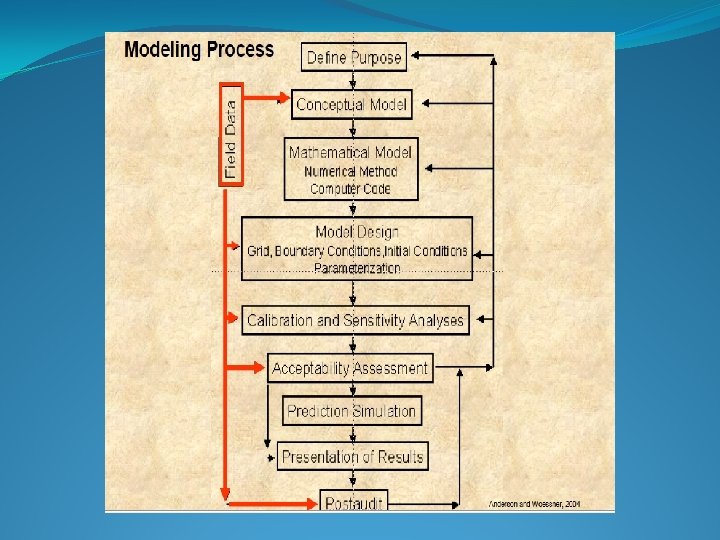
Coastal Aquifer Management in the Caribbean-II Groundwater modelling Purpose of modelling!!!!
Coastal Aquifer Management in the Caribbean-II Conceptual model: a numerical model may constitute a good ‘real system’ representation if it is based in a solid conceptual model (built with available data and scientific knowledge) Physical aspects -Aquifer type : water table, confined, multilayer…. . -Porous/fracutered media -flow regime: steady-state, transient. -Geometry -Boundary conditions: impervious, flow… -Change of properties: homogeneous, … Actions -Natural: recharge, discharge -Artificial: pumping. Relevant processes -Flow: recharge, discharge -transport: pumping. Data provided by a classical hydrogeologic study (site specific) Numerical model structure (code selection)
Coastal Aquifer Management in the Caribbean-II Spatial discretisation of domain Network definition Parameters: K, S Geology, recharge Pumping wells
Coastal Aquifer Management in the Caribbean-II Time discretisation Dimension: 1 D, 2 D, 3 D Pumping, Climate, River stages, lateral inflows, etc
Outputs Piezometric level
ERIN AQUIFER- conceptual model Purpose: Aquifer(s) definition, parameters, geometry, gw level, etc… For a: GW flow numerical model definition (Visual MODFLOW 2009. 1 Pro)
AQUIFER: Geometry Aquifer geometry and hydrostratigraphic units characteristion is obtained through: -geological methods (geologic logs) -geochemical methods (hydrochemistry) -geophysical methods (resistivity, logs…) - field surveys
AQUIFER: Geometry
AQUIFER: Geometry (II)
AQUIFER: Hydrostratigraphic aquifer Units
-D: detritic (unconfined) Semiconfined layers FC-124: sandy layer (190 m thickness) FC-200: sandy layer (135 m thickness) (hydraulically connected by the existing faults, lateral facies changes and also at the NE of the study area) Parameters Quatitative hydraulic parameters have not been obtained. (No pumping tests available). Average estimates of Hydraulic conductivity(K) for the Erin Sands range from 0. 5 – 12 m/day (ETI)
Piezometric level Water level observations and production wells abstraction data are integrated values for the great majority of the wells, as wells casing have been screened in all productive areas encountered along drilled depths. Aquifer recharge Visual-Balan, distributed model Aquifer recharge: 140 -290 mm/yr
AQUIFER: Conceptual model
NUMERICAL FLOW MODEL
NUMERICAL FLOW MODEL Visual MODFLOW. PRO 500 x 500 m grid size Study area model grid and boundary conditions. L. Candela, K. Tamoh, J. Jimenez-Martínez, F. J. Elorza. Technical University of Catalonia (Spain) R. Ramdin, R. Sankar, J. Francis, M. Julien, N. Mc Intosh, C. Santana. Water Authority and Sanitation-(WASA) S. D’Angelo. UNESCO-IHP
NUMERICAL FLOW MODEL The five defined layers of the Erin aquifer numerical model
NUMERICAL FLOW MODEL cross-section of the Erin aquifer numerical model Tridimensional shape of the modeled area
NUMERICAL FLOW MODEL Location of abstraction wells
RESULTS Calibration plot
RESULTS Conductivity (m/s) Specific yield 2. 05 E-5 0. 18 Layer 2 1. E-9 0. 05 Layer 3 (FC 124) 1. 3 E-5 0. 21 Layer 4 1. E-9 0. 05 Layer 5 (FW 200) 1. 1 E-5 0. 21 Layer 1 ( Detritic) final calibrated values of hydraulic parameters for the Erin hydrostratigraphic units
RESULTS Layer 1, Detritic. Head potential
RESULTS Layer 3, FC 124. head potential
RESULTS Layer 5, FC 200. head potential
RESULTS Simulated water balance
SENSITIVITY ANALYSIS : Effects of hydraulic conductivity In sea Out sea 8. 00 E+05 1. 28 E+08 6. 00 E+05 1. 28 E+08 4. 00 E+05 1. 28 E+08 2. 00 E+05 0. 00 E+00 -50% 1. 28 E+08 0% 50% Head Detritic 0% Head FW 200 40 20 10 0 0% 50% -50% Head FC 124 5 4 3 2 1 0 30 -50% 15 10 5 0 0% 50% -50% 0% 50%
SENSITIVITY ANALYSIS : Effects of recharge In sea Out sea 1. 50 E+06 2. 00 E+08 1. 50 E+08 1. 00 E+06 1. 00 E+08 5. 00 E+05 5. 00 E+07 0. 00 E+00 -20% 0% -40% 20% 40% Head Detritic -40% Head FW 200 30 10 8 6 4 2 0 2 1 0 0% 20% 40% 0 -40% -20% 40% Head FC 124 3 10 -20% 4 20 -40% 0. 00 E+00 -20% 0% 0% 20% 40% -20% 0% 20% 40%
CONCLUDING REMARKS: § Geologic characterisation of the unit proved to be non-sufficient to properly define the aquifer system conceptual model § Recharge is the most important parameter conditioning groundwater level § 20% decrease of natural recharge from precipitation could imply : 1) a decrease of groundwater level between 0. 7 and 4. 3 m 2) seawater input may increase into the aquifer up to 120 % 1 363 000 m 3 § An accurate DEM is needed for model definition § Results are only representative for steady state conditions and for the calibration period § Piezometric data acquisition along time (hydrographs) and specific aquifer water level is needed for future transient simulations. § Meteorological data for climate change impacts simulation under selected scenarios have not been provided and future impacts cannot be simulated.