Simple Linear Regression Correlation X 1 Y 1
 (X 2, Y 2) (X")


 Estimator (Std Error)2")


- Slides: 23
Simple Linear Regression & Correlation (X 1, Y 1) (X 2, Y 2) (X 3, Y 3) (X 4, Y 4) … (Xn, Yn) Relationship Between Two Variables: Linear Relationship + Curvilinear Relationship No Relationship + + + + 1) Measure the Degree of Association Between the 2 Variables 2) Forecast Future Values 3) Measure the Error +
Simple Linear Regression
Method of Least Squares Want to Minimize this This leads to 2 Equations:
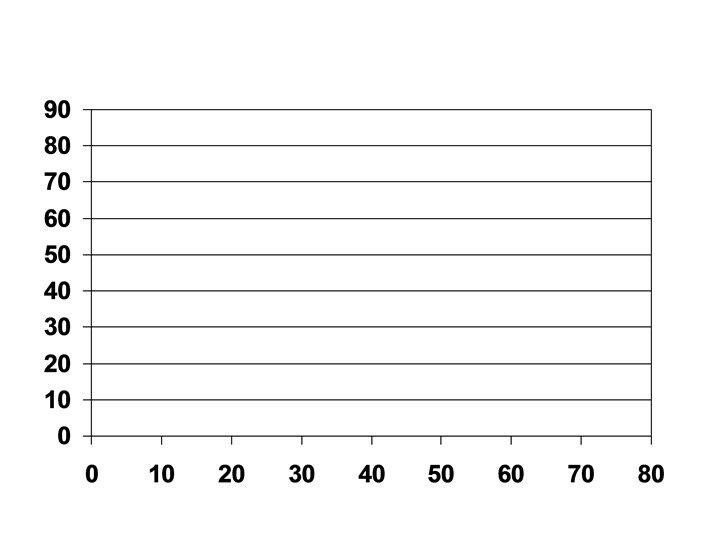
Example 1: Test scores 1 st 2 nd X Y 80 90 60 70 40 40 30 40 40 60
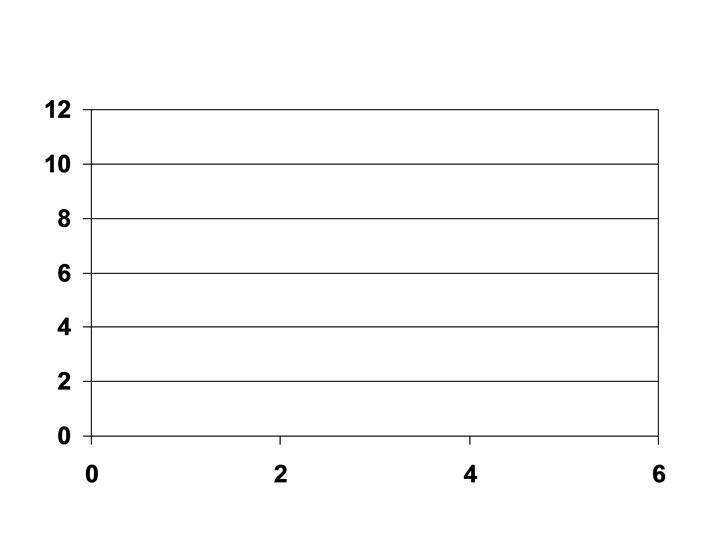
Example 2: Ads vs Sales Ads Sales X Y 0 1 1 2 2 3 3 5 4 8 5 11 6 12
Partition the Sum of Squares: Total Variation of Y Total Variation TSS = Unexplained + Explained Variation = SSE Variation + SSR
Regression ANOVA Table: Source df SS MS Regression 1 SSR = b 1 SSxy MSR = SSR/1 Error n-2 SSE = SSy - b 1 SSxy MSE = SSE/n-2 Total n-1 TSS = SSy Coefficient of Determination: r 2 = SSR/TSS % of Variation of Y Explained by X Model Hypothesis Test: H 0: Model is Not Significant HA: Model is Significant R: F > Fα(1, n-2) F = MSR/MSE
Ex 1: Ex 2:
MSE = Estimated Error Variance Se 2 Parameter Estimator β 0 b 0 β 1 b 1 Interval Estimate: Ex 1: (Standard Error)2 b 0 - e ≤ β 0 ≤ b 0 + e ; e = t • Sb 0
Interval Estimate: b 1 - e ≤ β 1 ≤ b 1 + e Ex 2: Hypothesis Test: H 0 : β 1 = 0 HA : β 1 ≠ 0 R: t > tα/2, df=n-2 t < -tα/2, df=n-2 Ex 2: ; e = t • Sb 1
Parameter Y E(Y|X) Estimator (Std Error)2
Confidence Interval for the Mean Value of Y for a Given X Ex 2: Xg = 5
Interval Estimate for a Single Value of Y for a Given X Ex 2: Xg = 5 Prediction Interval
Correlation Coefficient: -1 ≤ r ≤ 1 r<0 r>0 r=0
Sample Correlation Coefficient: Ex 1: Ex 2: Hypothesis Test: H 0 : ρ = 0 HA : ρ ≠ 0 R: t > tα/2, df=n-2 t < -tα/2, df=n-2 Ex 2:
Ex 3: Units X 2 X SSx = SSxy = SSy = Cost XY Y 1 8 2 8 3 10 4 14 5 16 6 16 7 18 8 22 Y 2
Prediction Equation: ANOVA Table for the Model: Test the Model:
Test for β 1 = 0: 95% CI for β 0: Test for ρ = 0:
95% CI for Mean Value of Y when X = 7: 95% PI for Single Value of Y when X = 7:
Human Resource Selection Ho: Other Performer – Do Not Hire HA: Superior Performer – Do Hire False Negative Other Superior R: Test Score > Xc False positive Do Not Hire Do Hire