SIMO Chart It is a graphic representation of


 = 0. 4 min")


- Slides: 8
SIMO Chart • It is a graphic representation of the sequence of therbligs or group of therbligs performed by body members of operator. It is drawn on a common time scale. In other words, it is a two-hand process chart drawn in terms of therbligs and with a time scale, see Figure making the Simo Chart. A video film or a motion picture film is shot of the operation. The film is analyzed frame by frame. For the left hand, the sequence of therbligs (or group of therbligs) with their time values are recorded on the column corresponding to the left hand. The symbols are added against the length of column representing the duration of the group of therbligs. The procedure is repeated for the right and other body members (if any) involved in carrying out the operation. • It is generally not possible to time individual therbligs. A certain number of therbligs may be grouped into an element large enough to be measured.
Uses of Simo Chart • From the motion analysis shown about the motions of the two hands (or other body members) involved in doing an operation, inefficient motion pattern can be identified any violation of the principle of motion economy can be easily noticed. The chart, therefore, helps in improving the method of doing the operation so that balanced two-handed actions with coordinated foot and eye motions can be achieved and ineffective motion can be either reduced or eliminated. The result is a smoother, more rhythmic work cycle that keeps both delays and operator fatigue to the minimum extent.
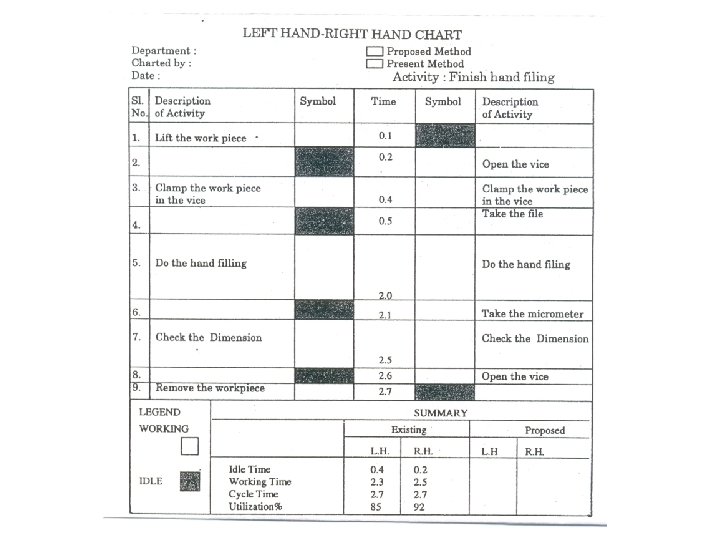
• It is one of the recording techniques of micro-motion study and records simultaneously the different therbligs performed by different parts of the body of one or more operators on a common time scale. SIMO stands for simultaneous motion cycle chart. • A left-right hand chart has been drawn in fig for the following information. • Activity: Finish and filing • Time for searching, holding and lifting the work piece to the vice table by left hand = 0. 1 min • Time for opening the vice by right hand = 0. 1 min • Clamping the work piece in the vice(involves both hand) = 0. 2 min • Time for holding and lifting the file by the right hand = 0. 1 min • Time for hand filing(involves both hands) = 0. 5 min • Time for bringing the micrometer by right hand = 0. 1 min
• Time for checking the dimension (involves both hands) = 0. 4 min • Time for opening the vice by right hand = 0. 1 min • Time for removing the work piece by left hand = 0. 1 min The SIMO chart depicts the following: 1. The cycle time 2. Percentage utilization of the hands or the part of the body taking operation 3. Total working time of part of the body 4. Total idle time of the part of the body 5. Total time for which two or more parts of the body are involved simultaneously For the work involving the use of hands, it is desired that work should be taken from both the hands. If the participation of both the hands are equal, it is best thing. This can be substantiated with the help of a simple example of type writing.
• If typing is done by one hand only the speed of typing will be lower than if it is done by both the hands. The speed will be much lower if only one finger is used. • The SIMO chart for left hand right hand, inform about the degree of participation of both the hands. If it is observed that only one hand is used mostly say right hand then by relaying out the work place the utilization of left hand could be increased. The following arrangement may be done: • Keep the work piece; say near the left hand of the operator so that it is within its reach • Keep the file, micrometer on the right sight of the operator • Keep the finished goods basket near the left hand so that after the operation, the work piece is picked up by the left hand kept in the basket.
• The SIMO chart thus could be used as a tool for, 1. Reducing the work cycle 2. Reducing the possibility of fatigue due to excessive work done by only one hand or one part of the body 3. Relaying out the work place 4. Comparing different work-layouts on the basis of percentage utilization of the body parts or hands or cycle time.