
Silvia Spinozzi QC Manager Convalida di tecniche analitiche

- Slides: 27
Silvia Spinozzi QC Manager Convalida di tecniche analitiche particolari: lo stato 1
OUTLINE Outline • • • Importance of solid state for pharma: ICHQ 6 A Classification of Solid State Characterization Techniques Challenges in solid state method development (Qualitative and Quantitative Analysis) Our approach in: quantitative method development and validation: Case study 1 qualitative method development and validation: Case study 2 Conclusion 2
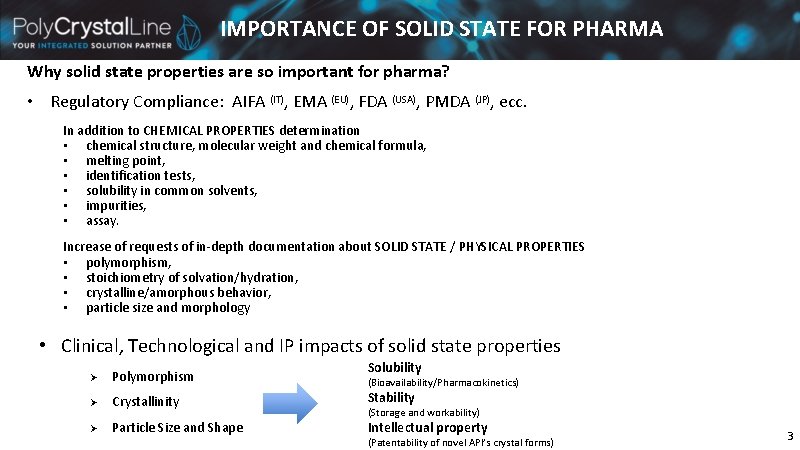
IMPORTANCE OF SOLID STATE FOR PHARMA Why solid state properties are so important for pharma? • Regulatory Compliance: AIFA (IT), EMA (EU), FDA (USA), PMDA (JP), ecc. In addition to CHEMICAL PROPERTIES determination • chemical structure, molecular weight and chemical formula, • melting point, • identification tests, • solubility in common solvents, • impurities, • assay. Increase of requests of in-depth documentation about SOLID STATE / PHYSICAL PROPERTIES • polymorphism, • stoichiometry of solvation/hydration, • crystalline/amorphous behavior, • particle size and morphology • Clinical, Technological and IP impacts of solid state properties Solubility Ø Polymorphism Ø Crystallinity Stability Ø Particle Size and Shape Intellectual property (Bioavailability/Pharmacokinetics) (Storage and workability) (Patentability of novel API’s crystal forms) 3
ICH Q 6 A – DECISION TREE #4: INVESTIGATING THE NEED TO SET ACCEPTANCE CRITERIA FOR POLYMORPHISM IN DRUG SUBSTANCE AND DRUG PRODUCTS Drug Substance Drug Product – Solid Form or liquid containing undissolved drug substance 4
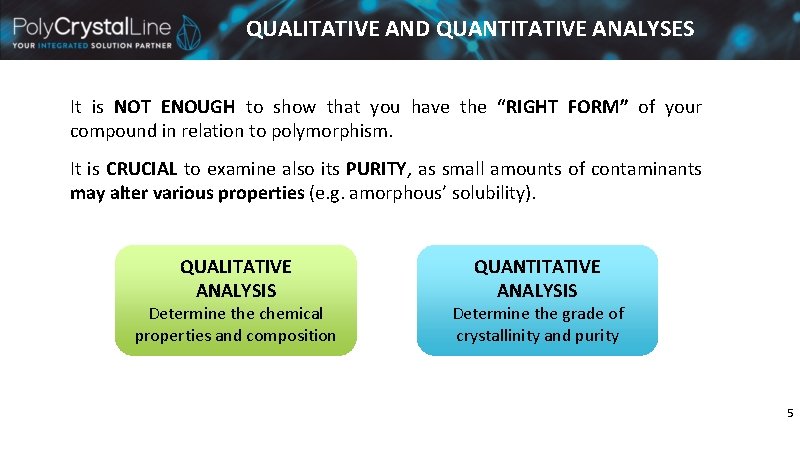
QUALITATIVE AND QUANTITATIVE ANALYSES It is NOT ENOUGH to show that you have the “RIGHT FORM” of your compound in relation to polymorphism. It is CRUCIAL to examine also its PURITY, as small amounts of contaminants may alter various properties (e. g. amorphous’ solubility). QUALITATIVE ANALYSIS Determine the chemical properties and composition QUANTITATIVE ANALYSIS Determine the grade of crystallinity and purity 5
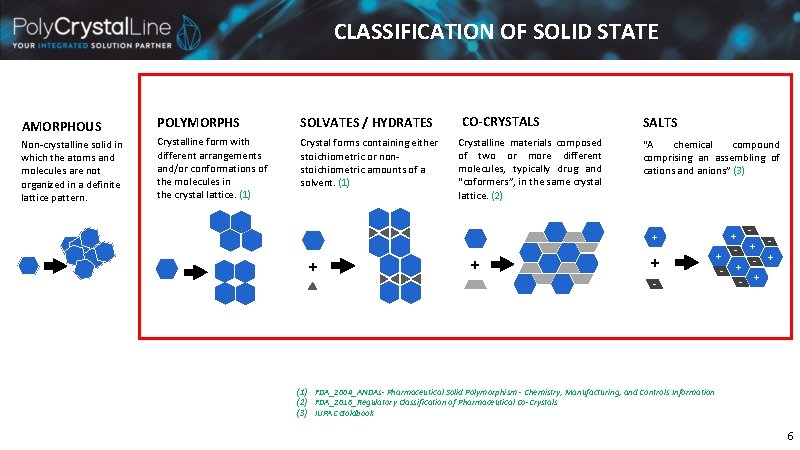
CLASSIFICATION OF SOLID STATE AMORPHOUS Non-crystalline solid in which the atoms and molecules are not organized in a definite lattice pattern. POLYMORPHS SOLVATES / HYDRATES Crystalline form with different arrangements and/or conformations of the molecules in the crystal lattice. (1) Crystal forms containing either stoichiometric or nonstoichiometric amounts of a solvent. (1) CO-CRYSTALS Crystalline materials composed of two or more different molecules, typically drug and “coformers”, in the same crystal lattice. (2) SALTS “A chemical compound comprising an assembling of cations and anions” (3) + + - + - + (1) FDA_2004_ANDAs- Pharmaceutical Solid Polymorphism - Chemistry, Manufacturing, and Controls Information (2) FDA_2016_Regulatory Classification of Pharmaceutical Co-Crystals (3) IUPAC Goldbook 6
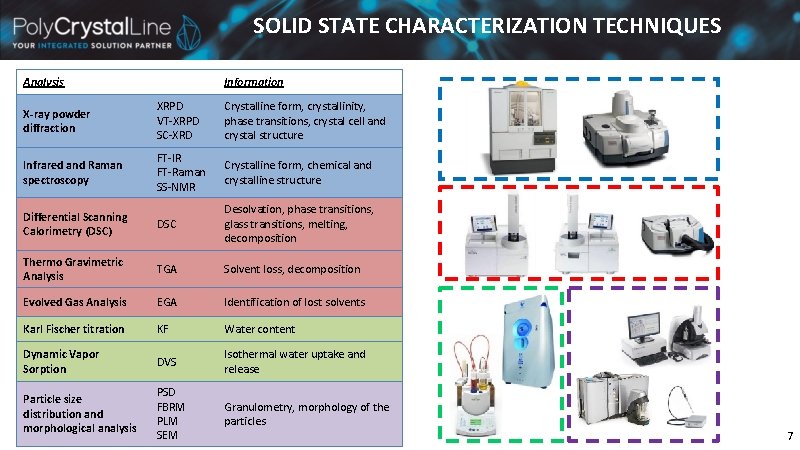
SOLID STATE CHARACTERIZATION TECHNIQUES Analysis Information X-ray powder diffraction XRPD VT-XRPD SC-XRD Crystalline form, crystallinity, phase transitions, crystal cell and crystal structure Infrared and Raman spectroscopy FT-IR FT-Raman SS-NMR Crystalline form, chemical and crystalline structure Differential Scanning Calorimetry (DSC) DSC Desolvation, phase transitions, glass transitions, melting, decomposition Thermo Gravimetric Analysis TGA Solvent loss, decomposition Evolved Gas Analysis EGA Identification of lost solvents Karl Fischer titration KF Water content Dynamic Vapor Sorption DVS Isothermal water uptake and release Particle size distribution and morphological analysis PSD FBRM PLM SEM Granulometry, morphology of the particles 7
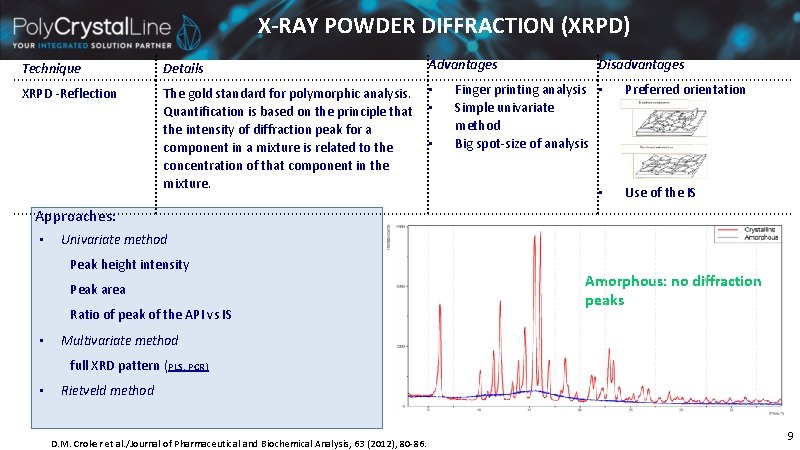
X-RAY POWDER DIFFRACTION (XRPD) Technique Details Advantages XRPD -Reflection The gold standard for polymorphic analysis. Quantification is based on the principle that the intensity of diffraction peak for a component in a mixture is related to the concentration of that component in the mixture. • • • Disadvantages Finger printing analysis • Simple univariate method Big spot-size of analysis • Preferred orientation Use of the IS Approaches: • Univariate method Peak height intensity Peak area Ratio of peak of the API vs IS • Amorphous: no diffraction peaks Multivariate method full XRD pattern (PLS, PCR) • Rietveld method D. M. Croker et al. /Journal of Pharmaceutical and Biochemical Analysis, 63 (2012), 80 -86. 9
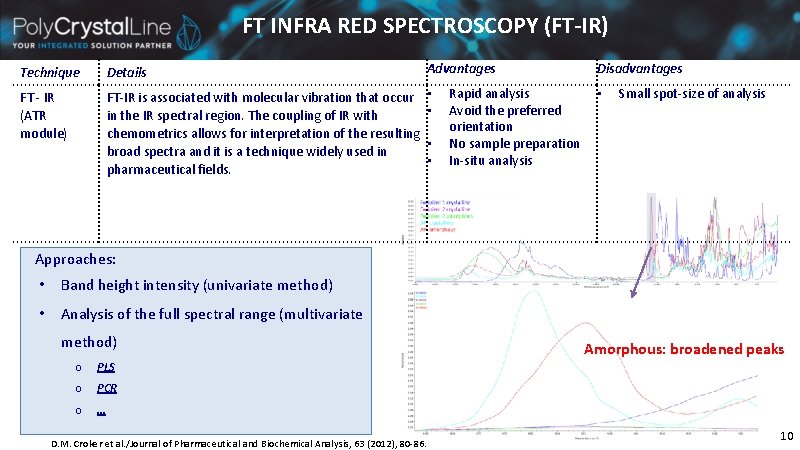
FT INFRA RED SPECTROSCOPY (FT-IR) Advantages Technique Details FT - IR (ATR module) FT-IR is associated with molecular vibration that occur • • in the IR spectral region. The coupling of IR with chemometrics allows for interpretation of the resulting • broad spectra and it is a technique widely used in • pharmaceutical fields. Rapid analysis Avoid the preferred orientation No sample preparation In-situ analysis Disadvantages • Small spot-size of analysis Approaches: • Band height intensity (univariate method) • Analysis of the full spectral range (multivariate method) o PLS o PCR o … D. M. Croker et al. /Journal of Pharmaceutical and Biochemical Analysis, 63 (2012), 80 -86. Amorphous: broadened peaks 10
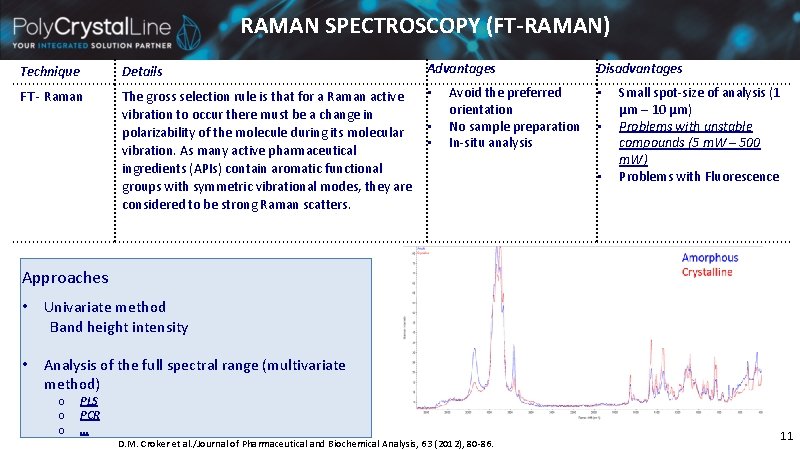
RAMAN SPECTROSCOPY (FT-RAMAN) Advantages Technique Details FT - Raman The gross selection rule is that for a Raman active • vibration to occur there must be a change in polarizability of the molecule during its molecular • • vibration. As many active pharmaceutical ingredients (APIs) contain aromatic functional groups with symmetric vibrational modes, they are considered to be strong Raman scatters. Avoid the preferred orientation No sample preparation In-situ analysis Disadvantages • • • Small spot-size of analysis (1 μm – 10 μm) Problems with unstable compounds (5 m. W – 500 m. W) Problems with Fluorescence Approaches • Univariate method Band height intensity • Analysis of the full spectral range (multivariate method) o o o PLS PCR … D. M. Croker et al. /Journal of Pharmaceutical and Biochemical Analysis, 63 (2012), 80 -86. 11
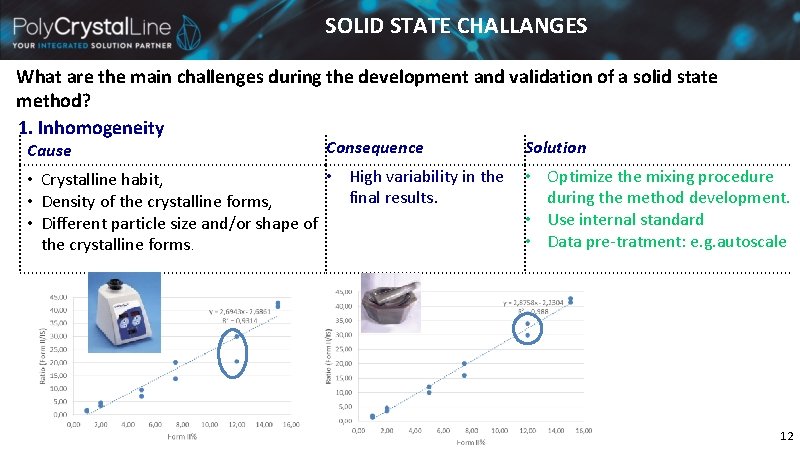
SOLID STATE CHALLANGES What are the main challenges during the development and validation of a solid state method? 1. Inhomogeneity Cause Consequence Solution • High variability in the • Optimize the mixing procedure • Crystalline habit, final results. during the method development. • Density of the crystalline forms, • Use internal standard • Different particle size and/or shape of • Data pre-tratment: e. g. autoscale the crystalline forms. 12
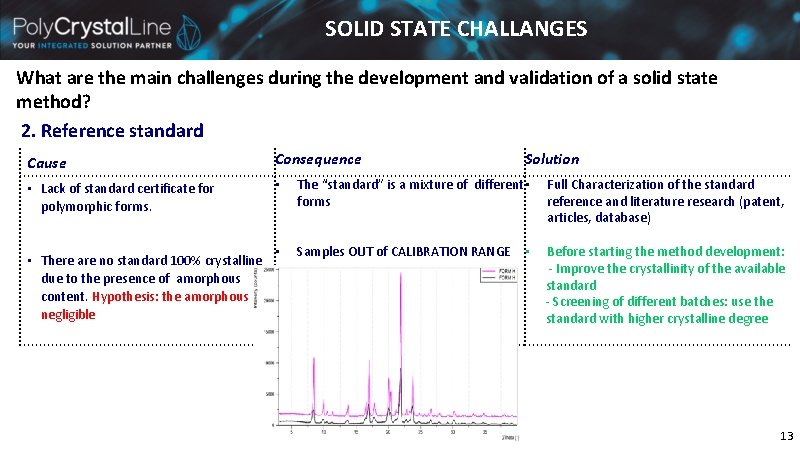
SOLID STATE CHALLANGES What are the main challenges during the development and validation of a solid state method? 2. Reference standard Cause Consequence • Lack of standard certificate for polymorphic forms. • The “standard” is a mixture of different • forms Full Characterization of the standard reference and literature research (patent, articles, database) • Samples OUT of CALIBRATION RANGE • Before starting the method development: - Improve the crystallinity of the available standard - Screening of different batches: use the standard with higher crystalline degree • There are no standard 100% crystalline due to the presence of amorphous content. Hypothesis: the amorphous is negligible Solution 13
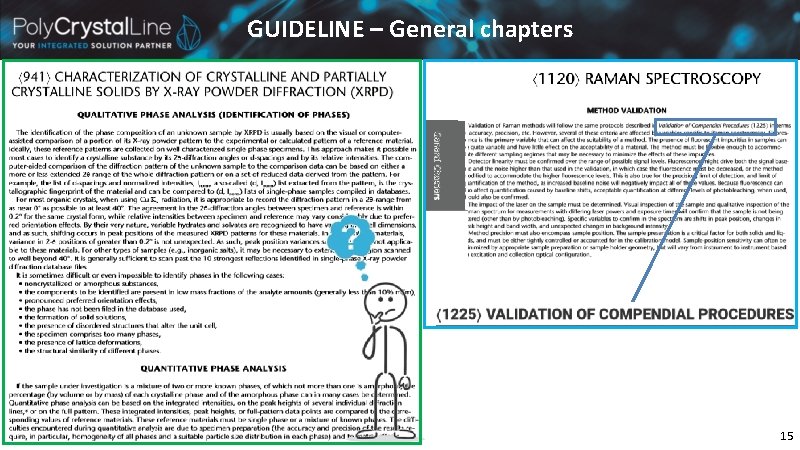
SOLID STATE CHALLANGES What are the main challenges during the development and validation of a solid state method? 3. Guide. Lines Cause Consequence • There are no available guidelines • Mistake in the interpretation of the for the development and validation General Chapters. of solid state analytical technique. Solution • Validation: use the same approach used for the chromatographic method (e. g. ICH Q 2 R 1). 14
GUIDELINE – General chapters 15
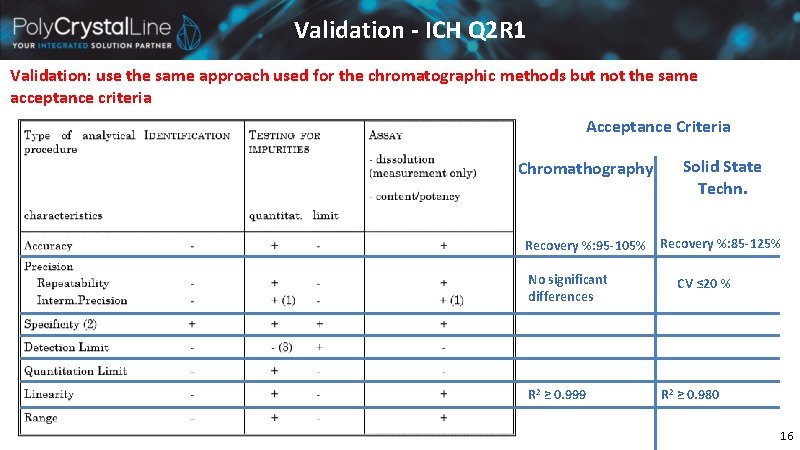
Validation - ICH Q 2 R 1 Validation: use the same approach used for the chromatographic methods but not the same acceptance criteria Acceptance Criteria Chromathography Solid State Techn. Recovery %: 95 -105% Recovery %: 85 -125% No significant differences R 2 ≥ 0. 999 CV ≤ 20 % R 2 ≥ 0. 980 16
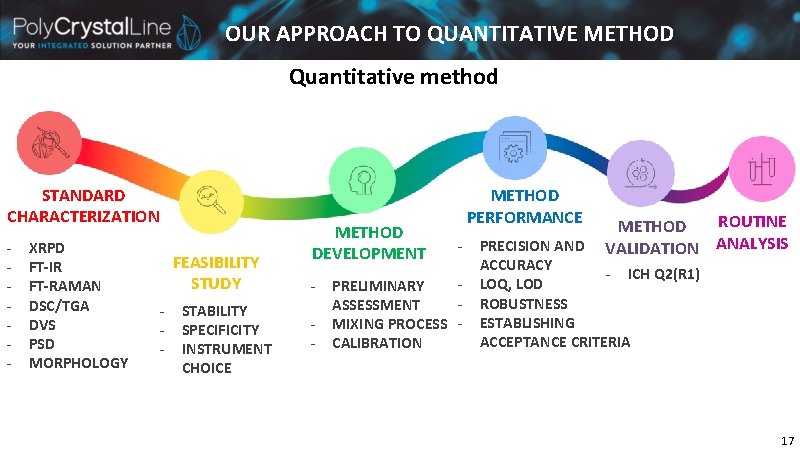
OUR APPROACH TO QUANTITATIVE METHOD Quantitative method STANDARD CHARACTERIZATION - XRPD FT-IR FT-RAMAN DSC/TGA DVS PSD MORPHOLOGY FEASIBILITY STUDY - STABILITY SPECIFICITY INSTRUMENT CHOICE METHOD DEVELOPMENT - METHOD PERFORMANCE - PRELIMINARY ASSESSMENT MIXING PROCESS CALIBRATION ROUTINE METHOD VALIDATION ANALYSIS PRECISION AND ACCURACY - ICH Q 2(R 1) LOQ, LOD ROBUSTNESS ESTABLISHING ACCEPTANCE CRITERIA 17
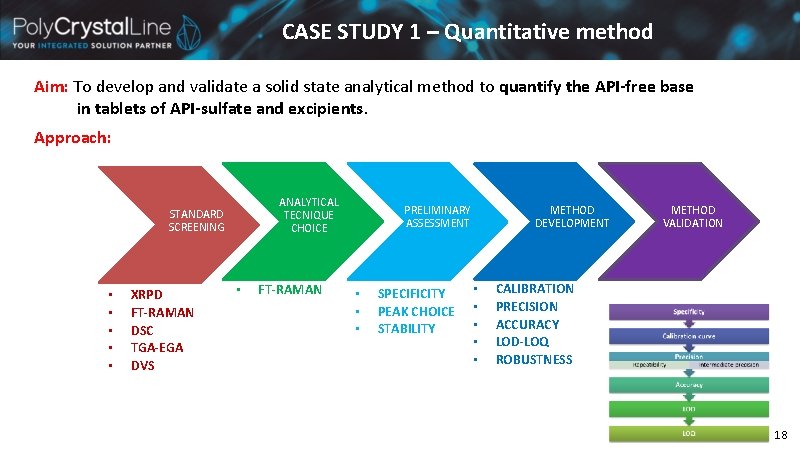
CASE STUDY 1 – Quantitative method Aim: To develop and validate a solid state analytical method to quantify the API-free base in tablets of API-sulfate and excipients. Approach: ANALYTICAL TECNIQUE CHOICE STANDARD SCREENING PRELIMINARY ASSESSMENT METHOD DEVELOPMENT METHOD VALIDATION • • • XRPD FT-RAMAN DSC TGA-EGA DVS • FT-RAMAN • • • SPECIFICITY PEAK CHOICE STABILITY • • • ICH Q 2(R 1) CALIBRATION PRECISION ACCURACY LOD-LOQ ROBUSTNESS 18
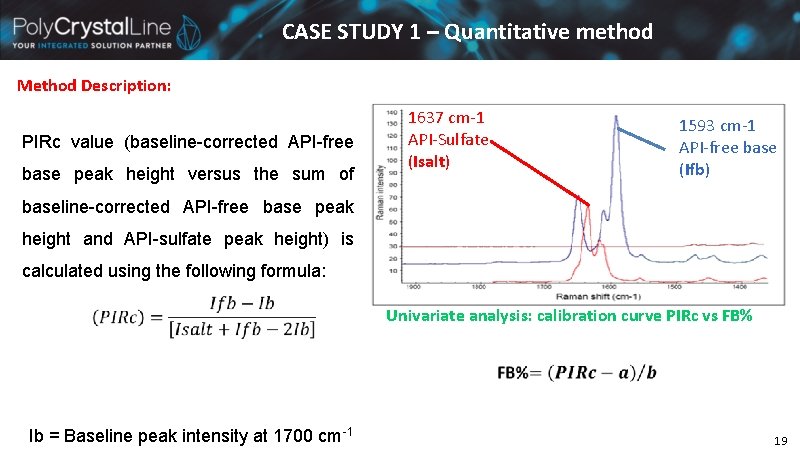
CASE STUDY 1 – Quantitative method Method Description: PIRc value (baseline-corrected API-free base peak height versus the sum of 1637 cm-1 API-Sulfate (Isalt) 1593 cm-1 API-free base (Ifb) baseline-corrected API-free base peak height and API-sulfate peak height) is calculated using the following formula: Univariate analysis: calibration curve PIRc vs FB% Ib = Baseline peak intensity at 1700 cm-1 19
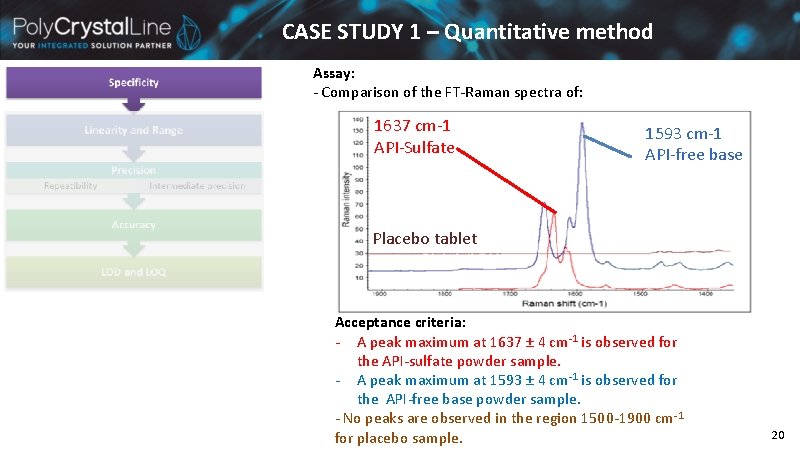
CASE STUDY 1 – Quantitative method Assay: - Comparison of the FT-Raman spectra of: 1637 cm-1 API-Sulfate 1593 cm-1 API-free base Placebo tablet Acceptance criteria: - A peak maximum at 1637 ± 4 cm-1 is observed for the API-sulfate powder sample. - A peak maximum at 1593 ± 4 cm-1 is observed for the API-free base powder sample. - No peaks are observed in the region 1500 -1900 cm-1 for placebo sample. 20
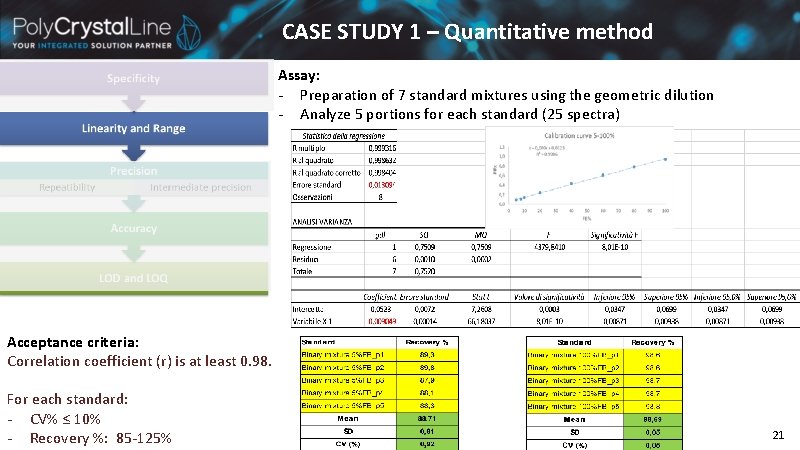
CASE STUDY 1 – Quantitative method Assay: - Preparation of 7 standard mixtures using the geometric dilution - Analyze 5 portions for each standard (25 spectra) Acceptance criteria: Correlation coefficient (r) is at least 0. 98. For each standard: - CV% ≤ 10% - Recovery %: 85 -125% 21
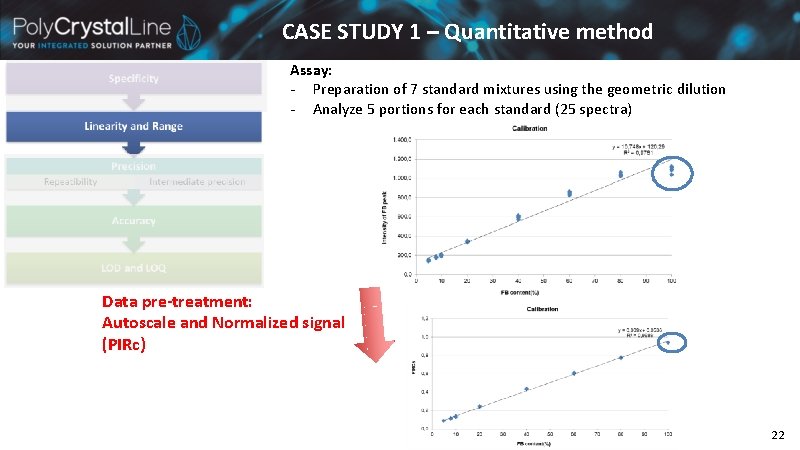
CASE STUDY 1 – Quantitative method Assay: - Preparation of 7 standard mixtures using the geometric dilution - Analyze 5 portions for each standard (25 spectra) Data pre-treatment: Autoscale and Normalized signal (PIRc) 22
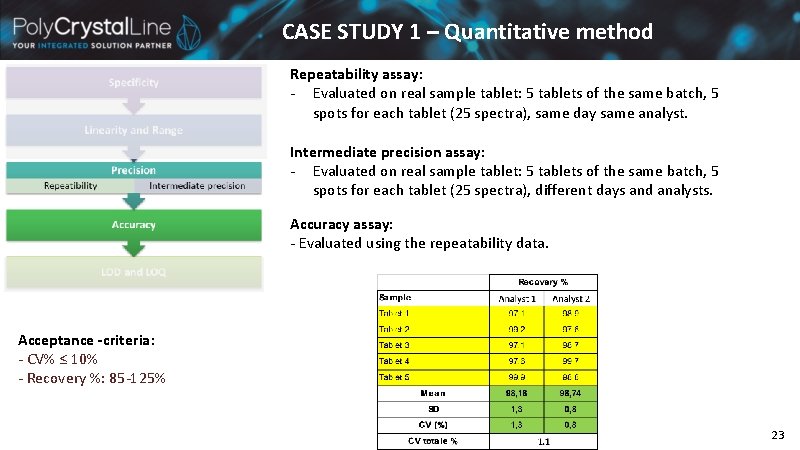
CASE STUDY 1 – Quantitative method Repeatability assay: - Evaluated on real sample tablet: 5 tablets of the same batch, 5 spots for each tablet (25 spectra), same day same analyst. Intermediate precision assay: - Evaluated on real sample tablet: 5 tablets of the same batch, 5 spots for each tablet (25 spectra), different days and analysts. Accuracy assay: - Evaluated using the repeatability data. Acceptance -criteria: - CV% ≤ 10% - Recovery %: 85 -125% 23
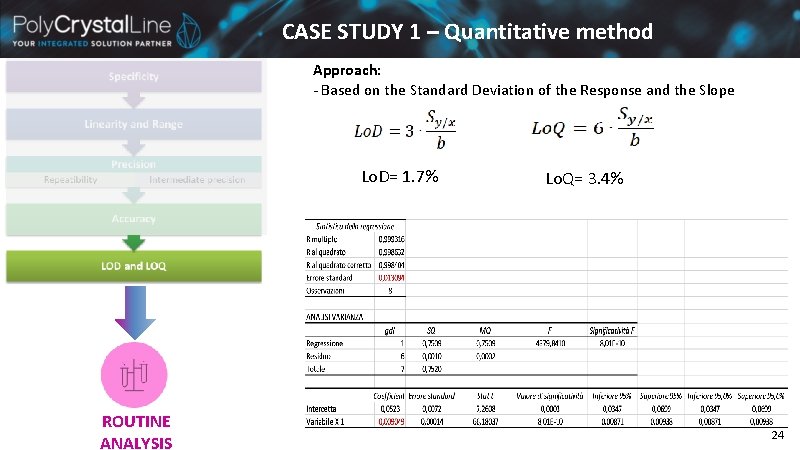
CASE STUDY 1 – Quantitative method Approach: - Based on the Standard Deviation of the Response and the Slope Lo. D= 1. 7% ROUTINE ANALYSIS Lo. Q= 3. 4% 24
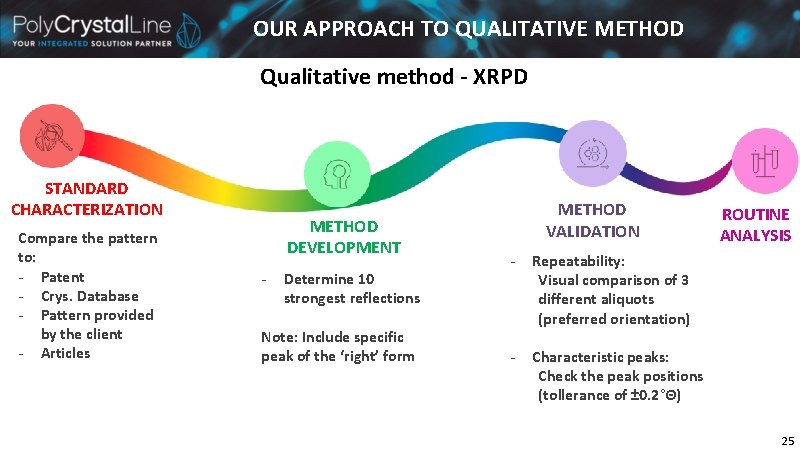
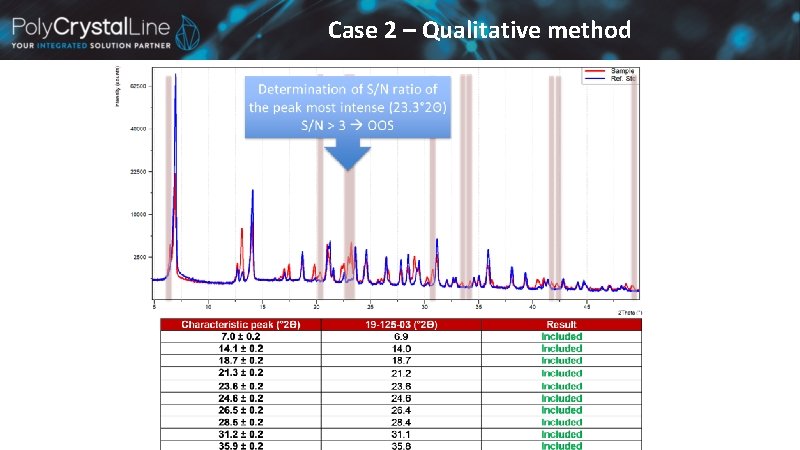
OUR APPROACH TO QUALITATIVE METHOD Qualitative method - XRPD STANDARD CHARACTERIZATION Compare the pattern to: - Patent - Crys. Database - Pattern provided by the client - Articles METHOD DEVELOPMENT - Determine 10 strongest reflections Note: Include specific peak of the ‘right’ form METHOD VALIDATION - Repeatability: Visual comparison of 3 different aliquots (preferred orientation) - Characteristic peaks: Check the peak positions (tollerance of ± 0. 2°Θ) ROUTINE ANALYSIS 25
Case 2 – Qualitative method
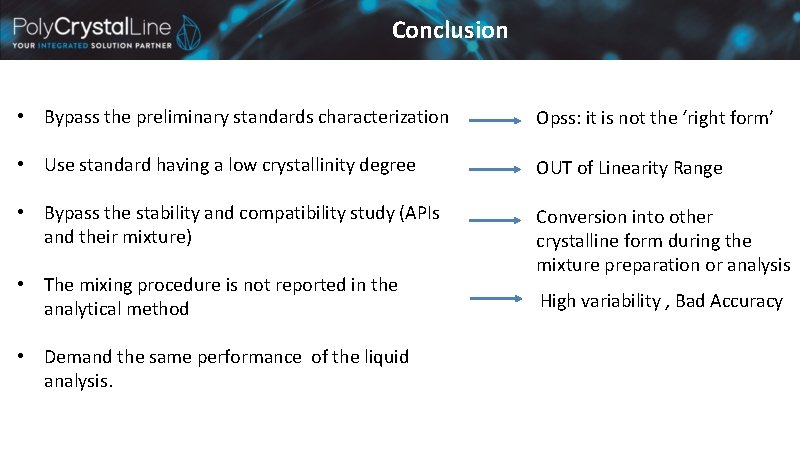
Conclusion • Bypass the preliminary standards characterization Opss: it is not the ‘right form’ • Use standard having a low crystallinity degree OUT of Linearity Range • Bypass the stability and compatibility study (APIs and their mixture) Conversion into other crystalline form during the mixture preparation or analysis • The mixing procedure is not reported in the analytical method • Demand the same performance of the liquid analysis. High variability , Bad Accuracy
Silvia Spinozzi – QC Manager silvia. spinozzi@polycrystalline. it Via F. S. Fabri, 127/1 - 40059 Medicina (BO) ITALY www. polycrystalline. it