Signs Symptoms Complications Selling Sickness Carbohydrates Pancreas Type

§ Signs, Symptoms, Complications § Selling Sickness § Carbohydrates § Pancreas § Type I vs Type II Diabetes § Water/Osmolality/Electrolytes § Acid-Base Disorders § Lipids § Heart Disease § Renal Disease

http: //memekid. com/funny-chemistry-cat-memes. htm

http: //www. md-reasons. info/2014/07/diabetes-complications-of-diabetes. html

§ Ill Defined Diseases ØAffect numerous people High Cholesterol and Diabetes § Drug Companies Profits ØExpand boundaries of illness ØNew customers § Diabetes ØBefore 1997 Diabetes diagnosis fasting blood glucose > 140 mg/d. L ØAfter 1997 Diabetes diagnosis fasting blood glucose > 126 mg/d. L § Cholesterol ØBefore 1998 High Cholesterol > 240 mg/d. L ØAfter 1998 High Cholesterol > 200 mg/d. L § Increased new customers by 86% § Lifestyle changes ØDiet and Exercise

§ Types of Energy the body can use ØCarbohydrates ØProteins ØLipids § Carbs are Good § Carbohydrates ØGlycemic index ØInsulin Response § Definitions ØGlycolysis ØGlycogenesis ØGlycogenolysis ØGluconeogenesis – ATP and Pyruvate http: //www. rogerspeakperformers. com/2012/the-glycemic-index/

§ Anatomy of a Pancreas ØExocrine – digestive enzymes amylase and lipase § Increased in pancreatitis (lipase more specific) ØEndocrine - Islets of Langerhans § Beta Cells – Insulin § Alpha Cells – Glucagon § Delta Cells – Somatostatin § Insulin ØAllows glucose to enter cells ØOnly hormone than can decrease glucose levels § Glucagon ØPrimary hormone responsible for elevating glucose levels http: //www. medicinenet. com/image-collection/pancreas_picture_1/picture. htm

§ When the body has an excess of glucose it will go through the process of: A) Decreasing cell membrane permeability B) Gluconeogenesis C) Glycogenesis D) Glycogenolysis § Glucagon acts by: A) Increasing glycogenolysis B) Increasing glycogenesis C) Increasing glycolysis D) Inhibiting glycogenolysis PANCREAS REVIEW
 ØMostly young and thin ØLittle to")
§ Type I AKA insulin dependent diabetes (IDDM) ØMostly young and thin ØLittle to no insulin produced – autoimmune destruction ØDiabetic ketoacidosis - common ØLab findings • Blood glucose levels 300 -500 mg/d. L • Ketonuria • Ketonemia • Decreased Na and Cl • Increased K • Slightly increased osmolality § Type II non insulin dependent diabetes (NIDDM) ØMost common form found in mostly older and obese adults ØCombination of Insulin resistance and Insulin production issues ØDiabetic ketoacidosis – rare ØHyperosmolar coma ØLab findings § Blood glucose levels >1000 mg/d. L § Greatly increased osmolality

http: //www. psychiatrictimes. com/metabolic-disorders/metabolic-monitoring-patients-antipsychotic-medications/page/0/4

§ Glucose – serum, plasma, whole blood ØPreferred diagnosis test is fasting plasma glucose (fasting 10 hours prior) • Reference range 70 -110 mg/d. L § Glycosylated hemoglobin or Hb. A 1 C – average glucose over 3 months ØWhole blood EDTA tube § Ketone levels – serum or urine – acetest sodium nitroprusside (detects acetoacetic acid) § Microalbuminuria – minute concentrations of albumin in urine (early signs of nephropathy) http: //blog. diabetesms. com/? cat=3

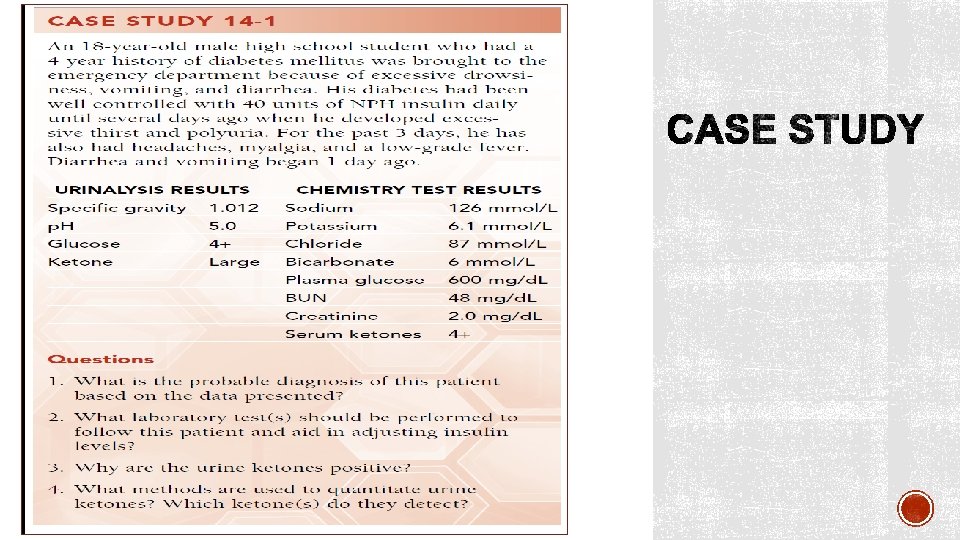
§ Jane Doe is a 55 year-old-female. Her lab results were: ØFasting glucose 122 mg/d. L ØFasting triglycerides 144 mg/d. L All other lab tests were normal. The doctor ordered a 2 hour OGTT. The 2 hour glucose tolerance test result was 228 mg/d. L. These results indicate: A) Results are normal B) Diabetes mellitus C) Hypoglycemia D) Ketoacidosis CARBOHYDR ATES REVIEW

§ Monitoring long-term glucose control in patients with adult onset diabetes mellitus can best be accomplished by: A) Urine microalbumin B) Glucose tolerance testing C) 2 -hour postprandial serum glucose D) Glycosylated hemoglobin CARBOHYDR ATES REVIEW

§ Average Water Content of the Human Body is 40% to 75% of total body weight. ØIntracellular fluid – two-thirds of total body water ØExtracellular fluid – one-third of total body water (Intravascular and extravascular fluid) § Intravascular fluid plasma (93% water) ØCarries proteins, electrolytes, nutrients, hormones, wastes § What must be kept in a constant concentration in the body is: ØElectrolytes (ions) Øp. H (acid-base balance) ØWater http: //www. apswater. com/article. asp? id=129&title=What+are+the+chemical+properties+of+water?

§ Is a physical property of solution that is based on the concentration of solutes (particles) per kilogram of solvent Calculated osmolality (m. Osmol / kg H 20) = 2 [Na+ ] + [glucose] /20+ [BUN]/3 § Measured Osmolality is done using freezing point depression § Reference Range ØSerum 275 -295 m. Osm/kg § General indicator of water volume

§ Plasma osmolality directly effects the hypothalamus ØIncrease osmolality increases thirst ØIncrease osmolality increases ADH secretion from the posterior pituitary ØDecreased osmolality decreases ADH secretion § Deficiency of vasopressin (ADH) ØDiabetes Insipidus ØResults in large volume of dilute urine § Renin-angiotensin-aldosterone ØStimulates sodium reabsorption and potassium excretion http: //pixgood. com/adh-kidney. html
 ØIncreased thirst ØADH is secreted • Increases")
§ Water deficit ØOsmolality increases (electrolytes concentrated) ØIncreased thirst ØADH is secreted • Increases water reabsorption ØAldosterone is inhibited • Less sodium reabsorbed = decrease in electrolytes § Water overload ØOsmolality decreases (electrolytes diluted) ØThirst suppressed ØAldosterone secreted • Sodium is reabsorbed = increase in electrolytes

§ Remember two basic types of dehydration ØDying of thirst in the desert – losing more water relative to electrolytes • Lab findings – all electrolytes elevated o Hypernatremia o Hyperosmolality ØVomiting and Diarrhea – losing more electrolytes relative to water • Lab findings – all electrolytes decreased o Hyponatremia o Hyposmololality https: //www. cartoonstock. com/directory/t/thirsty. asp

§ Anions have a negative charge § Cations have a positive charge § Extracellular fluid has a high concentration of Na+, Cl-, HCO 3 - § Intracellular fluid has a high concentration of K+, Ca+, Mg+, PO 4 - ØHemolysis is unacceptable for these tests § Sodium – osmolality = blood volume ØMajor extracellular cation 135 -145 m. Eq/L ØHyponatremia • With low serum osmolality – diarrhea, vomiting, diuretics • With normal serum osmolality – in vitro hemolysis • With high serum osmolality – hyperglycemia ØHypernatremia • Dehydration, diabetes insipidus (dilute urine), hyperaldosteronism

§ Potassium – myocardial contraction ØMajor intracellular cation 3. 4 – 5. 0 mmol/L (20 X greater inside cell than outside) • HEMOLYSIS IS UNACCEPTABLE ØBoth high and low levels will stop the heart Ø Hypokalemia • Vomiting, diarrhea, hyperaldosteronism Ø Hyperkalemia • Hyperglycemia, hypoaldosteronism (Addison’s disease) § Chloride – maintain electrical neutrality (chloride shift) ØMajor extracellular anion 98 -106 mmol/L ØPassively follows sodium increased and decreased in the same conditions ØSweat chloride test for cystic fibrosis – iontophoresis/pilocarpine http: //www. cdha. nshealth. ca/pathology-laboratory-medicine/clinical-chemistry/hemolysis
 – buffering system maintain p. H ØSecond most abundant")
§ Bicarbonate (HCO 3 -) – buffering system maintain p. H ØSecond most abundant anion in extracellular fluid 22 -29 mmol/L ØMeasured as total CO 2 • 90% of total CO 2 is bicarbonate ØAcid base imbalance • Decreased metabolic acidosis • Increased metabolic alkalosis ØExposure to air will decrease CO 2

§ Electrolytes analysis Ø Ion selective electrode – potentiometry using Nernst equation Ø Susceptible to protein build up § Sodium analysis selective membrane Ø Glass ion-exchange § Potassium analysis selective membrane Ø Valinomycin § Chloride analysis selective membrane Ø Ion exchange § Carbon dioxide (bicarbonate) Ø PCO 2 electrode http: //chemwiki. ucdavis. edu/Analytical_Chemistry_2. 0/11_Electrochemical_Methods/11 B%3 A_Potentiometric_Methods

§ Anion Gap ØDifference between unmeasured anions and unmeasured cations The anion gap is calculated as follows: [Na+] – ([Cl- ] + [HCO 3 - ]) or ([Na+] + [K+ ] ) – ([Cl- ] + [HCO 3 - ]) § Reference range: 10 -20 mmol/L § Used as a form of QC § High anion gap common in ketoacidosis
 Diarrhea B)")
§ Hyponatremia with a high osmolality is most commonly seen in A) Diarrhea B) Renal Failure C) In Vitro Hemolysis D) Hyperglycemia § In dehydration which of the following hormones is responsible for increasing water reabsorption in the tubules: A) Antiduretic Hormone B) Aldosterone C) Rennin D) Thyroxin WATER ELECTROLYTE OSMOLALITY REVIEW

Bicarbonate-carbonic acid buffer system Normal p. H reference range is 7. 35 -7. 45 p. CO 2 (35 -45 mm. Hg) HCO 3 (22 -26 mmol/L) CO 2 ≈ acid As CO 2 increases = p. H decreases As CO 2 decreases = p. H increases HCO 3 - ≈ base As HCO 3 - increases = p. H increases As HCO 3 - decreases = p. H decreases http: //groups. csail. mit. edu/medg/people/psz/Patil. Thesis 81/Patil 81_ch 1. html

§ Acidosis or Alkalosis § Determine what is causing the problem ØRespiratory or Metabolic (renal) § Respiratory problem ØIf p. H and PCO 2 are opposite each other • p. H PCO 2 § Metabolic problem ØIf p. H and HCO 3 - go up together or down together • p. H HCO 3 -
 ØIf Respiratory system • Hypoventilate")
§ Other normal system can then compensate (compensatory system) ØIf Respiratory system • Hypoventilate • Hyperventilate ØIf Metabolic system • Excrete or reabsorb H+ • Excrete or reabsorb HCO 3 - § Look at compensatory system reference range for either HCO 3 - or CO 2 ØUncompensated (value within normal range) ØPartially compensated (value outside of normal range) ØCompensated (value outside of normal range and p. H within normal range) § Collection ØHeparinized syringe radial artery ØNo Bubbles or exposure to air http: //www. rtmagazine. com/products/blood-gas-analysis/

§ Break it down Ø Acidosis or alkalosis? Ø Problem organ system? Ø Is the other system compensating? § ABG problem Review Ø p. H 7. 26 Ø p. CO 2 16 mm. Hg Ø HCO 3 - 7. 1 mmol/L § ABG problem Review Øp. H 7. 60 Øp. CO 2 25 mm. Hg ØHCO 3 - 24 mmol/L

§ Unsaturated Fat Ø 3 § Saturated Fat ØHydrogenation form of preservation ØTrans Fat ØSolid at room temperature https: //www. flickr. com/photos/fot oosvanrobin/11026441715/ http: //www. med-health. net/Olive-Oil. Ear-Wax. html http: //www. indiana. edu/~oso/Fat/trans. html

§ Lipids ØOrganic compounds insoluble in water ØFatty acids ØTriglycerides ØCholesterol § Fatty Acids ØBody makes most ØEssential fatty acids -not made by the body • Omega 3 and Omega 6 § Triglycerides ØMajority of what we eat ØLots of calories § Cholesterol ØPresent in all cell membranes ØBuilding block of bile and steroid hormones ØLiver makes most of what we need § Fat stored as Triglycerides in adipose tissue ØLipolysis – break down of fat for energy ØKetone bodies
 to smallest (most dense) ØChylomicrons • Largest lipoprotein")
§ Lipoproteins from largest (least dense) to smallest (most dense) ØChylomicrons • Largest lipoprotein least dense • Transport dietary lipids from the small intestine to the liver • Causes turbidity in serum Ø VLDL • Contains mostly triglycerides • Transports triglycerides from the liver to peripheral tissue ØLDL • Delivers cholesterol to cells • Contains mostly cholesterol • BAD cholesterol associated with Apoliprotein B • High levels of LDL and Apo B risk of heart disease ØHDL • Removes cholesterol out of cells • GOOD cholesterol associate with Apoliprotein A • High levels of HDL and Apo A risk of heart disease http: //dolinabiotechnologiczna. pl/diagnostyka-laboratoryjna-2/ratunku-lipemia/

§ Which of the following lipoproteins is the major carrier of cholesterol to peripheral tissues? LIPID REVIEW A) VLDL B) LDL C) HDL D) Chylomicrons § True or False: Increased levels of apolipoprotein A-I are associated with increased risk of coronary artery disease. http: //investorplace. com/2014/03/bacon-smell-oscar-mayer-aapl-stock-krft-stock/#. VT 01 CWN 8 MXk
 ØTotal cholesterol - measured ØLDL –")
§ Lipid panel includes (fasting 10 -12 hours) ØTotal cholesterol - measured ØLDL – calculated using Friedewald calculation • LDL = total cholesterol – (HDL + VLDL) • Invalid Trig > 400 mg/d. L ØHDL - measured ØTriglycerides – measured • High levels increase risk of pancreatitis § Arteriosclerosis – hardening of the arteries ØIf it affects the heart called Coronary Artery Disease http: //healthinformatics. wikispaces. com/Balloon+Angioplasty

§ Initial Cardiac Panel includes: Ø Troponin - Most specific cardiac marker • Troponin I (Tn. I) increases 4 hours normal after 6 days • Troponin T (Tn. T) increases 4 hours normal after 7 days Ø Total CK – nonspecific marker • Found in all muscle increased in rhabdo, MD Ø CK-MB (isoenzyme)– second most specific cardiac marker • Peaks in 1 day returns to normal in 2 days Ø Myoglobin – least specific marker • Sensitive rises within 1 hour returns to normal in 1 day • Early indicator • Not included on subsequent cardiac panels only initial http: //dietchoices. com/diet-plans/heart-attack-grill-diet/

§ Which of the following tests monitors inflammation levels that may contribute to acute coronary syndromes? A) hs-CRP B) Troponin I C) BNP D) Total CK HEART DISEASE REVIEW
")
§ hs. CRP – high sensitivity C-reactive protein ØMeasures inflammation related to stress (cortisol) • Increased hs. CRP = increased plaque formation § BNP – B natriuretic peptide ØIncreased in CHF

§ Elimination of waste Ø Urea • Protein degradation = ammonia =urea Ø Creatinine • Waste product of creatine • Jaffe reaction o Ketones positive interference v Falsely elevate creatinine levels Ø Uric Acid • Final product of purine metabolism • Monosodium urate crystals synovial fluid = gout o Polarized microscope § Glomerular Filtration Rate Ø 24 hour urine Creatinine Clearance = U S x V 24 V x 1. 73 SA

§ Normal Kidneys ØSerum • Normal levels of BUN and Creatinine ØUrine • Concentrated • High in BUN and Creatinine • Little to no protein § Abnormal Kidneys - Renal Failure ØSerum • High levels of BUN and Creatinine ØUrine • Dilute low specific gravity • Low in BUN and Creatinine • High in protein o Microalbuminuria – early indicator diabetic nephropathy o Renal failure will result if diabetes is not well managed http: //www. rayur. com/acute-renal-failure. html

Bishop, M. L. , Fody, E. P. , & Schoeff, L. E. (Edward P Fody MD). Clinical Chemistry: Principles, Tehcniques, and Correlations. Philadelphia: Lippincott Williams & Wilkins. Moynihan, R. , & Cassels, A. (2006). Selling Sickness: How the World’s Biggest Pharmaceutical Companies Are Turning Us All Into Patients. New York: Nation Books.
- Slides: 40