
Signals and Sampling Cis 782 Advanced Computer Graphics









- Slides: 81
Signals and Sampling Cis 782 Advanced Computer Graphics Raghu Machiraju © Machiraju/Möller
Reading • Chapter 7 of “Physically Based Rendering” by Pharr&Humphreys • Chapter 14. 10 of “CG: Principles & Practice” by Foley, van Dam et al. • Chapter 4, 5, 8, 9, 10 in “Principles of Digital Image Synthesis, ” by A. Glassner • Chapter 4, 5, 6 of “Digital Image Warping” by Wolberg • Chapter 2, 4 of “Discrete-Time Signal Processing” by Oppenheim, Shafer © Machiraju/Möller
Motivation • Real World - continuous • Digital (Computer) world - discrete • Typically we have to either: – create discrete data from continuous or (e. g. rendering/ray-tracing, illumination models, morphing) – manipulate discrete data (textures, surface description, image processing, tone mapping) © Machiraju/Möller
Motivation • Artifacts occurring in sampling - aliasing: – Jaggies – Moire – Flickering small objects – Sparkling highlights – Temporal strobing • Preventing these artifacts - Antialiasing © Machiraju/Möller
Motivation- Graphics Original (continuous) signal Reconstruction filter “Graphics” sampled signal © Machiraju/Möller “manipulated” (continuous) signal sampling
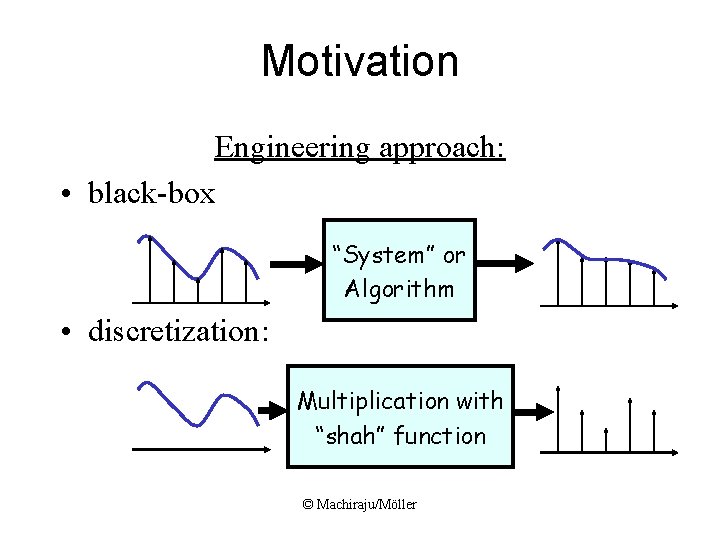
Motivation Engineering approach: • black-box “System” or Algorithm • discretization: Multiplication with “shah” function © Machiraju/Möller
Convolution • How can we characterize our “black box”? • We assume to have a “nice” box/algorithm: – linear – time-invariant • then it can be characterized through the response to an “impulse”: “System” or Algorithm © Machiraju/Möller
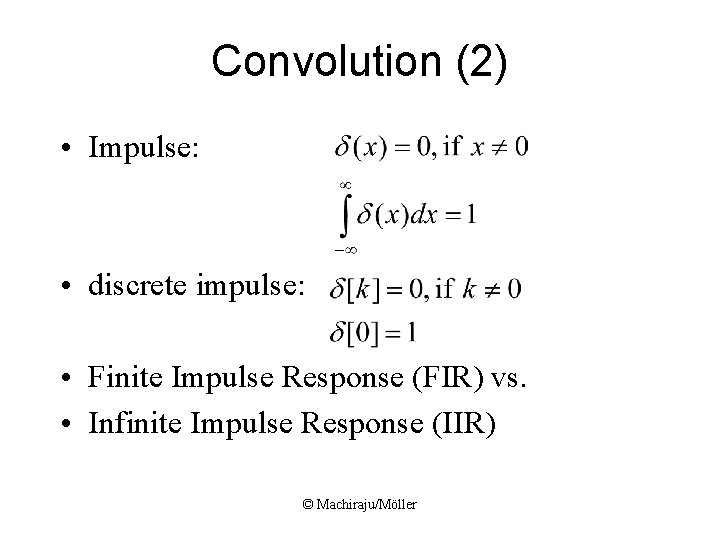
Convolution (2) • Impulse: • discrete impulse: • Finite Impulse Response (FIR) vs. • Infinite Impulse Response (IIR) © Machiraju/Möller
Convolution (3) • An arbitrary signal x[k] can be written as: • Let the impulse response be h[k]: d[k] “System” or Algorithm © Machiraju/Möller h[k]
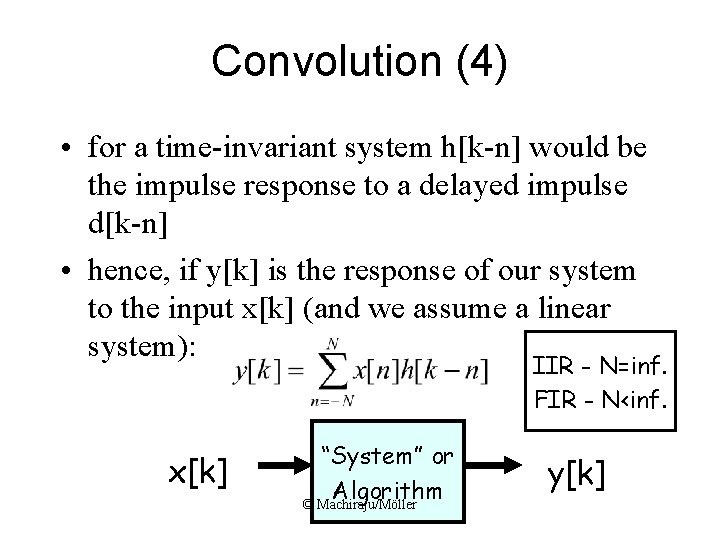
Convolution (4) • for a time-invariant system h[k-n] would be the impulse response to a delayed impulse d[k-n] • hence, if y[k] is the response of our system to the input x[k] (and we assume a linear system): IIR - N=inf. FIR - N<inf. x[k] “System” or Algorithm © Machiraju/Möller y[k]
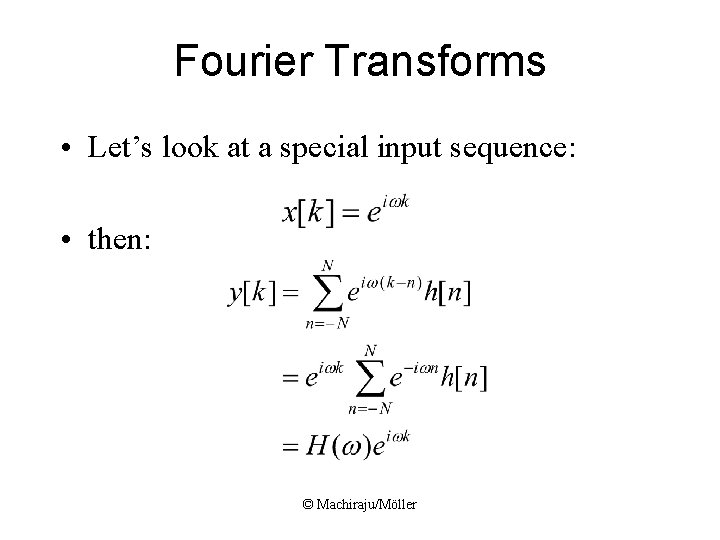
Fourier Transforms • Let’s look at a special input sequence: • then: © Machiraju/Möller
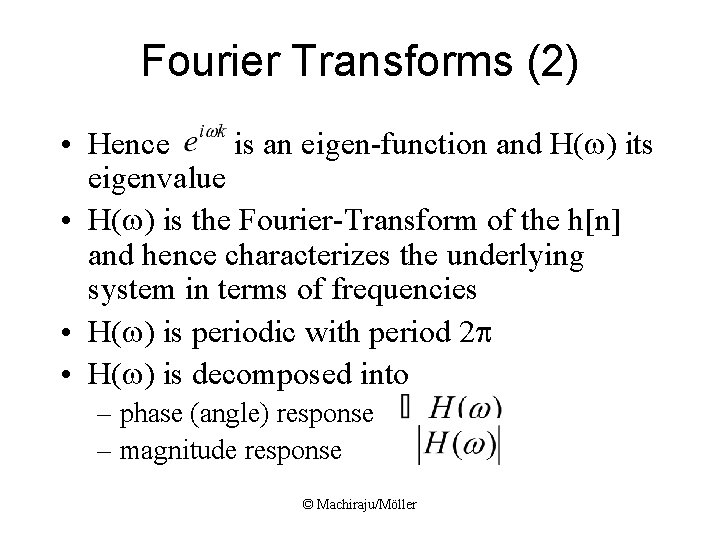
Fourier Transforms (2) • Hence is an eigen-function and H(w) its eigenvalue • H(w) is the Fourier-Transform of the h[n] and hence characterizes the underlying system in terms of frequencies • H(w) is periodic with period 2 p • H(w) is decomposed into – phase (angle) response – magnitude response © Machiraju/Möller
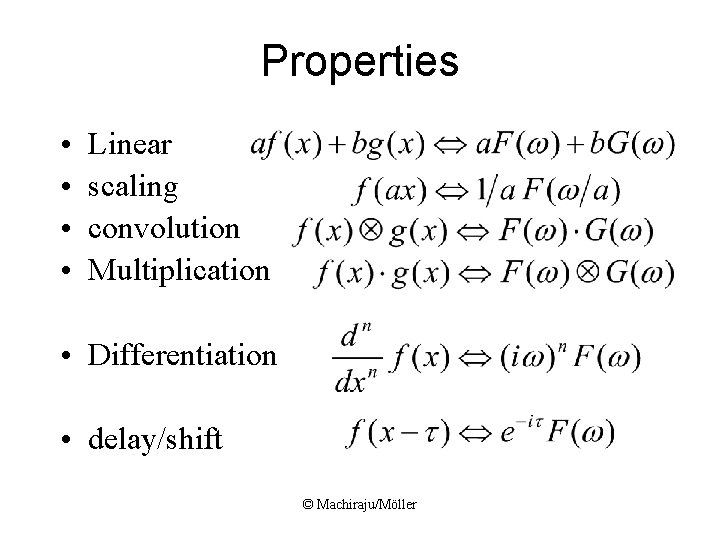
Properties • • Linear scaling convolution Multiplication • Differentiation • delay/shift © Machiraju/Möller
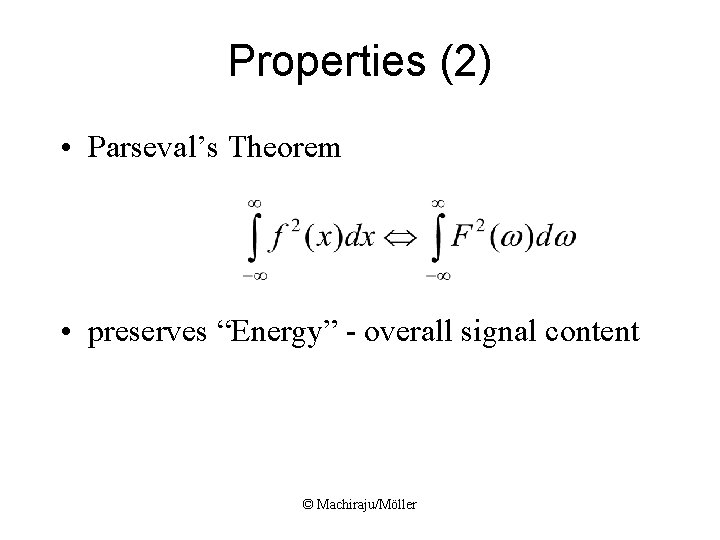
Properties (2) • Parseval’s Theorem • preserves “Energy” - overall signal content © Machiraju/Möller
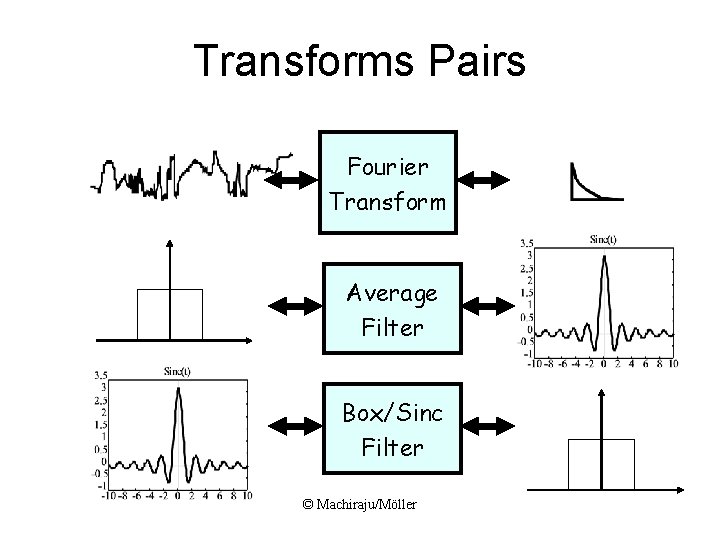
Transforms Pairs Fourier Transform Average Filter Box/Sinc Filter © Machiraju/Möller
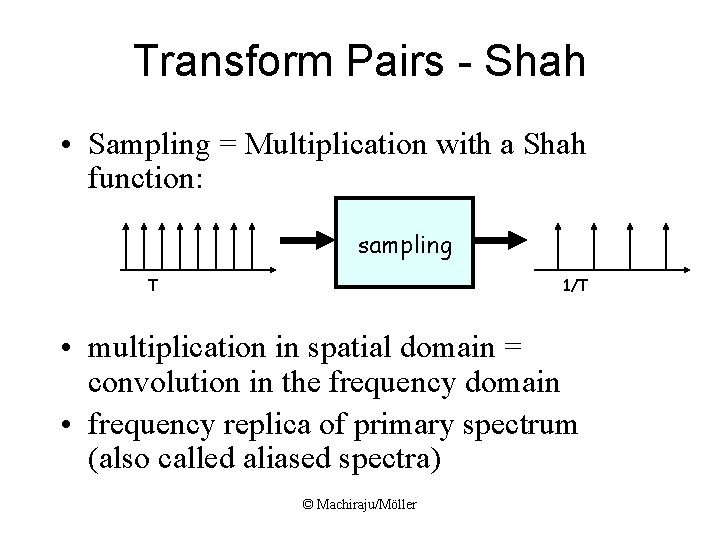
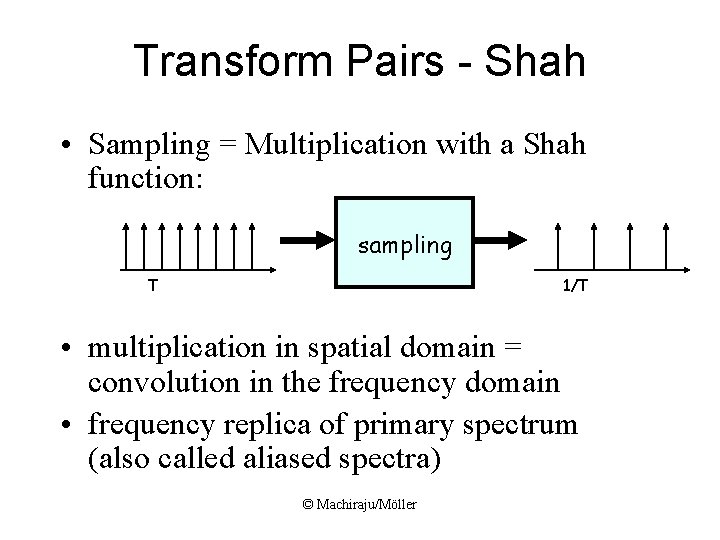
Transform Pairs - Shah • Sampling = Multiplication with a Shah function: sampling T 1/T • multiplication in spatial domain = convolution in the frequency domain • frequency replica of primary spectrum (also called aliased spectra) © Machiraju/Möller
Transform Pairs - Shah • Sampling = Multiplication with a Shah function: sampling T 1/T • multiplication in spatial domain = convolution in the frequency domain • frequency replica of primary spectrum (also called aliased spectra) © Machiraju/Möller
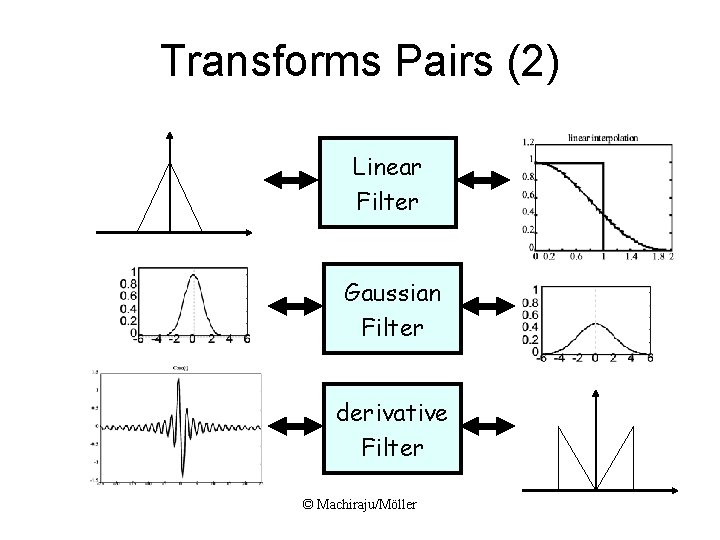
Transforms Pairs (2) Linear Filter Gaussian Filter derivative Filter © Machiraju/Möller
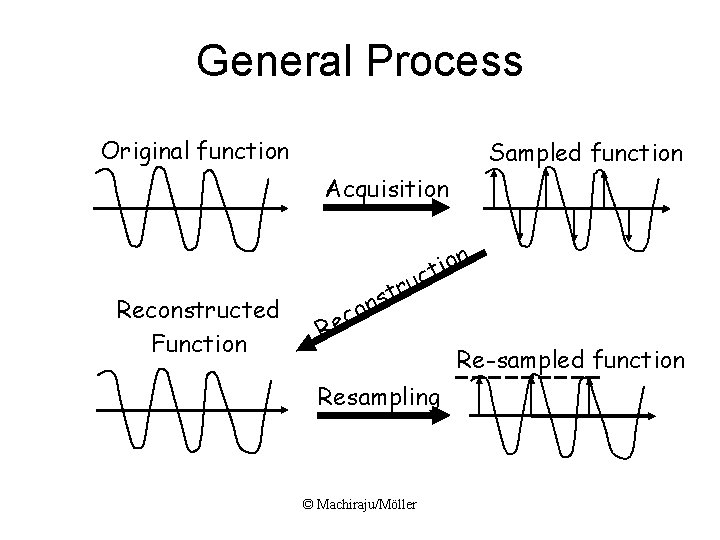
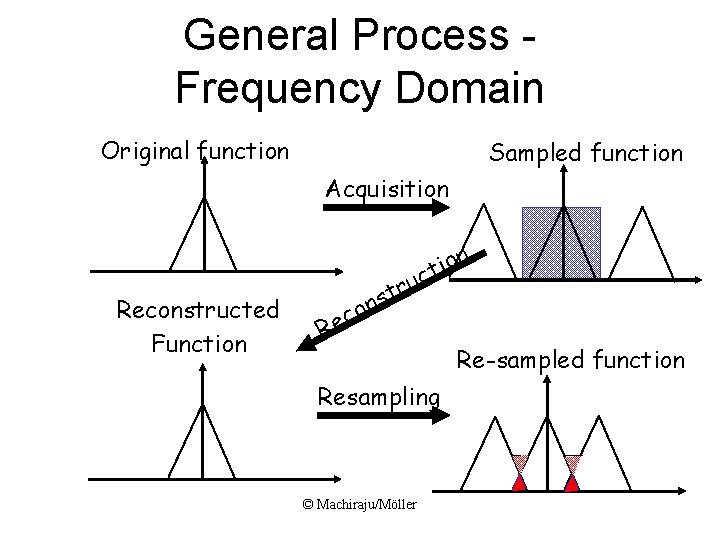
General Process Original function Sampled function Acquisition Reconstructed Function on i t uc r t s on c Re Resampling © Machiraju/Möller Re-sampled function
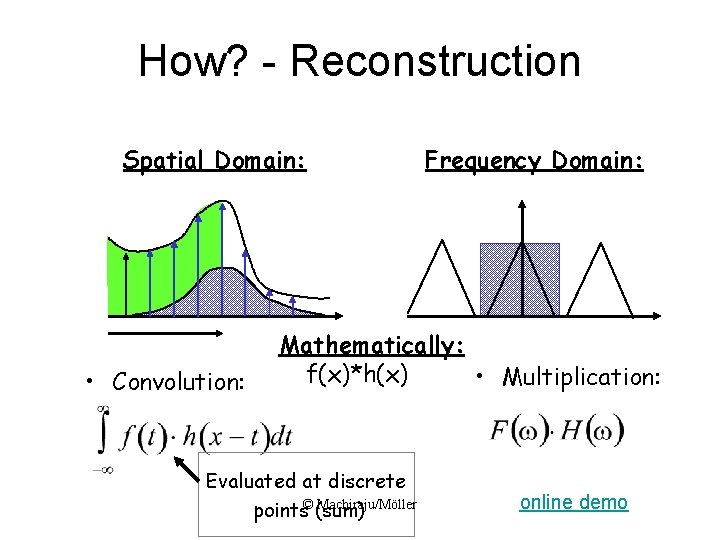
How? - Reconstruction Spatial Domain: • Convolution: Frequency Domain: Mathematically: f(x)*h(x) • Multiplication: Evaluated at discrete Machiraju/Möller points© (sum) online demo
Sampling Theorem • A signal can be reconstructed from its samples without loss of information if the original signal has no frequencies above 1/2 of the sampling frequency • For a given bandlimited function, the rate at which it must be sampled is called the Nyquist frequency © Machiraju/Möller
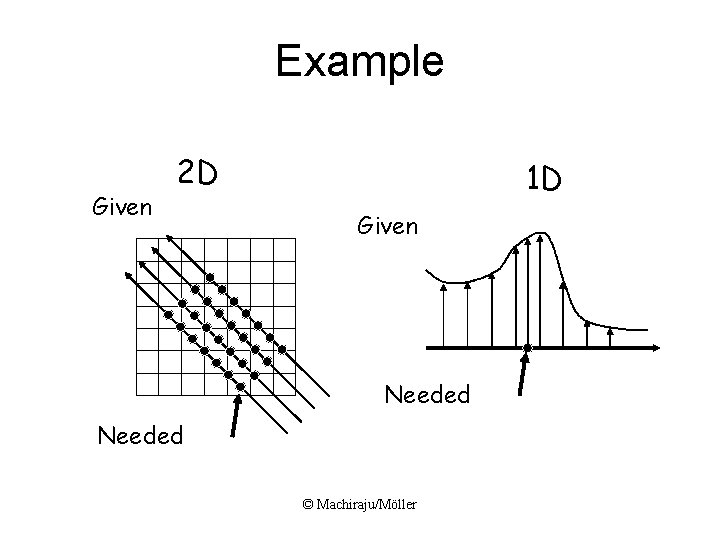
Example Given 2 D 1 D Given Needed © Machiraju/Möller
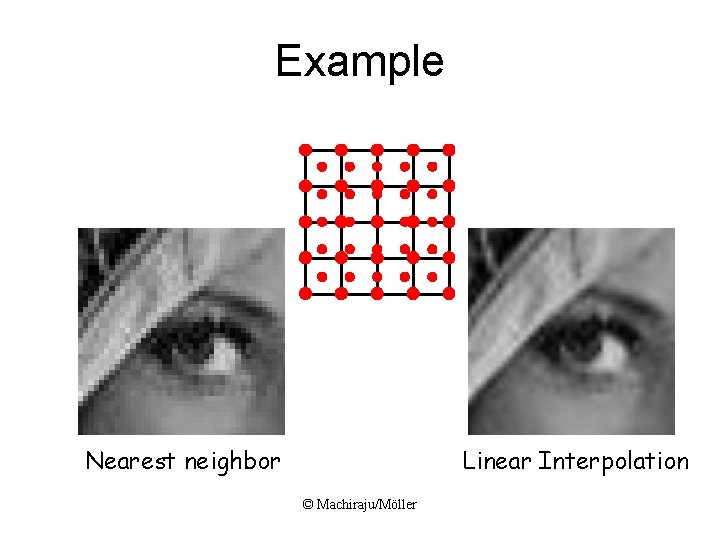
Example Nearest neighbor Linear Interpolation © Machiraju/Möller
General Process Frequency Domain Original function Sampled function Acquisition Reconstructed Function on i t uc r t s on c Re Resampling © Machiraju/Möller Re-sampled function
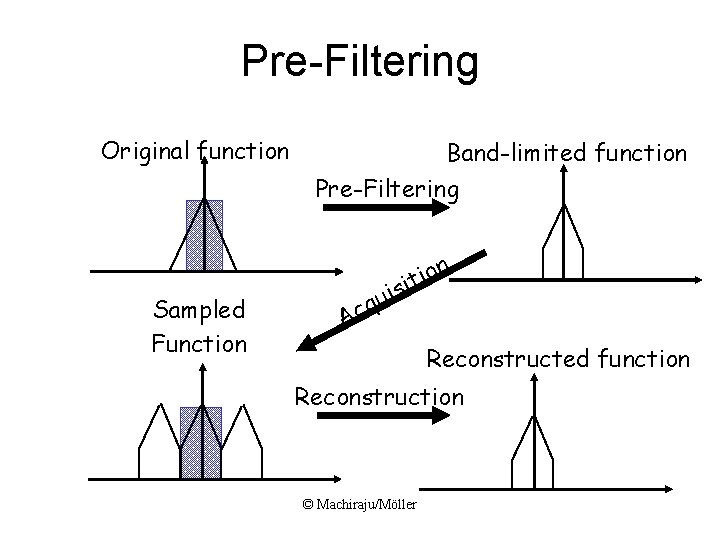
Pre-Filtering Original function Sampled Function Band-limited function Pre-Filtering n o i it s i u q Ac Reconstructed function Reconstruction © Machiraju/Möller
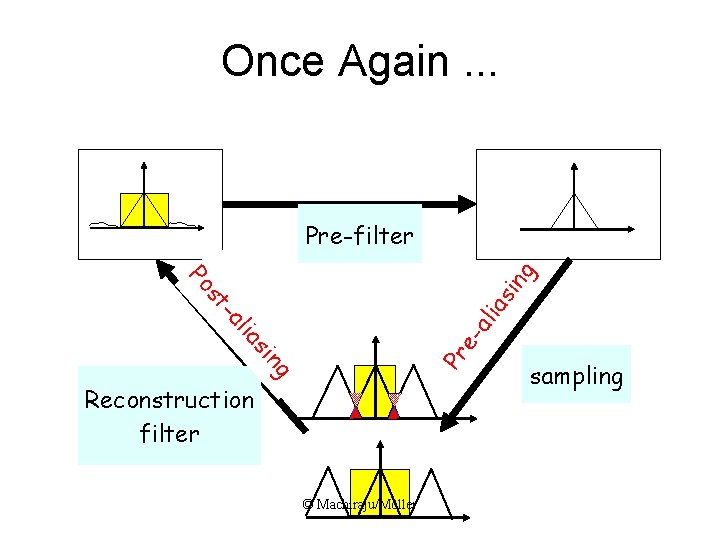
Once Again. . . ng Pr si e- lia ali as -a st Po ing Pre-filter Reconstruction filter © Machiraju/Möller sampling
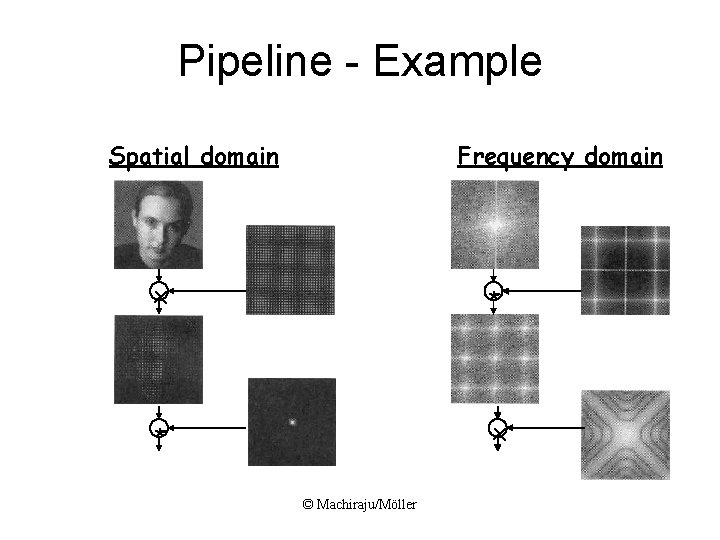
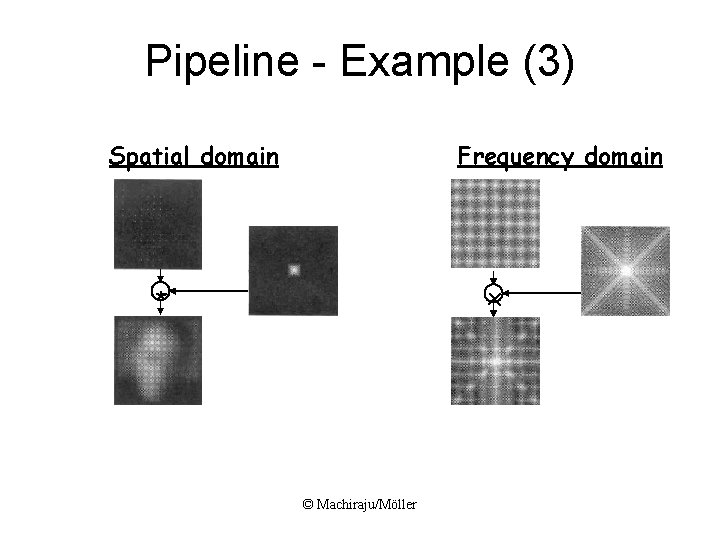
Pipeline - Example Spatial domain Frequency domain x * * x © Machiraju/Möller
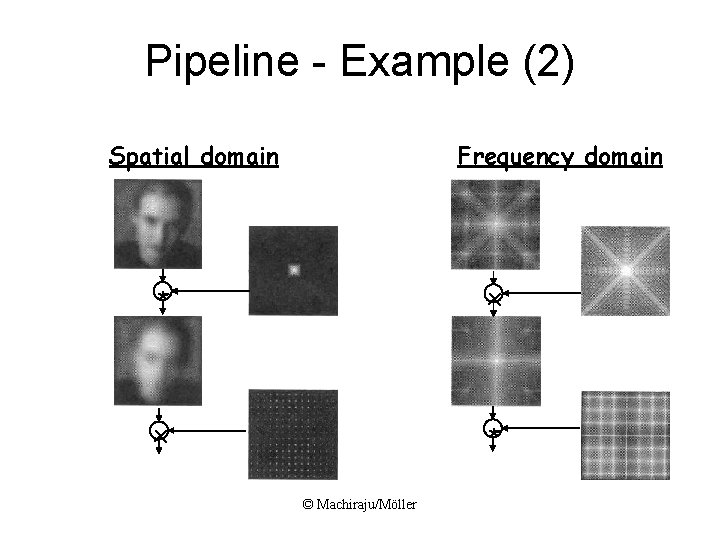
Pipeline - Example (2) Spatial domain Frequency domain * x x * © Machiraju/Möller
Pipeline - Example (3) Spatial domain Frequency domain x * © Machiraju/Möller
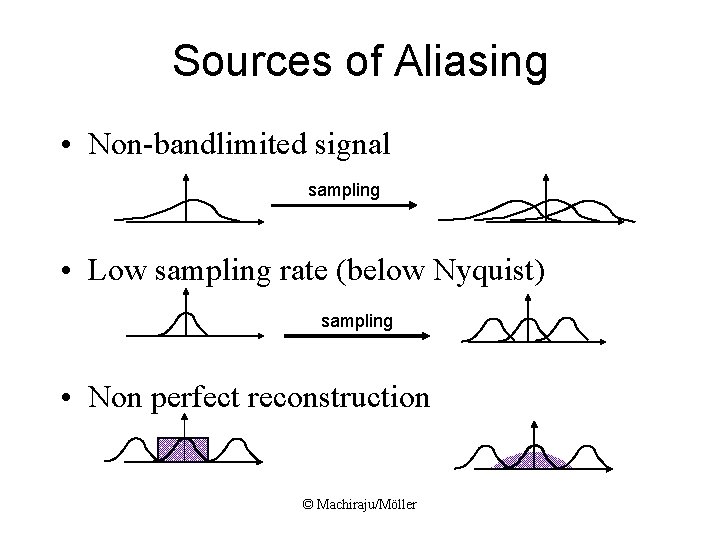
Sources of Aliasing • Non-bandlimited signal sampling • Low sampling rate (below Nyquist) sampling • Non perfect reconstruction © Machiraju/Möller
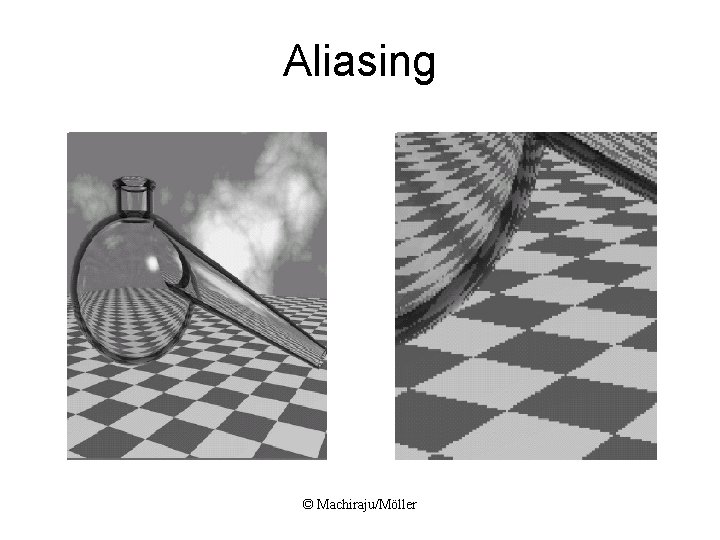
Aliasing © Machiraju/Möller
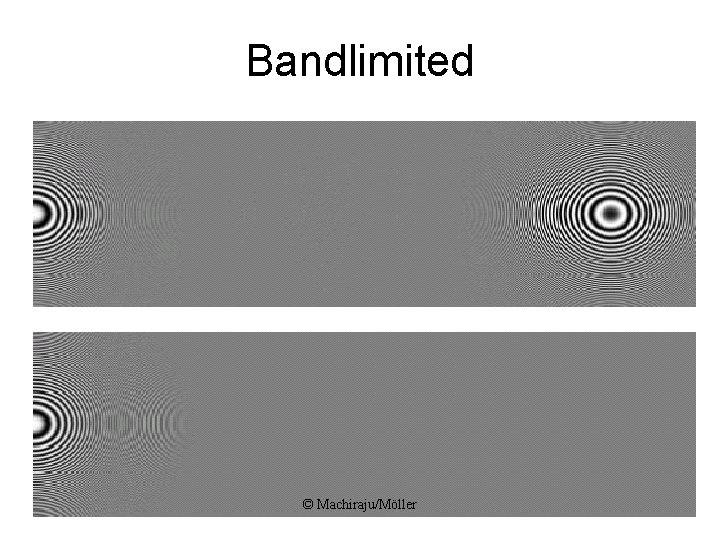
Bandlimited © Machiraju/Möller
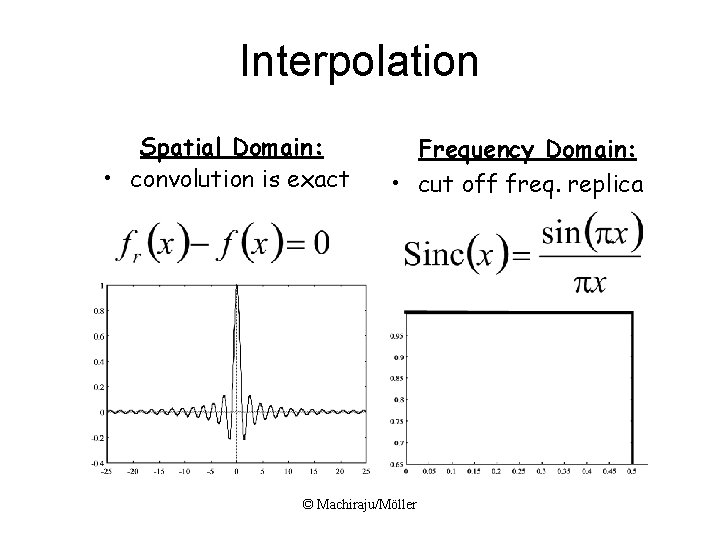
Interpolation Spatial Domain: • convolution is exact Frequency Domain: • cut off freq. replica © Machiraju/Möller
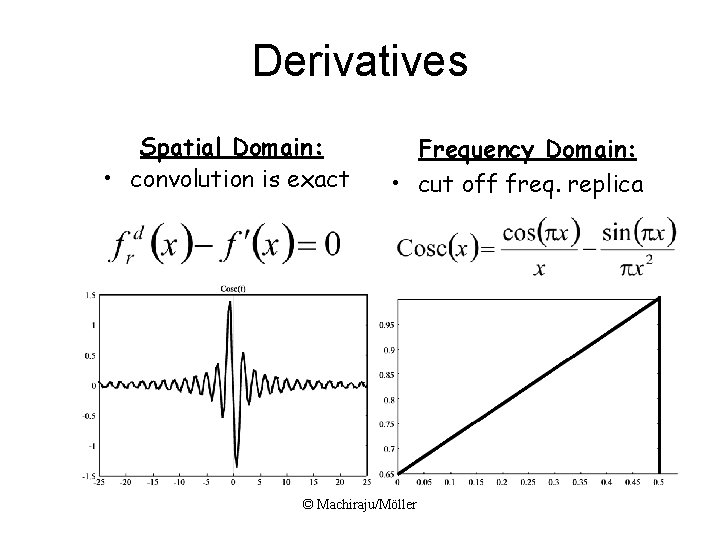
Derivatives Spatial Domain: • convolution is exact Frequency Domain: • cut off freq. replica © Machiraju/Möller
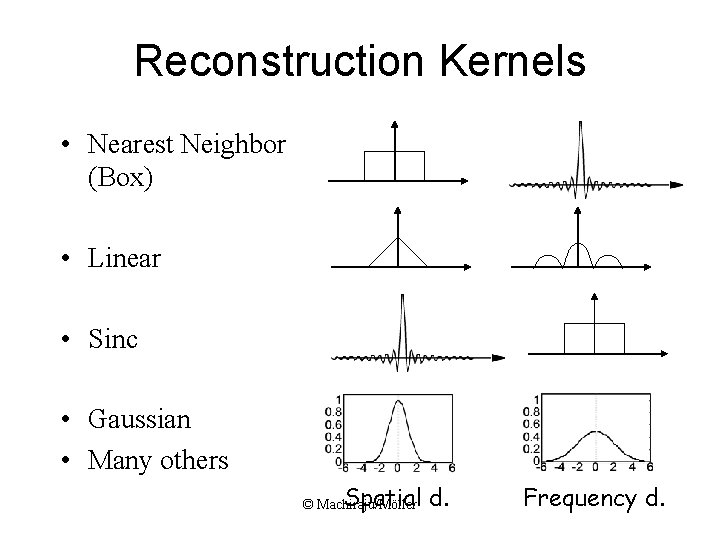
Reconstruction Kernels • Nearest Neighbor (Box) • Linear • Sinc • Gaussian • Many others Spatial d. © Machiraju/Möller Frequency d.
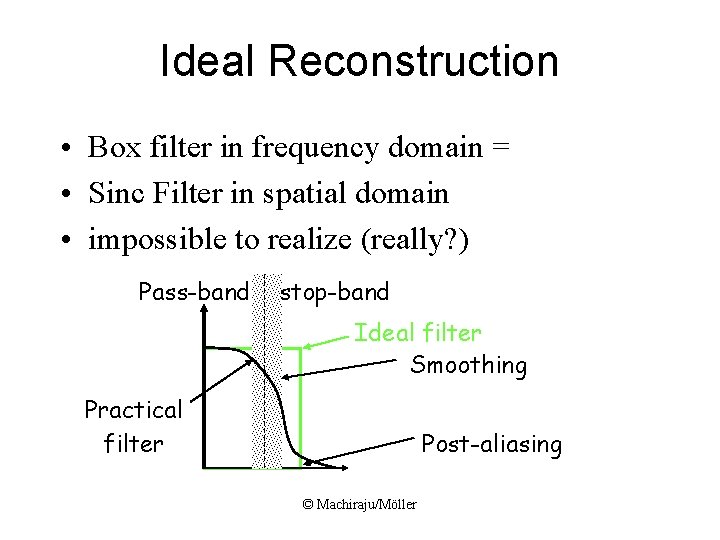
Ideal Reconstruction • Box filter in frequency domain = • Sinc Filter in spatial domain • impossible to realize (really? ) Pass-band stop-band Ideal filter Smoothing Practical filter Post-aliasing © Machiraju/Möller
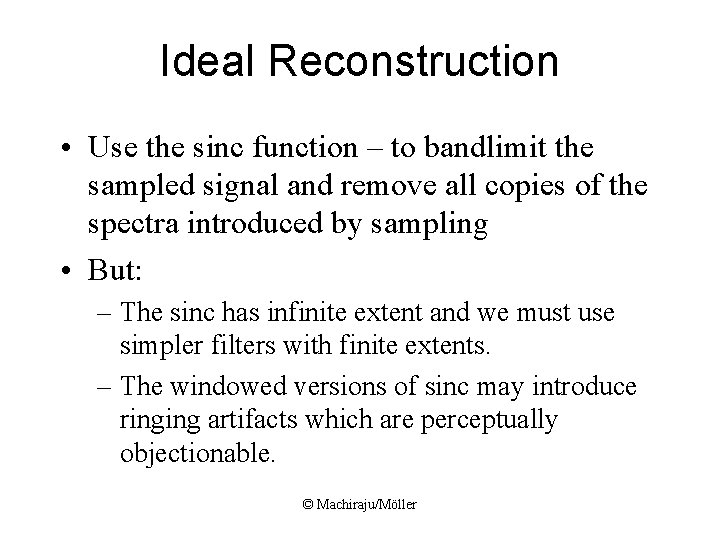
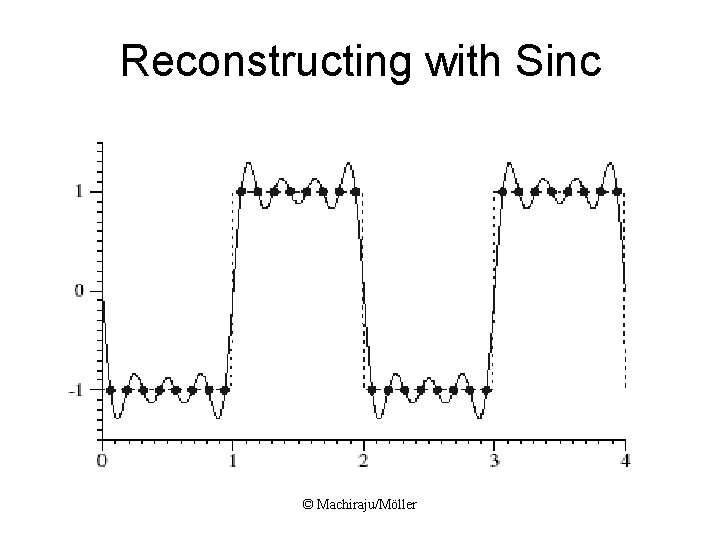
Ideal Reconstruction • Use the sinc function – to bandlimit the sampled signal and remove all copies of the spectra introduced by sampling • But: – The sinc has infinite extent and we must use simpler filters with finite extents. – The windowed versions of sinc may introduce ringing artifacts which are perceptually objectionable. © Machiraju/Möller
Reconstructing with Sinc © Machiraju/Möller
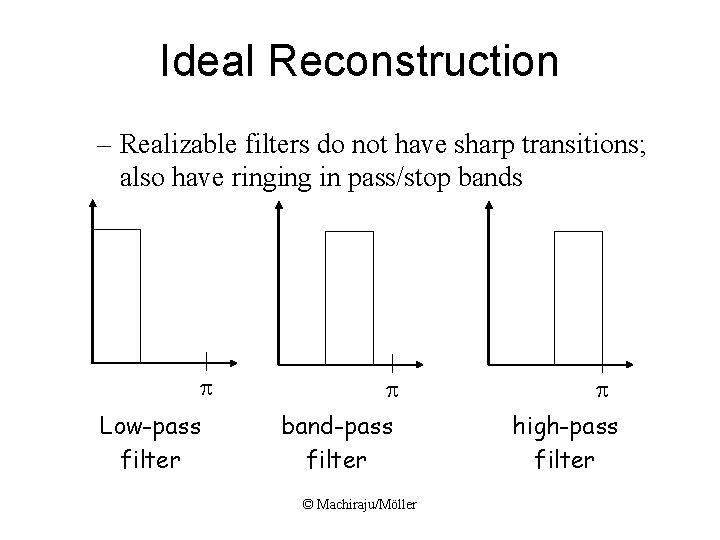
Ideal Reconstruction – Realizable filters do not have sharp transitions; also have ringing in pass/stop bands p Low-pass filter p band-pass filter © Machiraju/Möller p high-pass filter
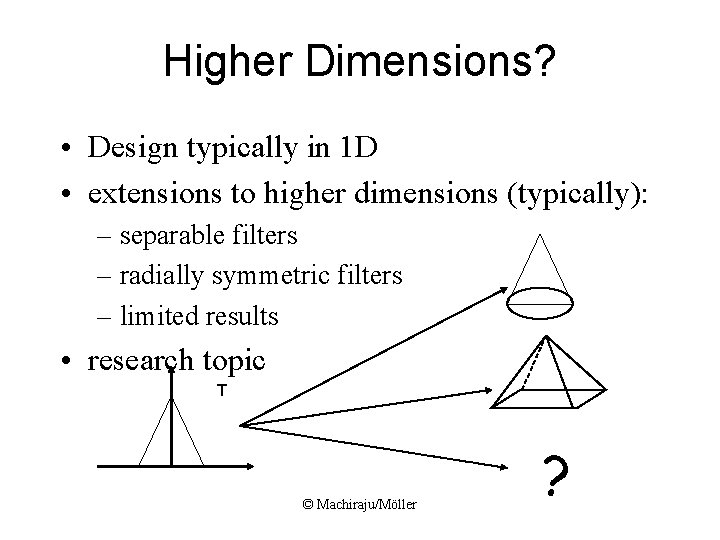
Higher Dimensions? • Design typically in 1 D • extensions to higher dimensions (typically): – separable filters – radially symmetric filters – limited results • research topic T © Machiraju/Möller ?
Possible Errors • Post-aliasing – reconstruction filter passes frequencies beyond the Nyquist frequency (of duplicated frequency spectrum) => frequency components of the original signal appear in the reconstructed signal at different frequencies • Smoothing – frequencies below the Nyquist frequency are attenuated • Ringing (overshoot) – occurs when trying to sample/reconstruct discontinuity • Anisotropy – caused by not spherically symmetric filters © Machiraju/Möller
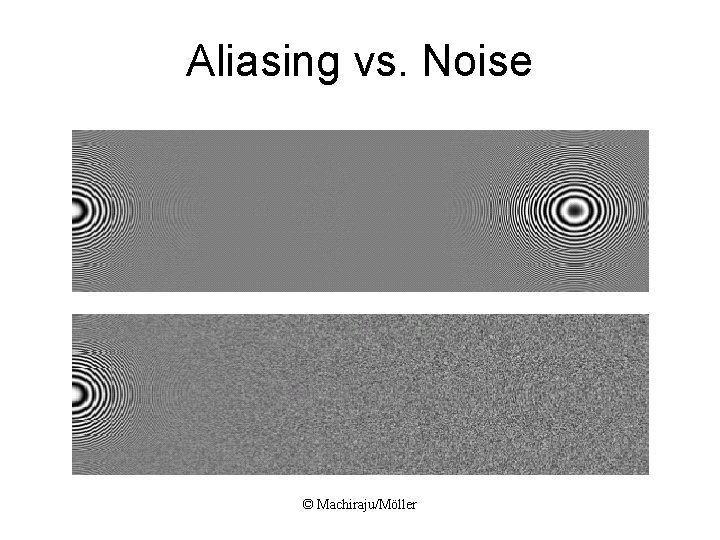
Aliasing vs. Noise © Machiraju/Möller
Antialiasing • Antialiasing = Preventing aliasing • 1. Analytically pre-filter the signal – Solvable for points, lines and polygons – Not solvable in general (e. g. procedurally defined images) • 2. Uniform supersampling and resample • 3. Nonuniform or stochastic sampling © Machiraju/Möller
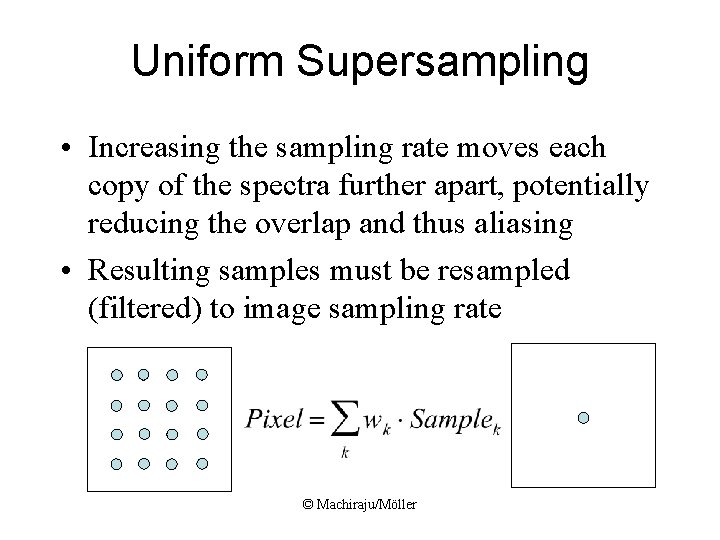
Uniform Supersampling • Increasing the sampling rate moves each copy of the spectra further apart, potentially reducing the overlap and thus aliasing • Resulting samples must be resampled (filtered) to image sampling rate © Machiraju/Möller
Distribution of Extrafoveal Cones • Yellot theory (1983) – Aliases replaced by noise – Visual system less sensitive to high freq noise Monkey eye cone distribution © Machiraju/Möller Fourier Transform
Non-Uniform Sampling Intuition • Uniform sampling – The spectrum of uniformly spaced samples is also a set of uniformly spaced spikes – Multiplying the signal by the sampling pattern corresponds to placing a copy of the spectrum at each spike (in freq. space) – Aliases are coherent, and very noticeable • Non-uniform sampling – Samples at non-uniform locations have a different spectrum; a single spike plus noise – Sampling a signal in this way converts aliases into broadband noise – Noise is incoherent, © and much less objectionable Machiraju/Möller
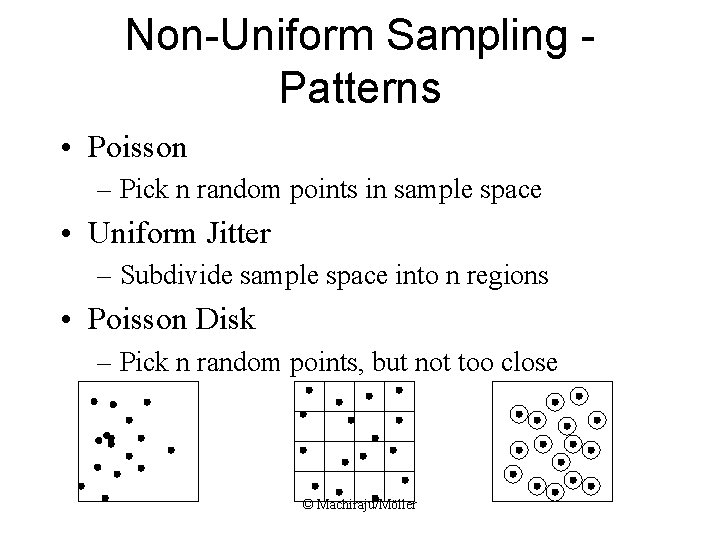
Non-Uniform Sampling Patterns • Poisson – Pick n random points in sample space • Uniform Jitter – Subdivide sample space into n regions • Poisson Disk – Pick n random points, but not too close © Machiraju/Möller
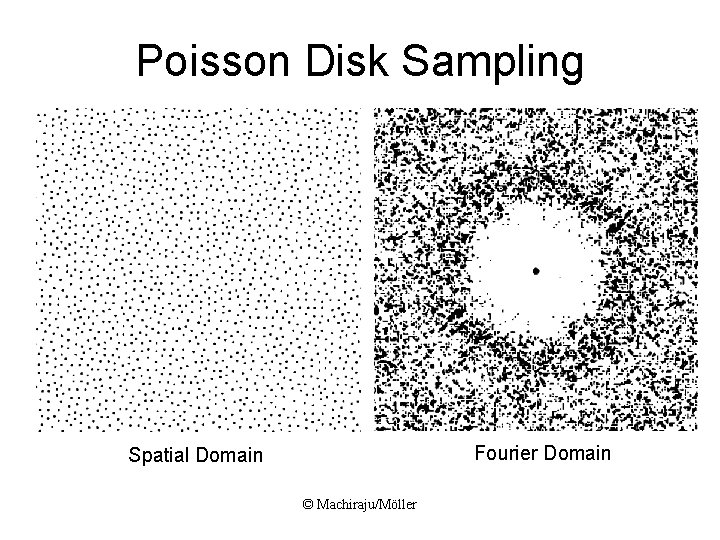
Poisson Disk Sampling Fourier Domain Spatial Domain © Machiraju/Möller
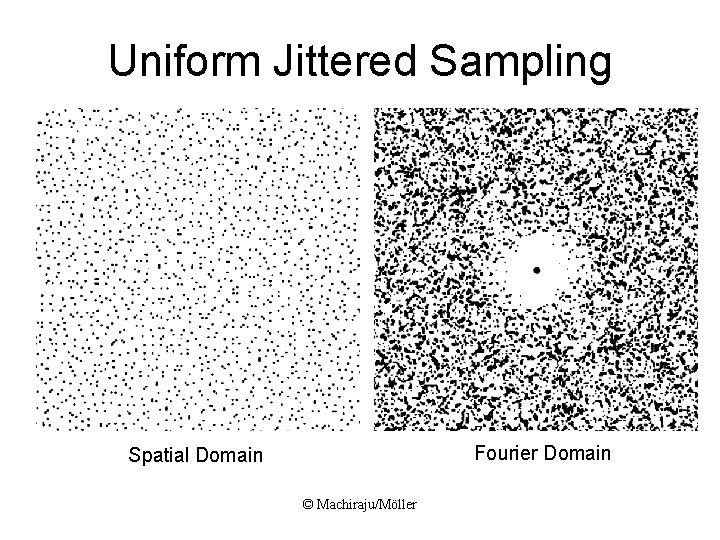
Uniform Jittered Sampling Fourier Domain Spatial Domain © Machiraju/Möller
Non-Uniform Sampling Patterns • Spectral characteristics of these distributions: – Poisson: completely uniform (white noise). High and low frequencies equally present – Poisson disc: Pulse at origin (DC component of image), surrounded by empty ring (no low frequencies), surrounded by white noise – Jitter: Approximates Poisson disc spectrum, but with a smaller empty disc. © Machiraju/Möller
Stratified Sampling • Put at least one sample in each strata • Multiple samples in strata do no good • Also have samples far away from each other • Graphics: jittering © Machiraju/Möller
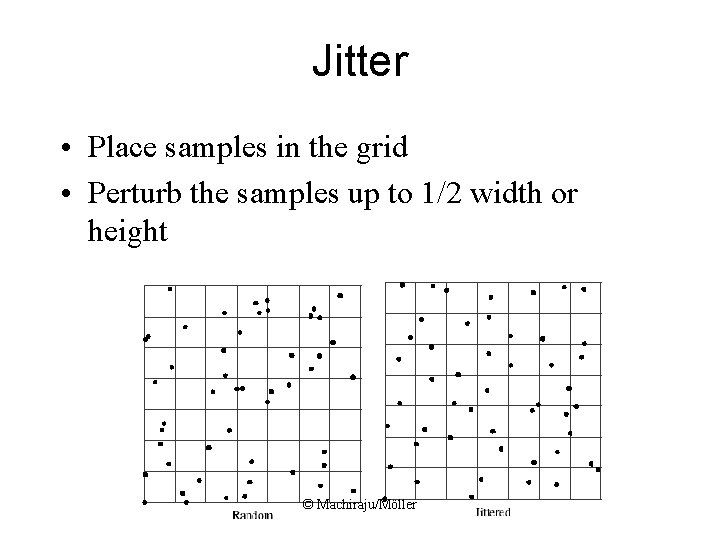
Jitter • Place samples in the grid • Perturb the samples up to 1/2 width or height © Machiraju/Möller
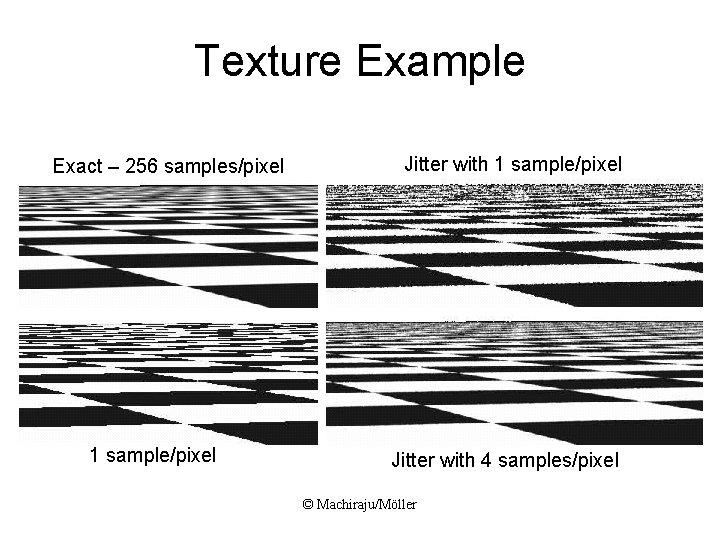
Texture Example Exact – 256 samples/pixel 1 sample/pixel Jitter with 4 samples/pixel © Machiraju/Möller
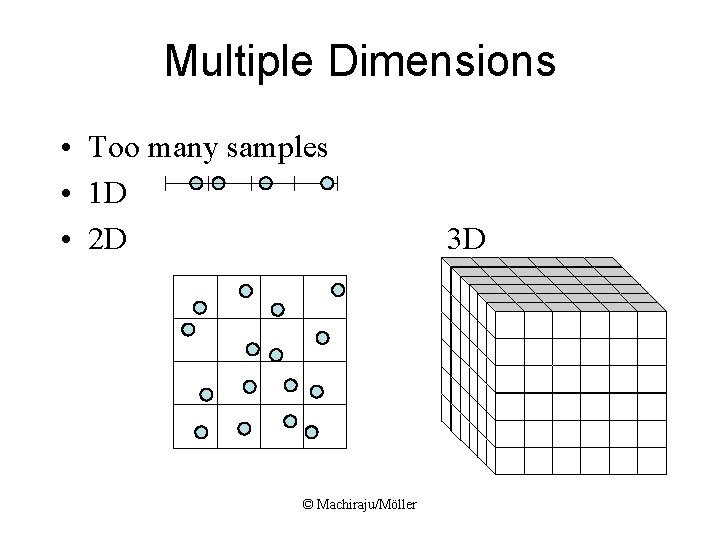
Multiple Dimensions • Too many samples • 1 D • 2 D © Machiraju/Möller 3 D
Jitter Problems • How to deal with higher dimensions? – Curse of dimensionality – D dimensions means ND “cells” (if we use a separable extension) • Solutions: – We can look at each dimension independently – We can either look in non-separable geometries – Latin Hypercube (or N-Rook) sampling © Machiraju/Möller
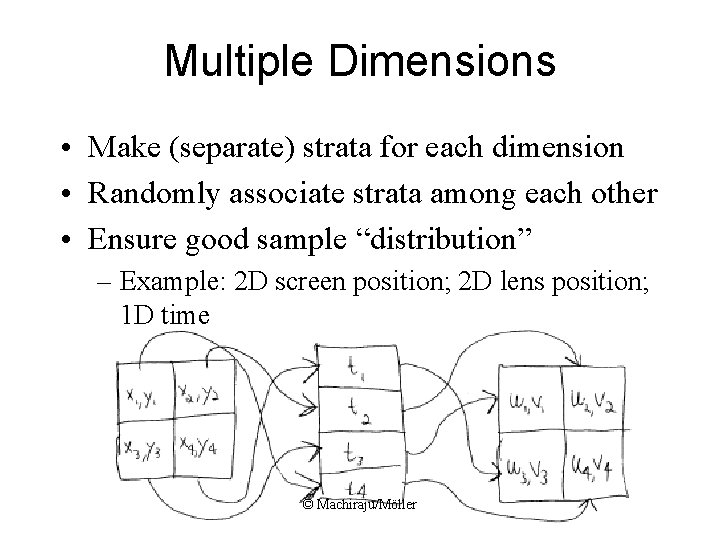
Multiple Dimensions • Make (separate) strata for each dimension • Randomly associate strata among each other • Ensure good sample “distribution” – Example: 2 D screen position; 2 D lens position; 1 D time © Machiraju/Möller
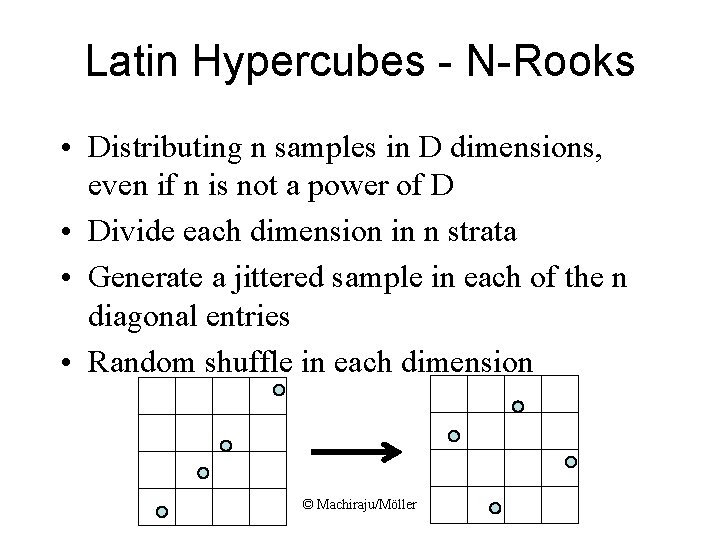
Latin Hypercubes - N-Rooks • Distributing n samples in D dimensions, even if n is not a power of D • Divide each dimension in n strata • Generate a jittered sample in each of the n diagonal entries • Random shuffle in each dimension © Machiraju/Möller
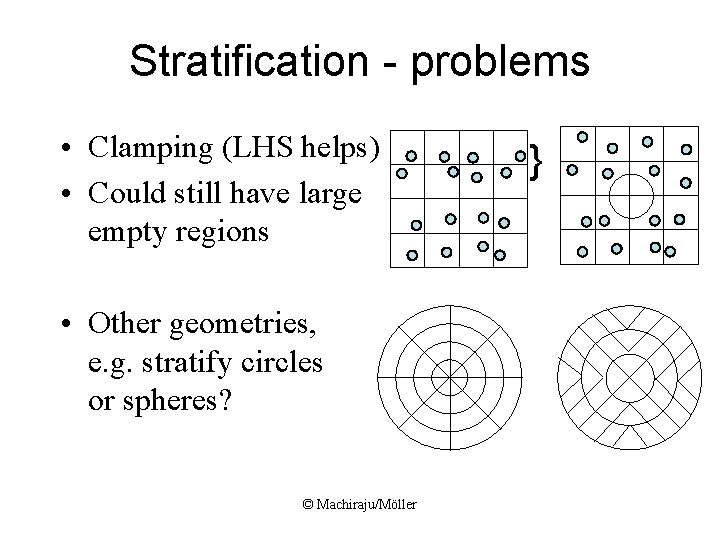
Stratification - problems • Clamping (LHS helps) • Could still have large empty regions • Other geometries, e. g. stratify circles or spheres? © Machiraju/Möller }
How good are the samples ? • How can we evaluate how well our samples are distributed? – No “holes” – No clamping • Well distributed patterns have low discrepancy – Small = evenly distributed – Large = clustering • Construct low discrepancy sequence © Machiraju/Möller
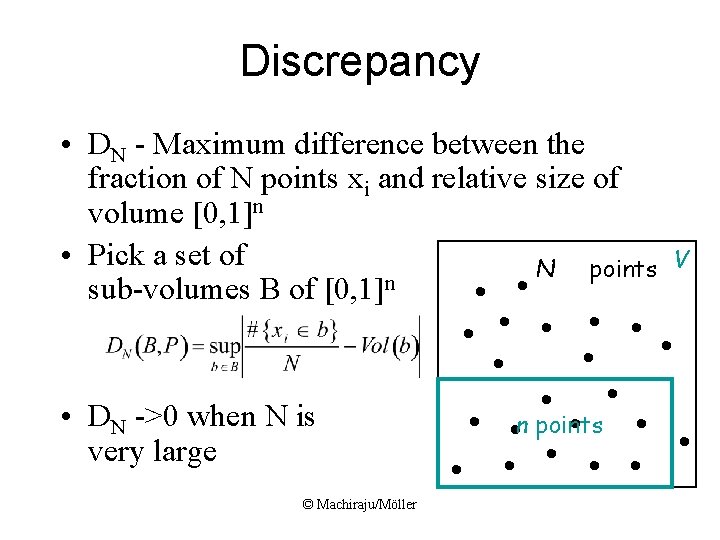
Discrepancy • DN - Maximum difference between the fraction of N points xi and relative size of volume [0, 1]n • Pick a set of N points n sub-volumes B of [0, 1] • DN ->0 when N is very large © Machiraju/Möller n points V
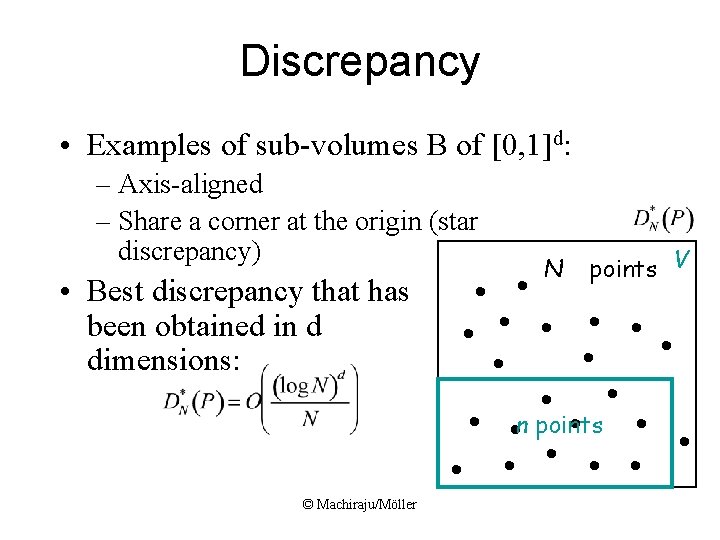
Discrepancy • Examples of sub-volumes B of [0, 1]d: – Axis-aligned – Share a corner at the origin (star discrepancy) • Best discrepancy that has been obtained in d dimensions: © Machiraju/Möller N points V n points
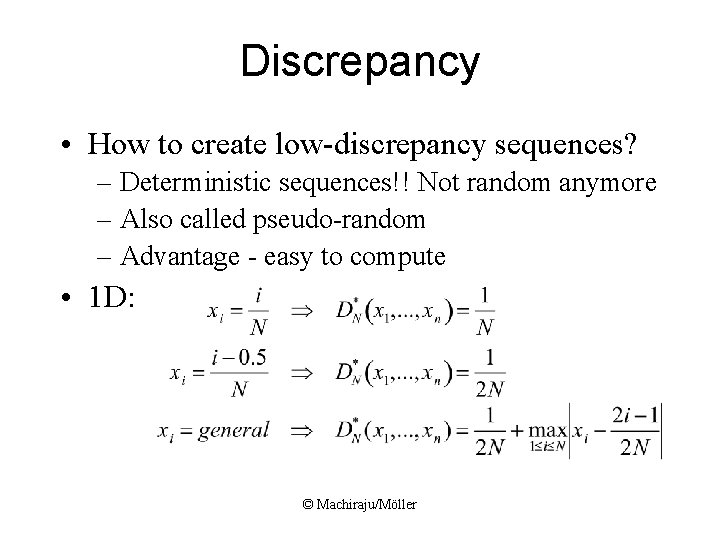
Discrepancy • How to create low-discrepancy sequences? – Deterministic sequences!! Not random anymore – Also called pseudo-random – Advantage - easy to compute • 1 D: © Machiraju/Möller
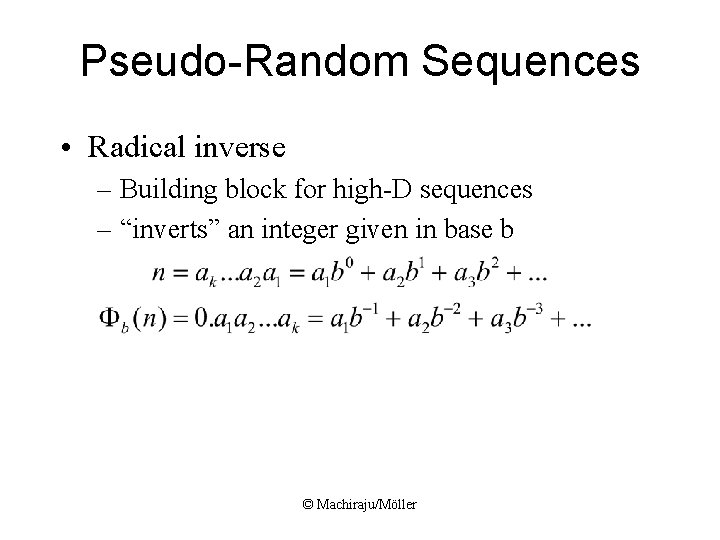
Pseudo-Random Sequences • Radical inverse – Building block for high-D sequences – “inverts” an integer given in base b © Machiraju/Möller
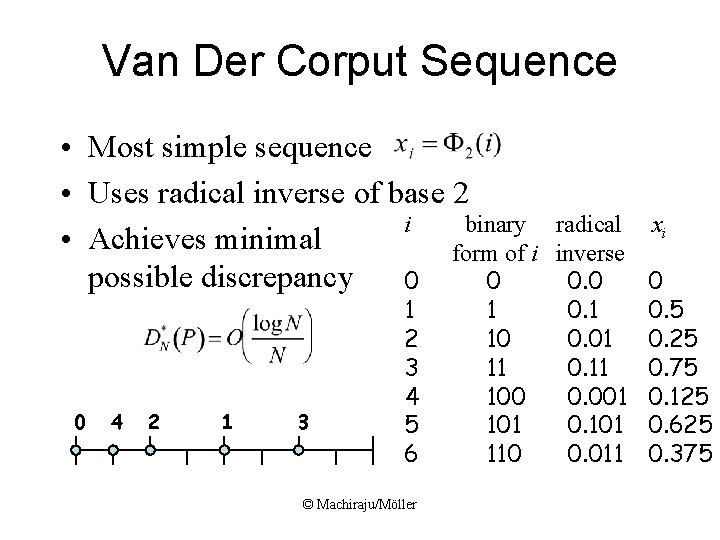
Van Der Corput Sequence • Most simple sequence • Uses radical inverse of base 2 i binary • Achieves minimal form of i possible discrepancy 0 0 0 4 2 1 3 1 2 3 4 5 6 © Machiraju/Möller 1 10 11 100 101 110 radical inverse 0. 0 0. 1 0. 01 0. 11 0. 001 0. 101 0. 011 xi 0 0. 5 0. 25 0. 75 0. 125 0. 625 0. 375
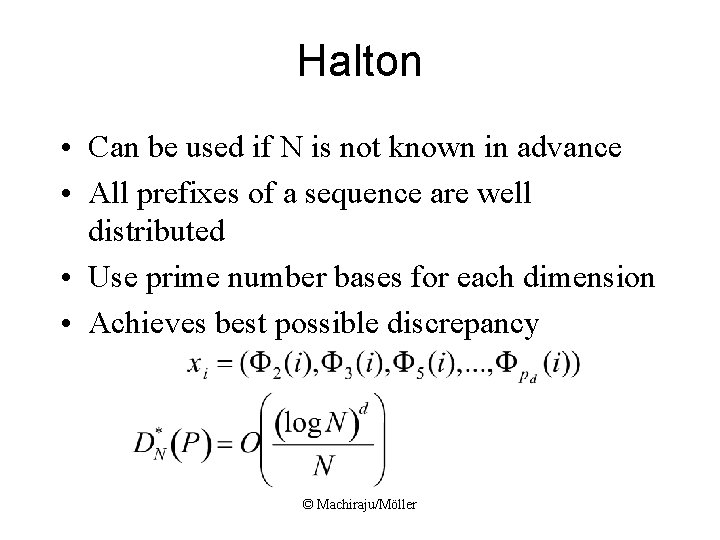
Halton • Can be used if N is not known in advance • All prefixes of a sequence are well distributed • Use prime number bases for each dimension • Achieves best possible discrepancy © Machiraju/Möller
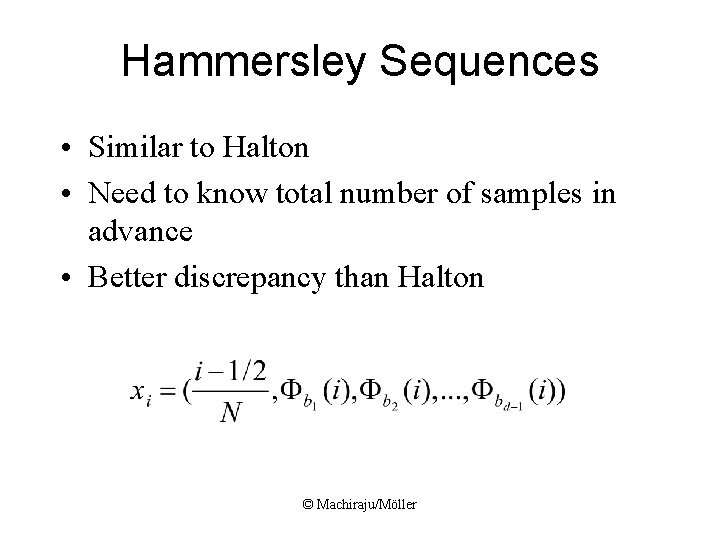
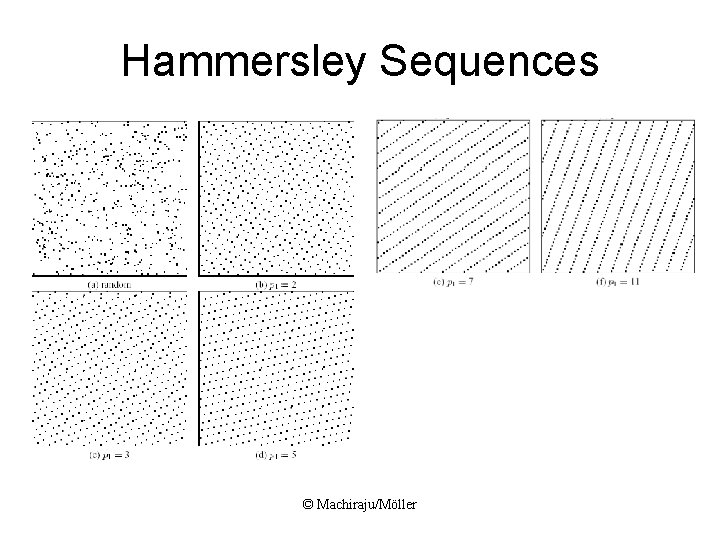
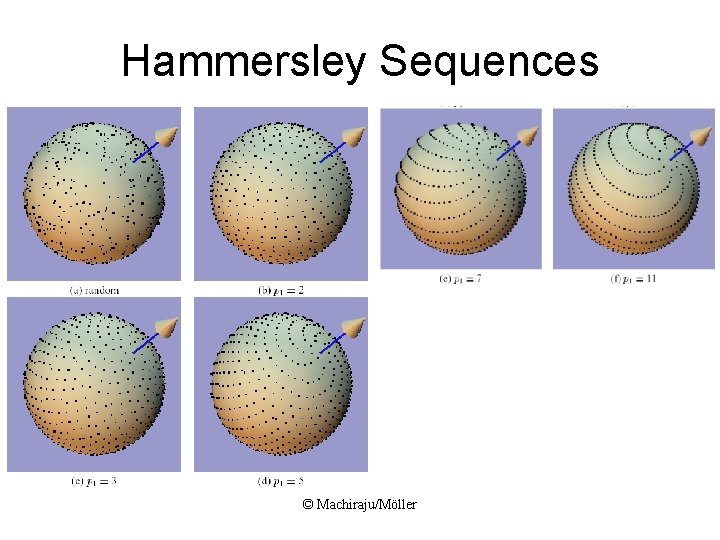
Hammersley Sequences • Similar to Halton • Need to know total number of samples in advance • Better discrepancy than Halton © Machiraju/Möller
Hammersley Sequences © Machiraju/Möller
Hammersley Sequences © Machiraju/Möller
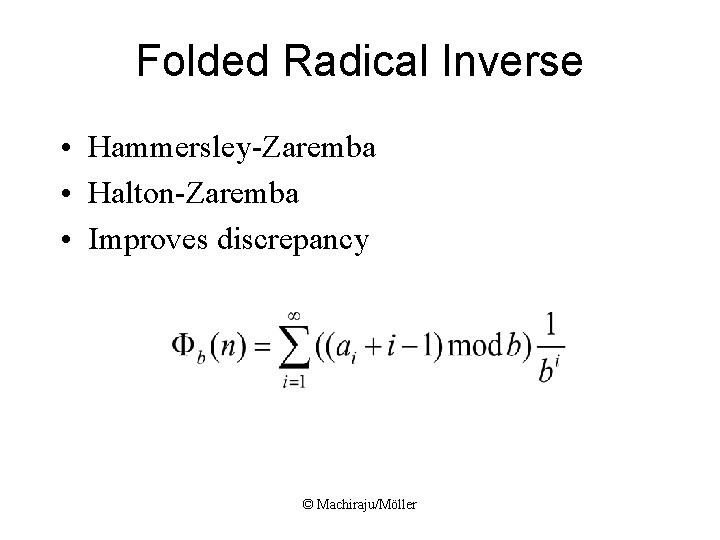
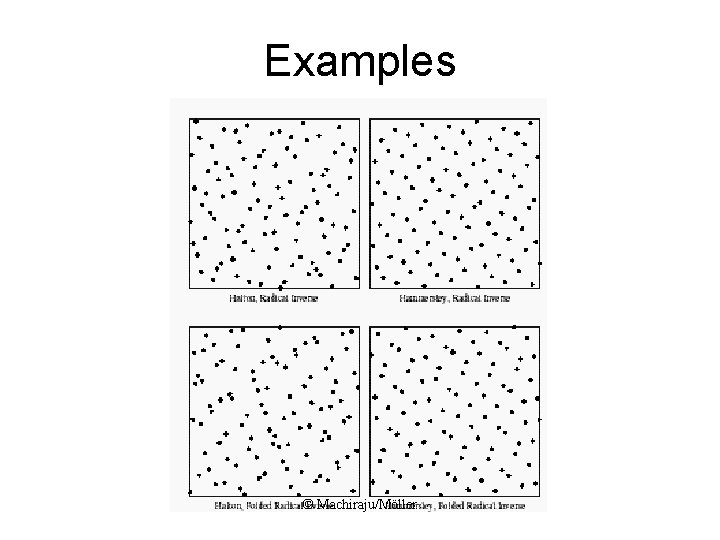
Folded Radical Inverse • Hammersley-Zaremba • Halton-Zaremba • Improves discrepancy © Machiraju/Möller
Examples © Machiraju/Möller
(t, m, d) nets • The most successful constructions of lowdiscrepancy sequences are based on (t, m, d)nets and (t, d)-sequences. • Basis b; • Is a point set in [0, 1]d consisting of bm points, such that every box of volume bt-m contains bt points © Machiraju/Möller
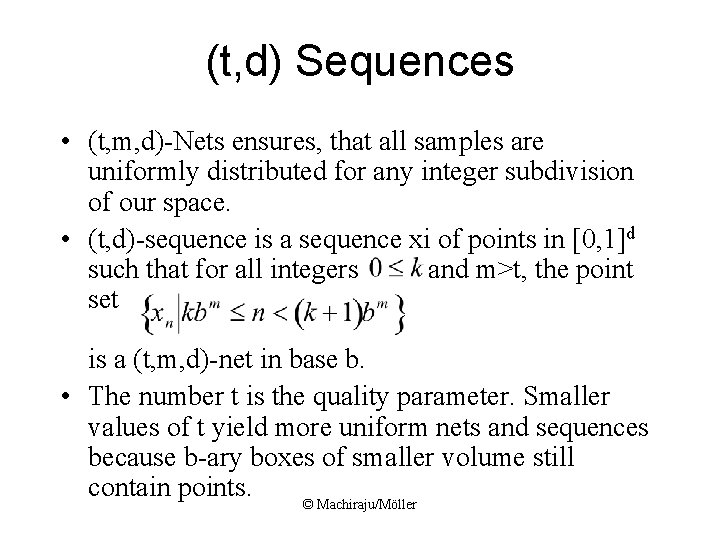
(t, d) Sequences • (t, m, d)-Nets ensures, that all samples are uniformly distributed for any integer subdivision of our space. • (t, d)-sequence is a sequence xi of points in [0, 1]d such that for all integers and m>t, the point set is a (t, m, d)-net in base b. • The number t is the quality parameter. Smaller values of t yield more uniform nets and sequences because b-ary boxes of smaller volume still contain points. © Machiraju/Möller
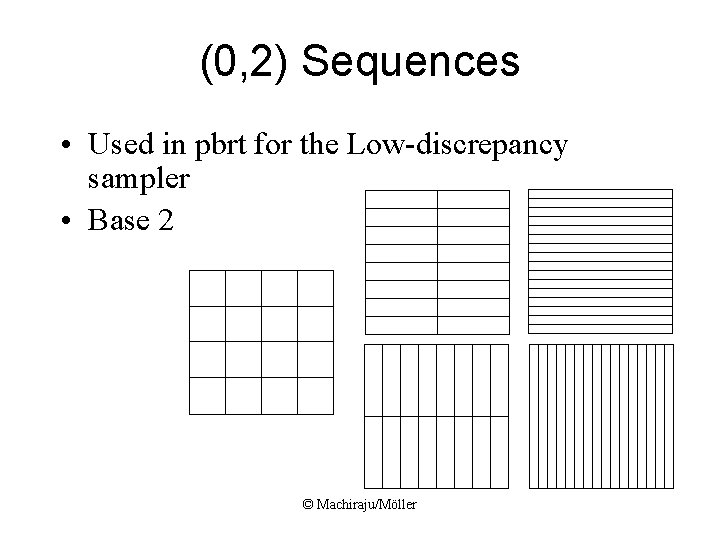
(0, 2) Sequences • Used in pbrt for the Low-discrepancy sampler • Base 2 © Machiraju/Möller
Practical Issues • Create one sequence • Create new ones from the first sequence by “scrambling” rows and columns • This is only possible for (0, 2) sequences, since they have such a nice property (the “nrook” property) © Machiraju/Möller
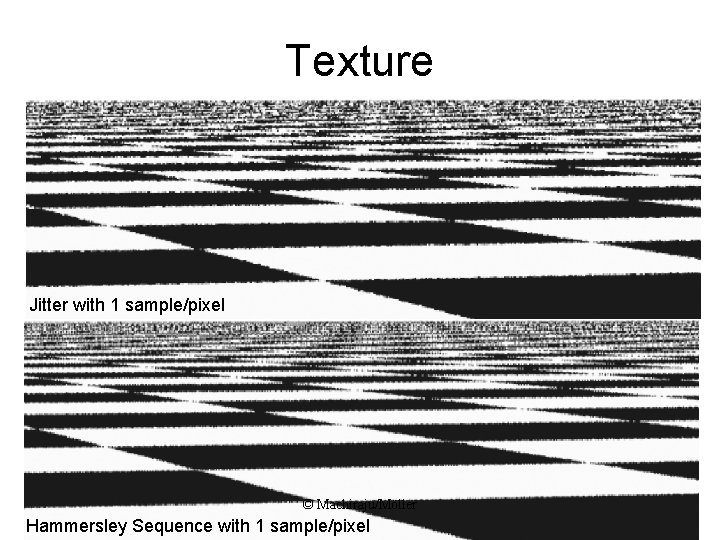
Texture Jitter with 1 sample/pixel © Machiraju/Möller Hammersley Sequence with 1 sample/pixel
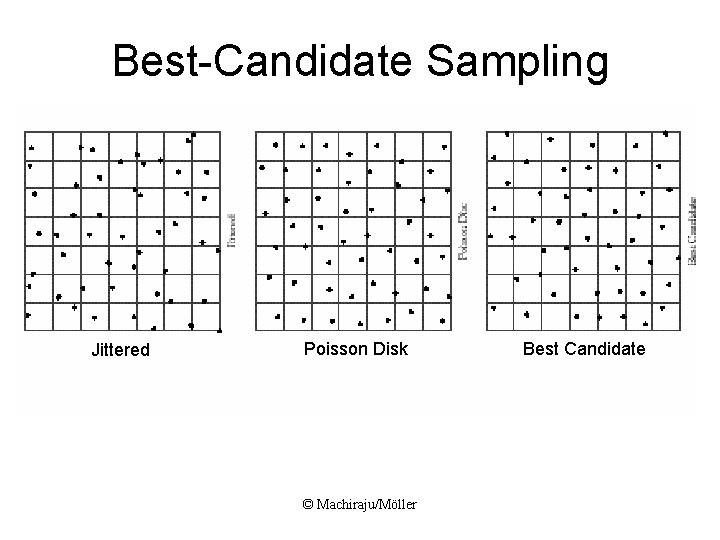
Best-Candidate Sampling • Jittered stratification – Randomness (inefficient) – Clustering problems – Undersampling (“holes”) • Low Discrepancy Sequences – Still (visibly) aliased • “Ideal”: Poisson disk distribution – too computationally expensive • Best Sampling - approximation to Poisson disk © Machiraju/Möller
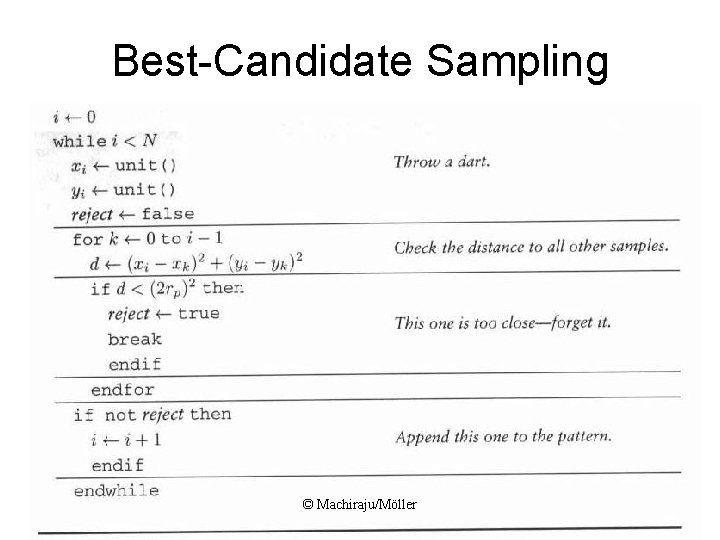
Poisson Disk • • • Comes from structure of eye – rods and cones Dart Throwing No two points are closer than a threshold Very expensive Compromise – Best Candidate Sampling – Compute pattern which is reused by tiling the image plane (translating and scaling). – Toroidal topology – Effects the distance between points on top to bottom © Machiraju/Möller
Best-Candidate Sampling Jittered Poisson Disk © Machiraju/Möller Best Candidate
Best-Candidate Sampling © Machiraju/Möller
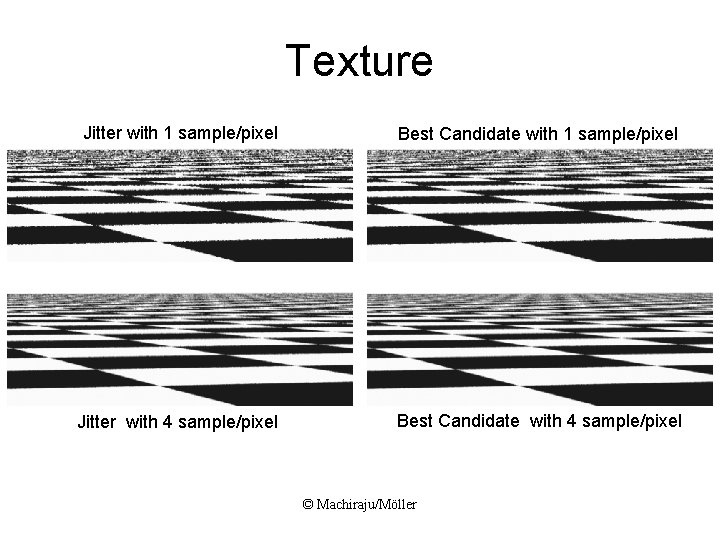
Texture Jitter with 1 sample/pixel Best Candidate with 1 sample/pixel Jitter with 4 sample/pixel Best Candidate with 4 sample/pixel © Machiraju/Möller
Next • Probability Theory • Monte Carlo Techniques • Rendering Equation © Machiraju/Möller