Sign in Phones up New seating chart Spurious


 “on a")


 Coupe time(s) Position (m) 0")


- Slides: 22
Sign in Phones up!!! New seating chart.
Spurious Graphs As a group, look at your graph. You will need to: come up with a hypothesis statement that corresponds to the graph Pick two data points and describe how they relate to your thesis Come up with a way to test your hypothesis
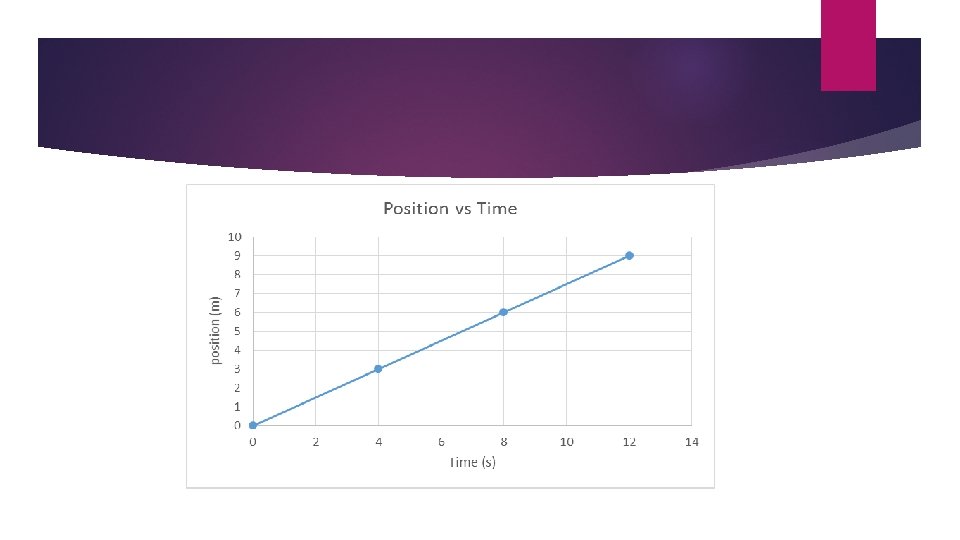
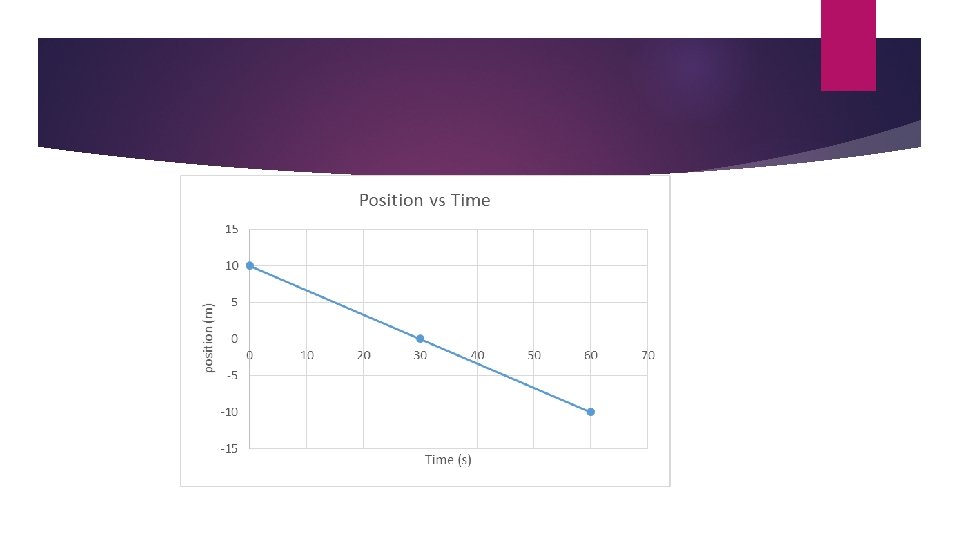
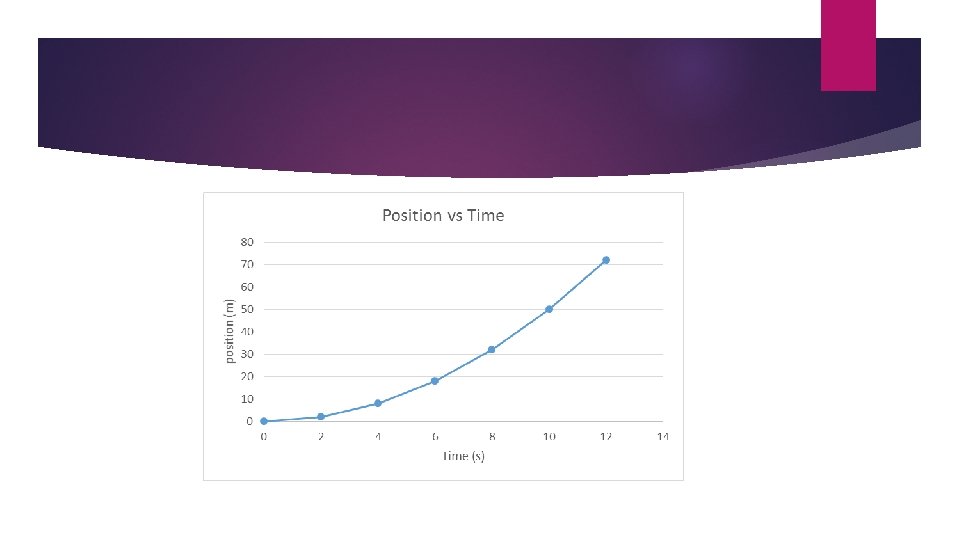
Position vs Time Graphs Position: A vector quantity that describes the distance from an object to the point of origin. One way to describe motion is a position vs time graph. X-axis: time (s) Y-axis: position (m) The line allows for an estimation of the objects position at any time, even if data isn’t specifically recorded at that moment. The slope of the line is the object’s velocity
Position vs Time Graphs Interpreting lines on a Position Time Graph FLAT / HORIZONTAL line = NO motion STRAIGHT line = CONSTANT VELOCITY (cruise control) CURVED line = CHANGING VELOCITY (braking, hitting the gas) The greater the slope, the greater the velocity A change from positive to negative slope = DIRECTION CHANGE
Answer with group
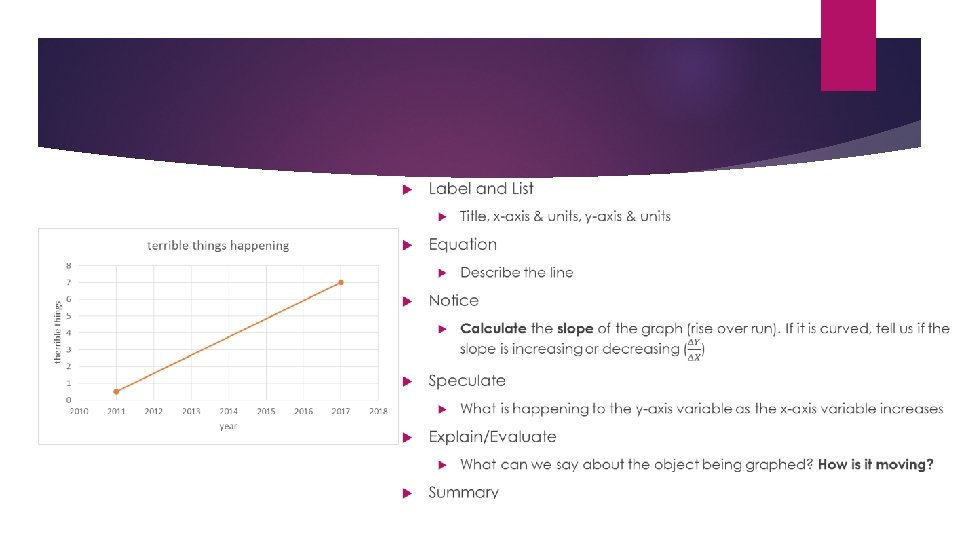
Position vs time graphs, think/pair/share Label and List Equation Calculate the slope/velocity of the graph (rise over run). If it is curved, tell us if the slope is increasing or decreasing What is happening to the y-axis variable as the x-axis variable increases Explain/Evaluate Horizontal, vertical, slope up/down, curved up/down ACCELERATION: a vector quantity that refers to the rate at which an object changes its velocity. Speculate Describe the line Notice Title, x-axis & units, y-axis & units What can we say about the object being graphed? How is it moving? Summary Put it all together Don’t put this on your page
1. Write summaries for position vs time graphs 2. Quick analysis of a position vs time graph 3. Tumble Buggy vs Coupe Lab
Page 6: Position vs Time analysis Page 7: Position vs Time Graphs Page 8: Tumble Buggy vs Coupe Lab analysis Page 9: Tumble Buggy vs Coupe Lab data
Position vs time Make this note at the top of your paper: ** The slope of the line on a position vs time graph is the object’s velocity. ** SUPER IMPORTANT!!!
Summarize Write a summary for each graph: Summary: (put it all together) “on a _______ graph, if the line is _______ , as x-variable increases the y-variable ________. The object is …”
Tumble Buggy vs Coupe Lab: data will be recorded in notebooks
Tumble Buggy v Coupe PURPOSE: The purpose of this lab is to generate, interpret, and compare position vs time graphs for two different vehicles. Purpose of the lab needs to be written on the lab sheet
Tumble Buggy v Coupe DATA: Tumble Buggy Position (m) Coupe time(s) Position (m) 0 m 0 m 0. 5 m 0. 25 m 1. 0 m 0. 5 m 1. 5 m 0. 75 m 2. 0 m 1. 0 m 2. 5 m 1. 25 m 3. 0 m 1. 5 m 3. 5 m 1. 75 m 4. 0 m 2. 0 m time (s)
Tumble Buggy vs coupe A helpful app for collecting data is hudltechnique Search for “HUDL” but make sure you get the one that has the “technique” with the name Free! Works for both iphones androids This lets you take a video and play it back in slower motion with timer on bottom of screen.
Tumble Buggy vs Coupe Basic Just have the buggy/car run the entire way through the distance to get times!!! Procedure: Collect 9 data points for both the tumble buggy and coupe (including the 0, 0 point) You should be recording time at the positions listed in the data table Mark off the spacing with tape in the hallway (where we did the Falcon Fury 500) Pull Graph You up the tape when you are finished and throw away responsibly, please data in position vs time graphs need to set up the graphs yourselves.
Tumble Buggy vs coupe Interpret and compare graphs Under the graphs, you should answer the following questions: What is the difference between the tumble buggy and coupe graph? Why do they look different -- What can we say about the velocity for the tumble buggy? For the coupe?