
Shinkin International Introduction and Analysis July 2012 Contents
- Slides: 26
Shinkin International Introduction and Analysis July 2012
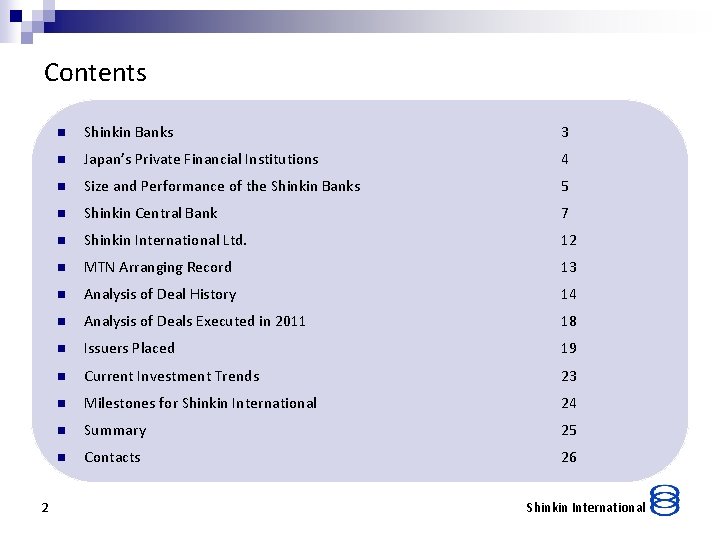
Contents 2 n Shinkin Banks 3 n Japan’s Private Financial Institutions 4 n Size and Performance of the Shinkin Banks 5 n Shinkin Central Bank 7 n Shinkin International Ltd. 12 n MTN Arranging Record 13 n Analysis of Deal History 14 n Analysis of Deals Executed in 2011 18 n Issuers Placed 19 n Current Investment Trends 23 n Milestones for Shinkin International 24 n Summary 25 n Contacts 26 Shinkin International
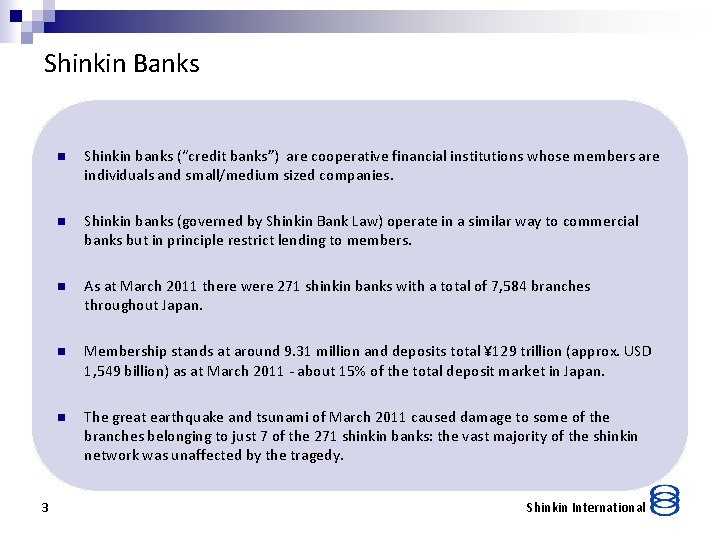
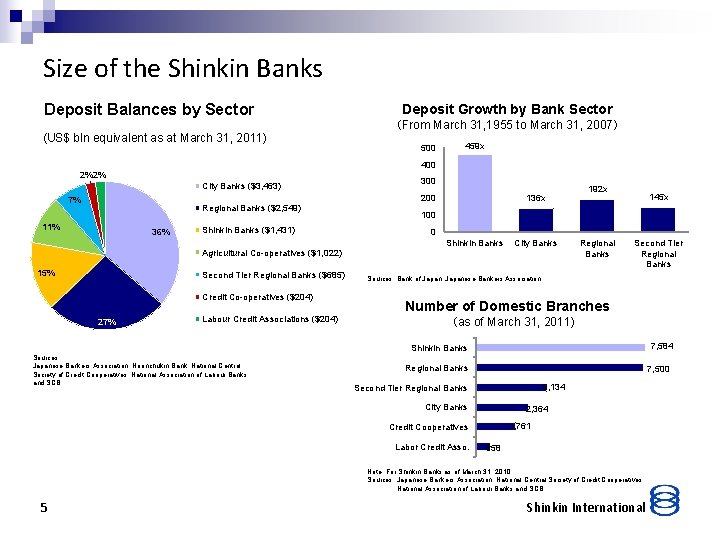
Shinkin Banks 3 n Shinkin banks (“credit banks”) are cooperative financial institutions whose members are individuals and small/medium sized companies. n Shinkin banks (governed by Shinkin Bank Law) operate in a similar way to commercial banks but in principle restrict lending to members. n As at March 2011 there were 271 shinkin banks with a total of 7, 584 branches throughout Japan. n Membership stands at around 9. 31 million and deposits total ¥ 129 trillion (approx. USD 1, 549 billion) as at March 2011 - about 15% of the total deposit market in Japan. n The great earthquake and tsunami of March 2011 caused damage to some of the branches belonging to just 7 of the 271 shinkin banks: the vast majority of the shinkin network was unaffected by the tragedy. Shinkin International
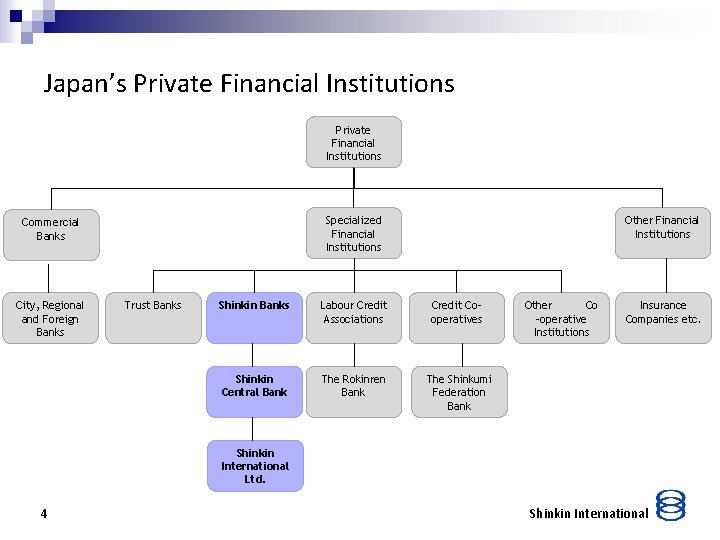
Japan’s Private Financial Institutions City, Regional and Foreign Banks Other Financial Institutions Specialized Financial Institutions Commercial Banks Trust Banks Shinkin Banks Labour Credit Associations Credit Cooperatives Shinkin Central Bank The Rokinren Bank The Shinkumi Federation Bank Other Co -operative Institutions Insurance Companies etc. Shinkin International Ltd. 4 Shinkin International
Size of the Shinkin Banks Deposit Balances by Sector (US$ bln equivalent as at March 31, 2011) Deposit Growth by Bank Sector (From March 31, 1955 to March 31, 2007) 500 459 x 400 2%2% City Banks ($3, 463) 7% Regional Banks ($2, 549) 11% 36% Shinkin Banks ($1, 431) Agricultural Co-operatives ($1, 022) 15% Second Tier Regional Banks ($685) Credit Co-operatives ($204) 27% Labour Credit Associations ($204) 300 136 x 200 192 x 145 x 100 0 Shinkin Banks City Banks Regional Banks Second Tier Regional Banks Sources: Bank of Japan, Japanese Bankers Association Number of Domestic Branches (as of March 31, 2011) 7, 584 Shinkin Banks Sources: Japanese Bankers Association, Norinchukin Bank, National Central Society of Credit Cooperatives, National Association of Labour Banks and SCB Regional Banks 7, 500 3, 134 Second Tier Regional Banks City Banks 2, 364 1, 761 Credit Cooperatives Labor Credit Asso. 658 Note: For Shinkin Banks as of March 31, 2010 Sources: Japanese Bankers Association, National Central Society of Credit Cooperatives, National Association of Labour Banks and SCB 5 Shinkin International
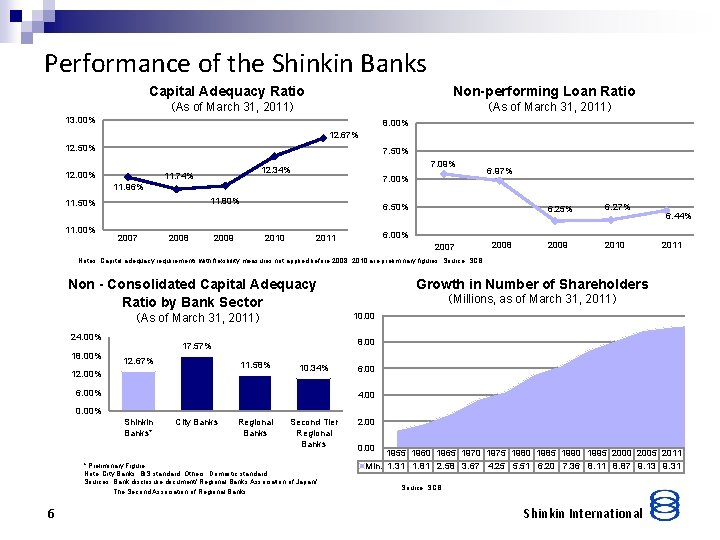
Performance of the Shinkin Banks Capital Adequacy Ratio Non-performing Loan Ratio (As of March 31, 2011) 13. 00% 8. 00% 12. 67% 12. 50% 7. 50% 12. 00% 7. 09% 12. 34% 11. 74% 7. 00% 11. 96% 11. 80% 11. 50% 11. 00% 2007 2008 2009 6. 97% 6. 50% 2010 6. 00% 2011 2007 2008 6. 25% 6. 27% 2009 2010 6. 44% 2011 Notes: Capital adequacy requirements with flexibility measures not applied before 2008. 2010 are preliminary figures. Source: SCB Non - Consolidated Capital Adequacy Ratio by Bank Sector 18. 00% 8. 00 17. 57% 12. 67% 11. 58% 12. 00% (Millions, as of March 31, 2011) 10. 00 (As of March 31, 2011) 24. 00% Growth in Number of Shareholders 10. 34% 6. 00 4. 00 0. 00% Shinkin Banks* City Banks Regional Banks Second Tier Regional Banks * Preliminary Figure Note: City Banks: BIS standard Others: Domestic standard Sources: Bank disclosure document/ Regional Banks Association of Japan/ The Second Association of Regional Banks 6 2. 00 0. 00 1955 1960 1965 1970 1975 1980 1985 1990 1995 2000 2005 2011 Mln. 1. 31 1. 81 2. 58 3. 67 4. 25 5. 51 6. 20 7. 36 8. 11 8. 87 9. 13 9. 31 Source: SCB Shinkin International
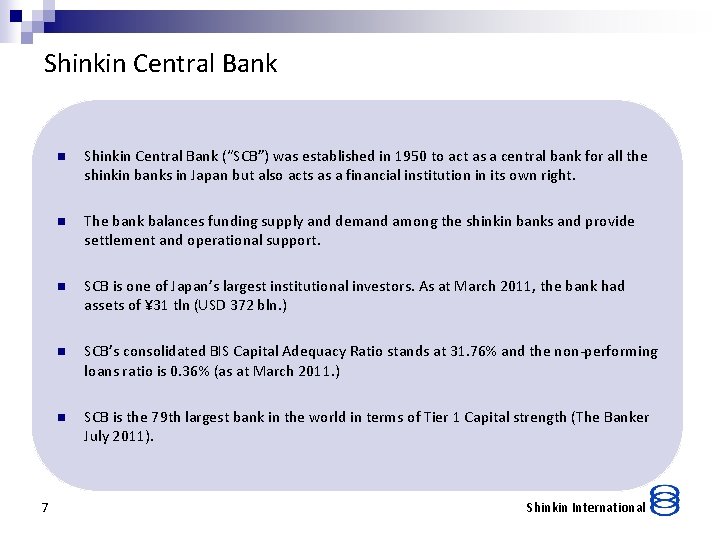
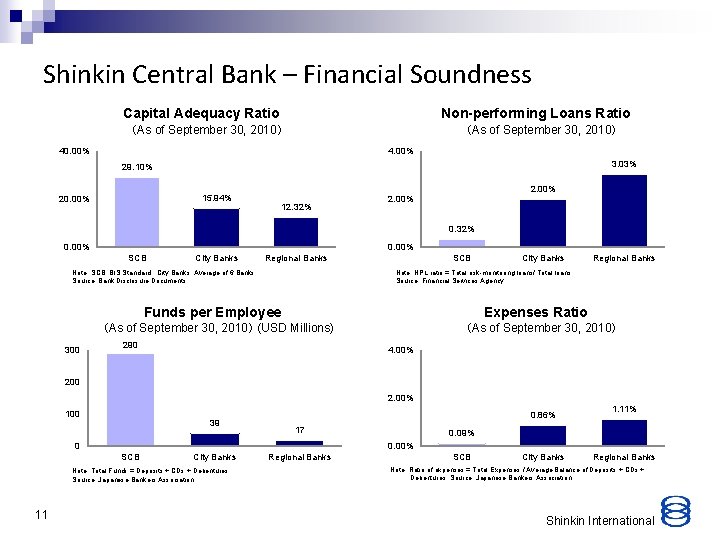
Shinkin Central Bank 7 n Shinkin Central Bank (“SCB”) was established in 1950 to act as a central bank for all the shinkin banks in Japan but also acts as a financial institution in its own right. n The bank balances funding supply and demand among the shinkin banks and provide settlement and operational support. n SCB is one of Japan’s largest institutional investors. As at March 2011, the bank had assets of ¥ 31 tln (USD 372 bln. ) n SCB’s consolidated BIS Capital Adequacy Ratio stands at 31. 76% and the non-performing loans ratio is 0. 36% (as at March 2011. ) n SCB is the 79 th largest bank in the world in terms of Tier 1 Capital strength (The Banker July 2011). Shinkin International
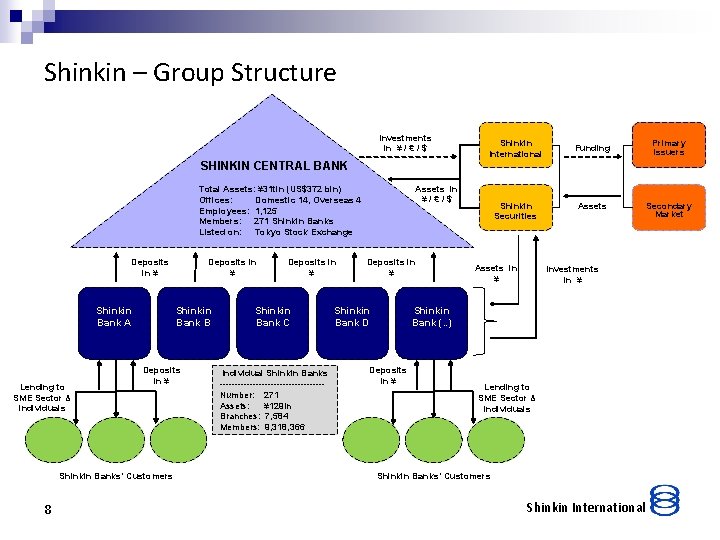
Shinkin – Group Structure Investments in ¥ / € / $ SHINKIN CENTRAL BANK Assets in ¥/€/$ Total Assets: ¥ 31 tln (US$372 bln) Offices: Domestic 14, Overseas 4 Employees: 1, 125 Members: 271 Shinkin Banks Listed on: Tokyo Stock Exchange Deposits in ¥ Shinkin Bank A Lending to SME Sector & individuals Shinkin Bank B Deposits in ¥ Shinkin Banks’ Customers 8 Deposits in ¥ Shinkin Bank C Individual Shinkin Banks -----------------Number: 271 Assets: ¥ 129 ln Branches: 7, 584 Members: 9, 318, 366 Shinkin International Deposits in ¥ Shinkin Bank D Shinkin Securities Assets in ¥ Funding Primary Issuers Assets Secondary Market Investments in ¥ Shinkin Bank (. . ) Deposits in ¥ Lending to SME Sector & individuals Shinkin Banks’ Customers Shinkin International
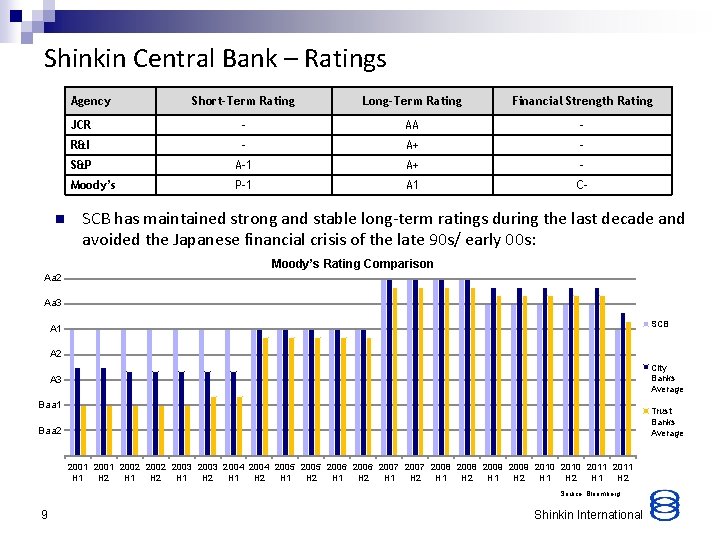
Shinkin Central Bank – Ratings Agency n Short-Term Rating Long-Term Rating Financial Strength Rating JCR - AA - R&I - A+ - S&P A-1 A+ - Moody’s P-1 A 1 C- SCB has maintained strong and stable long-term ratings during the last decade and avoided the Japanese financial crisis of the late 90 s/ early 00 s: Moody’s Rating Comparison Aa 2 Aa 3 SCB A 1 A 2 City Banks Average A 3 Baa 1 Trust Banks Average Baa 2 2001 2002 2003 2004 2005 2006 2007 2008 2009 2010 2011 H 1 H 2 H 1 H 2 H 1 H 2 Source: Bloomberg 9 Shinkin International
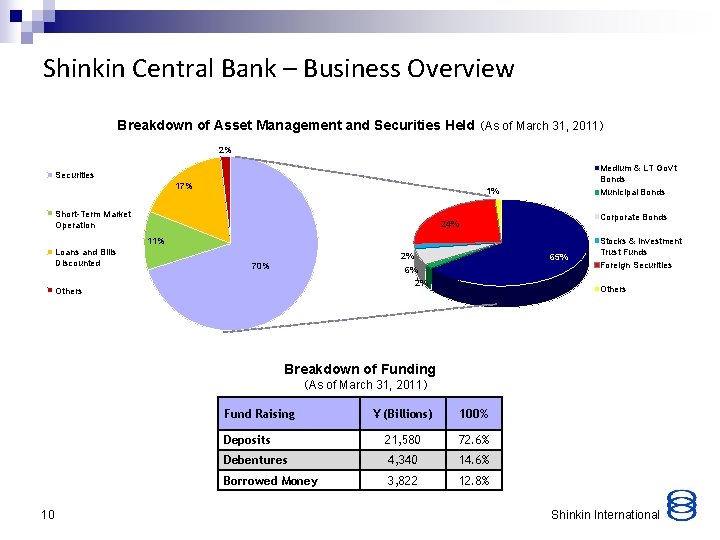
Shinkin Central Bank – Business Overview Breakdown of Asset Management and Securities Held (As of March 31, 2011) 2% Medium & LT Gov't Bonds Municipal Bonds Securities 17% 1% Short-Term Market Operation Corporate Bonds 24% 11% Loans and Bills Discounted 2% 70% 65% 6% 2% Others Stocks & Investment Trust Funds Foreign Securities Others Breakdown of Funding (As of March 31, 2011) Fund Raising 10 ¥ (Billions) 100% Deposits 21, 580 72. 6% Debentures 4, 340 14. 6% Borrowed Money 3, 822 12. 8% Shinkin International
Shinkin Central Bank – Financial Soundness Capital Adequacy Ratio Non-performing Loans Ratio (As of September 30, 2010) 40. 00% 4. 00% 3. 03% 29. 10% 15. 94% 20. 00% 2. 00% 12. 32% 2. 00% 0. 32% 0. 00% SCB City Banks Regional Banks 300 SCB City Banks Regional Banks Note: NPL ratio = Total risk-monitoring loans/ Total loans Source: Financial Services Agency Note: SCB: BIS Standard City Banks: Average of 6 Banks Source: Bank Disclosure Documents Funds per Employee Expenses Ratio (As of September 30, 2010) (USD Millions) (As of September 30, 2010) 290 4. 00% 200 2. 00% 100 39 0. 86% 17 0 0. 09% 0. 00% SCB City Banks Note: Total Funds = Deposits + CDs + Debentures Source: Japanese Bankers Association 11 1. 11% Regional Banks SCB City Banks Regional Banks Note: Ratio of expenses = Total Expenses / Average Balance of Deposits + CDs + Debentures. Source: Japanese Bankers Association Shinkin International
Shinkin International Ltd. 12 n Shinkin International Ltd. (a wholly owned subsidiary of Shinkin Central Bank) was established in London in 1990 as an overseas base for securities business. n The main goals of the company are to arrange and place private EMTN draw-downs, to trade secondary eurobonds and to provide broad investment opportunities. n These activities are driven by the combined requirements of q Shinkin Central Bank q individual banks among the extensive shinkin network (approximately 80% of shinkin banks have bought EMTNs) q other investors in Japan and elsewhere (sourced both through direct marketing and in co-operation with other arrangers) n We are regulated in the UK by the Financial Services Authority. Shinkin International
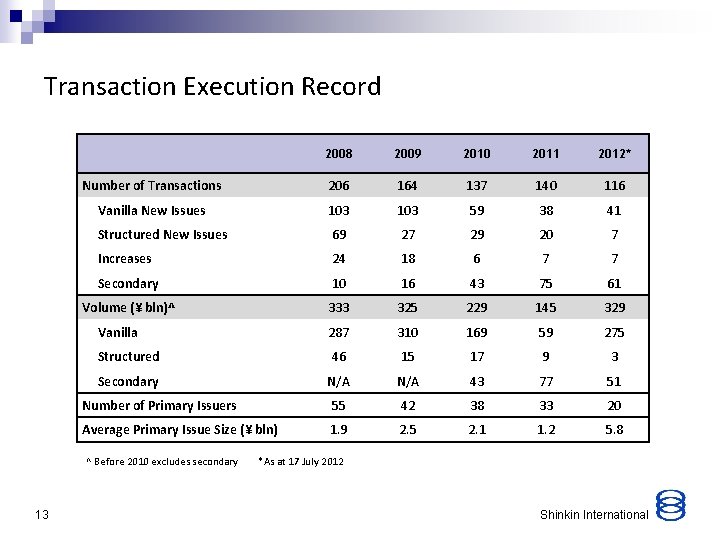
Transaction Execution Record 2008 2009 2010 2011 2012* Number of Transactions 206 164 137 140 116 Vanilla New Issues 103 59 38 41 Structured New Issues 69 27 29 20 7 Increases 24 18 6 7 7 Secondary 10 16 43 75 61 Volume (¥ bln)^ 333 325 229 145 329 Vanilla 287 310 169 59 275 Structured 46 15 17 9 3 Secondary N/A 43 77 51 Number of Primary Issuers 55 42 38 33 20 Average Primary Issue Size (¥ bln) 1. 9 2. 5 2. 1 1. 2 5. 8 ^ Before 2010 excludes secondary 13 *As at 17 July 2012 Shinkin International
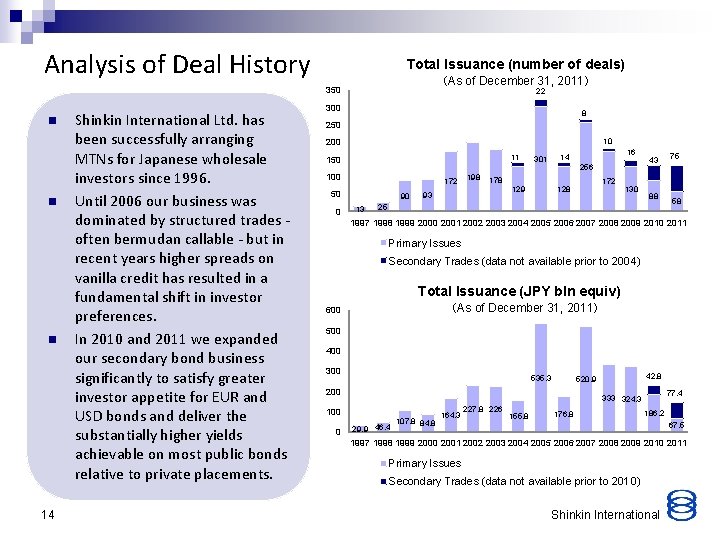
Analysis of Deal History Total Issuance (number of deals) (As of December 31, 2011) 350 n n n 14 Shinkin International Ltd. has been successfully arranging MTNs for Japanese wholesale investors since 1996. Until 2006 our business was dominated by structured trades often bermudan callable - but in recent years higher spreads on vanilla credit has resulted in a fundamental shift in investor preferences. In 2010 and 2011 we expanded our secondary bond business significantly to satisfy greater investor appetite for EUR and USD bonds and deliver the substantially higher yields achievable on most public bonds relative to private placements. 22 300 8 250 10 200 11 150 100 172 50 0 90 13 198 178 93 301 129 16 14 256 172 128 130 43 88 25 75 58 1997 1998 1999 2000 2001 2002 2003 2004 2005 2006 2007 2008 2009 2010 2011 Primary Issues Secondary Trades (data not available prior to 2004) Total Issuance (JPY bln equiv) (As of December 31, 2011) 600 500 400 300 535. 3 200 77. 4 333 324. 3 100 0 42. 8 520. 9 29. 9 46. 4 107. 8 84. 8 164. 3 227. 8 226 155. 8 176. 8 186. 2 67. 5 1997 1998 1999 2000 2001 2002 2003 2004 2005 2006 2007 2008 2009 2010 2011 Primary Issues Secondary Trades (data not available prior to 2010) Shinkin International
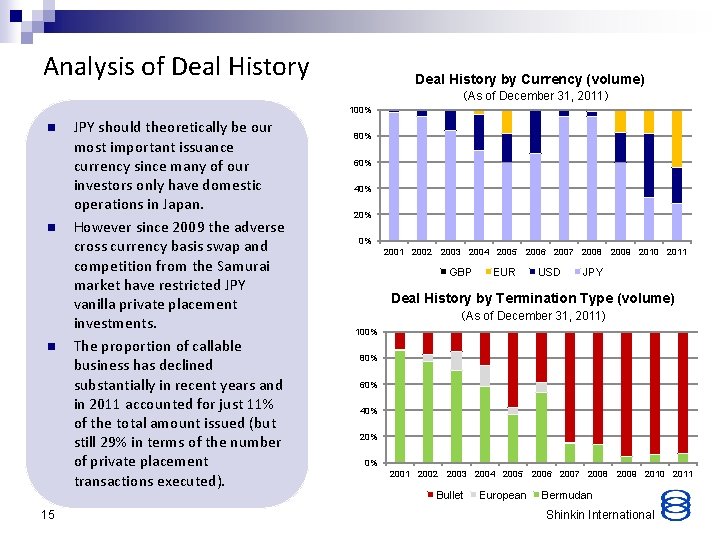
Analysis of Deal History by Currency (volume) (As of December 31, 2011) 100% n n n 15 JPY should theoretically be our most important issuance currency since many of our investors only have domestic operations in Japan. However since 2009 the adverse cross currency basis swap and competition from the Samurai market have restricted JPY vanilla private placement investments. The proportion of callable business has declined substantially in recent years and in 2011 accounted for just 11% of the total amount issued (but still 29% in terms of the number of private placement transactions executed). 80% 60% 40% 20% 0% 2001 2002 2003 2004 2005 2006 2007 2008 2009 2010 2011 GBP EUR USD JPY Deal History by Termination Type (volume) (As of December 31, 2011) 100% 80% 60% 40% 20% 0% 2001 2002 2003 2004 2005 2006 2007 2008 2009 2010 2011 Bullet European Bermudan Shinkin International
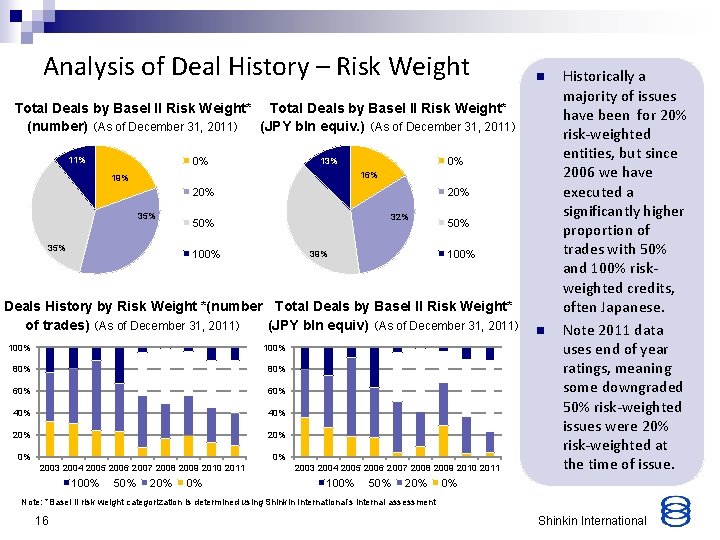
Analysis of Deal History – Risk Weight n Total Deals by Basel II Risk Weight* (number) (As of December 31, 2011) (JPY bln equiv. ) (As of December 31, 2011) 0% 11% 0% 13% 16% 19% 20% 35% 20% 32% 50% 100% 39% Deals History by Risk Weight *(number Total Deals by Basel II Risk Weight* of trades) (As of December 31, 2011) (JPY bln equiv) (As of December 31, 2011) 100% 80% 60% 40% 20% 0% 0% 2003 2004 2005 2006 2007 2008 2009 2010 2011 100% 50% 20% n Historically a majority of issues have been for 20% risk-weighted entities, but since 2006 we have executed a significantly higher proportion of trades with 50% and 100% riskweighted credits, often Japanese. Note 2011 data uses end of year ratings, meaning some downgraded 50% risk-weighted issues were 20% risk-weighted at the time of issue. 0% Note: *Basel II risk weight categorization is determined using Shinkin International’s internal assessment 16 Shinkin International
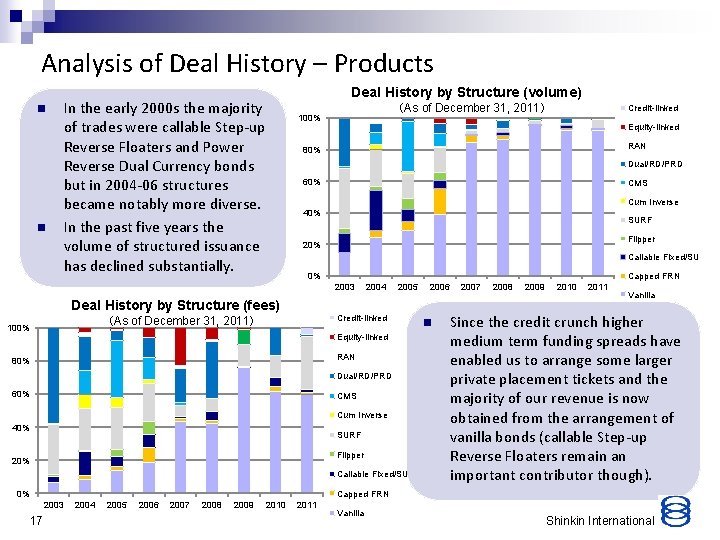
Analysis of Deal History – Products n n In the early 2000 s the majority of trades were callable Step-up Reverse Floaters and Power Reverse Dual Currency bonds but in 2004 -06 structures became notably more diverse. In the past five years the volume of structured issuance has declined substantially. Deal History by Structure (volume) (As of December 31, 2011) 100% Equity-linked RAN 80% Dual/RD/PRD 60% CMS Cum Inverse 40% SURF Flipper 20% Callable Fixed/SU Capped FRN 0% 2003 Deal History by Structure (fees) 2004 2005 Credit-linked (As of December 31, 2011) 100% Equity-linked RAN 80% Dual/RD/PRD 60% CMS Cum Inverse 40% SURF Flipper 20% Callable Fixed/SU 2006 n 2007 2008 2009 2010 2011 Vanilla Since the credit crunch higher medium term funding spreads have enabled us to arrange some larger private placement tickets and the majority of our revenue is now obtained from the arrangement of vanilla bonds (callable Step-up Reverse Floaters remain an important contributor though). Capped FRN 0% 2003 17 Credit-linked 2004 2005 2006 2007 2008 2009 2010 2011 Vanilla Shinkin International
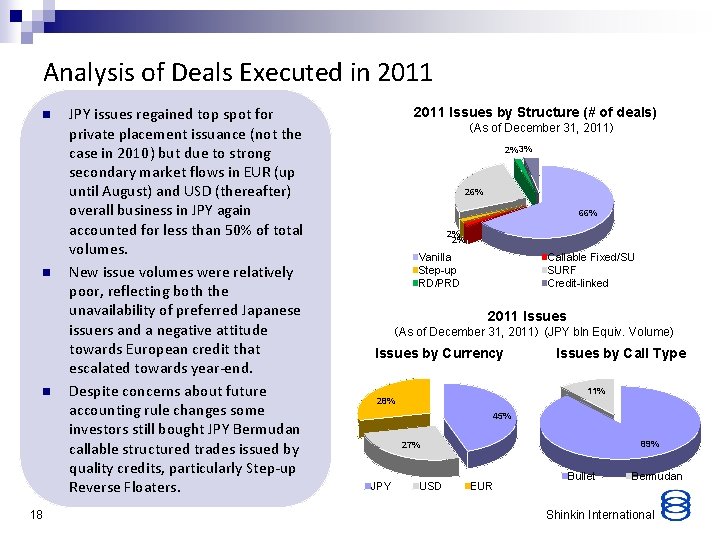
Analysis of Deals Executed in 2011 n n n 18 JPY issues regained top spot for private placement issuance (not the case in 2010) but due to strong secondary market flows in EUR (up until August) and USD (thereafter) overall business in JPY again accounted for less than 50% of total volumes. New issue volumes were relatively poor, reflecting both the unavailability of preferred Japanese issuers and a negative attitude towards European credit that escalated towards year-end. Despite concerns about future accounting rule changes some investors still bought JPY Bermudan callable structured trades issued by quality credits, particularly Step-up Reverse Floaters. 2011 Issues by Structure (# of deals) (As of December 31, 2011) 2% 3% 26% 66% 2% 2% Vanilla Step-up RD/PRD Callable Fixed/SU SURF Credit-linked 2011 Issues (As of December 31, 2011) (JPY bln Equiv. Volume) Issues by Currency Issues by Call Type 11% 28% 45% 89% 27% JPY USD EUR Bullet Bermudan Shinkin International
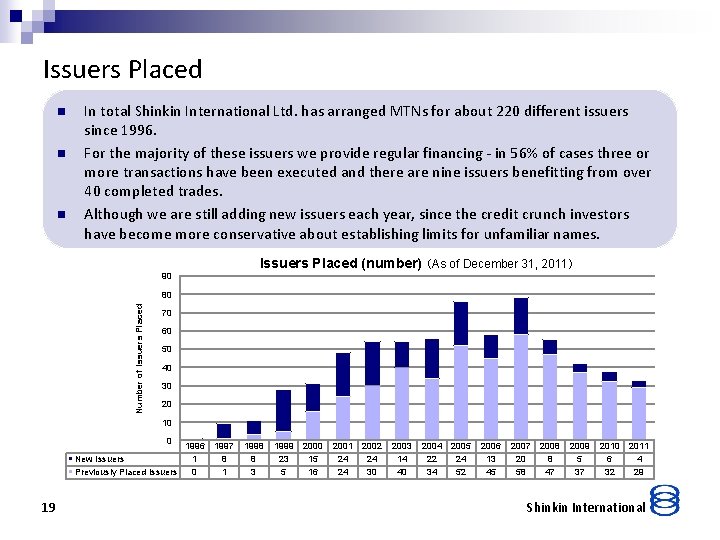
Issuers Placed n n n In total Shinkin International Ltd. has arranged MTNs for about 220 different issuers since 1996. For the majority of these issuers we provide regular financing - in 56% of cases three or more transactions have been executed and there are nine issuers benefitting from over 40 completed trades. Although we are still adding new issuers each year, since the credit crunch investors have become more conservative about establishing limits for unfamiliar names. Issuers Placed (number) (As of December 31, 2011) 90 Number of Issuers Placed 80 70 60 50 40 30 20 10 0 New Issuers Previously Placed Issuers 19 1996 1 0 1997 8 1 1998 8 3 1999 23 5 2000 15 16 2001 24 24 2002 24 30 2003 14 40 2004 22 34 2005 24 52 2006 13 45 2007 20 58 2008 8 47 2009 5 37 2010 6 32 2011 4 29 Shinkin International
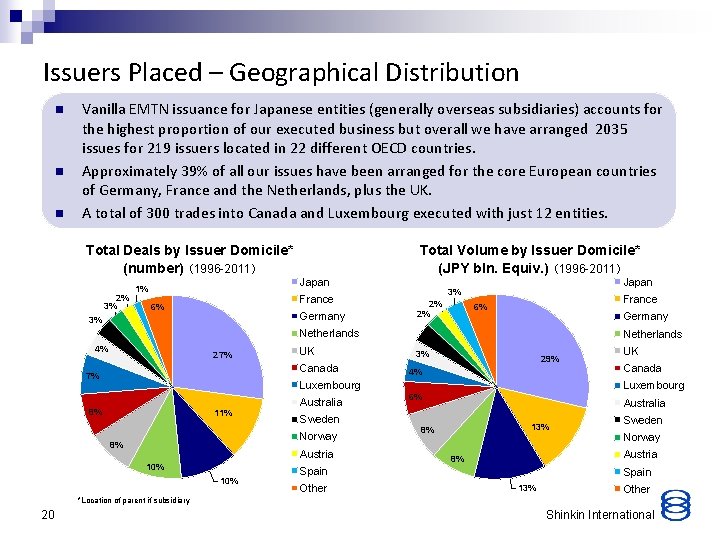
Issuers Placed – Geographical Distribution n Vanilla EMTN issuance for Japanese entities (generally overseas subsidiaries) accounts for the highest proportion of our executed business but overall we have arranged 2035 issues for 219 issuers located in 22 different OECD countries. Approximately 39% of all our issues have been arranged for the core European countries of Germany, France and the Netherlands, plus the UK. A total of 300 trades into Canada and Luxembourg executed with just 12 entities. Total Deals by Issuer Domicile* (number) (1996 -2011) 2% 3% 1% Japan France 6% Germany 3% Total Volume by Issuer Domicile* (JPY bln. Equiv. ) (1996 -2011) 2% 2% Netherlands 4% 27% UK Canada 7% Japan 3% France 6% Germany Netherlands 3% 3% 29% 4% Luxembourg 8% 11% Australia Sweden Norway 8% Austria 10% Canada Luxembourg 6% Australia 13% 8% Sweden Norway Austria 8% Spain Other UK Spain 13% Other *Location of parent if subsidiary 20 Shinkin International
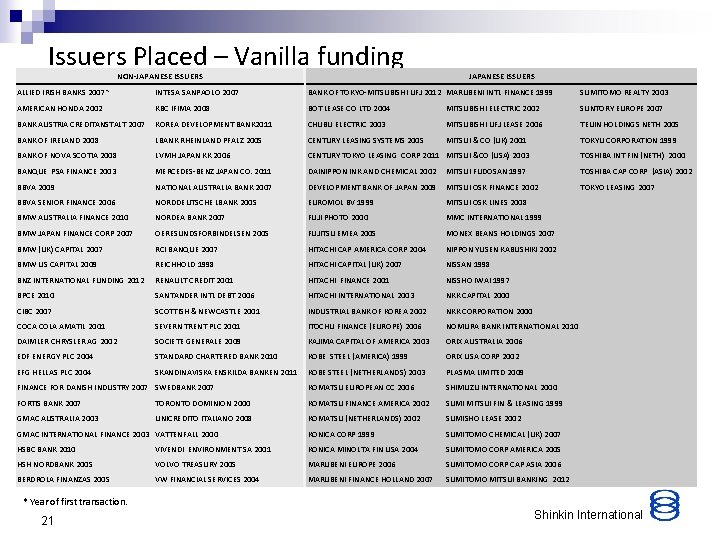
Issuers Placed – Vanilla funding NON-JAPANESE ISSUERS ALLIED IRISH BANKS 2007* INTESA SANPAOLO 2007 BANK OF TOKYO-MITSUBISHI UFJ 2012 MARUBENI INTL FINANCE 1999 SUMITOMO REALTY 2003 AMERICAN HONDA 2002 KBC IFIMA 2008 BOT LEASE CO LTD 2004 MITSUBISHI ELECTRIC 2002 SUNTORY EUROPE 2007 BANK AUSTRIA CREDITANSTALT 2007 KOREA DEVELOPMENT BANK 2011 CHUBU ELECTRIC 2003 MITSUBISHI UFJ LEASE 2006 TEIJIN HOLDINGS NETH 2005 BANK OF IRELAND 2008 LBANK RHEINLAND PFALZ 2005 CENTURY LEASING SYSTEMS 2005 MITSUI & CO (UK) 2001 TOKYU CORPORATION 1999 BANK OF NOVA SCOTIA 2008 LVMH JAPAN KK 2006 CENTURY TOKYO LEASING CORP 2011 MITSUI &CO (USA) 2003 TOSHIBA INT FIN (NETH) 2000 BANQUE PSA FINANCE 2003 MERCEDES-BENZ JAPAN CO. 2011 DAINIPPON INK AND CHEMICAL 2002 MITSUI FUDOSAN 1997 TOSHIBA CAP CORP (ASIA) 2002 BBVA 2009 NATIONAL AUSTRALIA BANK 2007 DEVELOPMENT BANK OF JAPAN 2009 MITSUI OSK FINANCE 2002 TOKYO LEASING 2007 BBVA SENIOR FINANCE 2006 NORDDEUTSCHE LBANK 2005 EUROMOL BV 1999 MITSUI OSK LINES 2008 BMW AUSTRALIA FINANCE 2010 NORDEA BANK 2007 FUJI PHOTO 2000 MMC INTERNATIONAL 1999 BMW JAPAN FINANCE CORP 2007 OERESUNDSFORBINDELSEN 2005 FUJITSU EMEA 2005 MONEX BEANS HOLDINGS 2007 BMW (UK) CAPITAL 2007 RCI BANQUE 2007 HITACHI CAP AMERICA CORP 2004 NIPPON YUSEN KABUSHIKI 2002 BMW US CAPITAL 2009 REICHHOLD 1998 HITACHI CAPITAL (UK) 2007 NISSAN 1998 BNZ INTERNATIONAL FUNDING 2012 RENAULT CREDIT 2001 HITACHI FINANCE 2001 NISSHO IWAI 1997 BPCE 2010 SANTANDER INTL DEBT 2006 HITACHI INTERNATIONAL 2003 NKK CAPITAL 2000 CIBC 2007 SCOTTISH & NEWCASTLE 2001 INDUSTRIAL BANK OF KOREA 2002 NKK CORPORATION 2000 COCA COLA AMATIL 2001 SEVERN TRENT PLC 2001 ITOCHU FINANCE (EUROPE) 2006 NOMURA BANK INTERNATIONAL 2010 DAIMLER CHRYSLER AG 2002 SOCIETE GENERALE 2009 KAJIMA CAPITAL OF AMERICA 2003 ORIX AUSTRALIA 2006 EDF ENERGY PLC 2004 STANDARD CHARTERED BANK 2010 KOBE STEEL (AMERICA) 1999 ORIX USA CORP 2002 EFG HELLAS PLC 2004 SKANDINAVISKA ENSKILDA BANKEN 2011 KOBE STEEL (NETHERLANDS) 2003 PLASMA LIMITED 2009 FINANCE FOR DANISH INDUSTRY 2007 SWEDBANK 2007 KOMATSU EUROPEAN CC 2006 SHIMUZU INTERNATIONAL 2000 FORTIS BANK 2007 TORONTO DOMINION 2000 KOMATSU FINANCE AMERICA 2002 SUMI MITSUI FIN & LEASING 1999 GMAC AUSTRALIA 2003 UNICREDITO ITALIANO 2008 KOMATSU (NETHERLANDS) 2002 SUMISHO LEASE 2002 GMAC INTERNATIONAL FINANCE 2003 VATTENFALL 2000 KONICA CORP 1999 SUMITOMO CHEMICAL (UK) 2007 HSBC BANK 2010 VIVENDI ENVIRONMENT SA 2001 KONICA MINOLTA FIN USA 2004 SUMITOMO CORP AMERICA 2005 HSH NORDBANK 2005 VOLVO TREASURY 2005 MARUBENI EUROPE 2006 SUMITOMO CORP CAP ASIA 2006 BERDROLA FINANZAS 2005 VW FINANCIAL SERVICES 2004 MARUBENI FINANCE HOLLAND 2007 SUMITOMO MITSUI BANKING 2012 * Year of first transaction. 21 Shinkin International
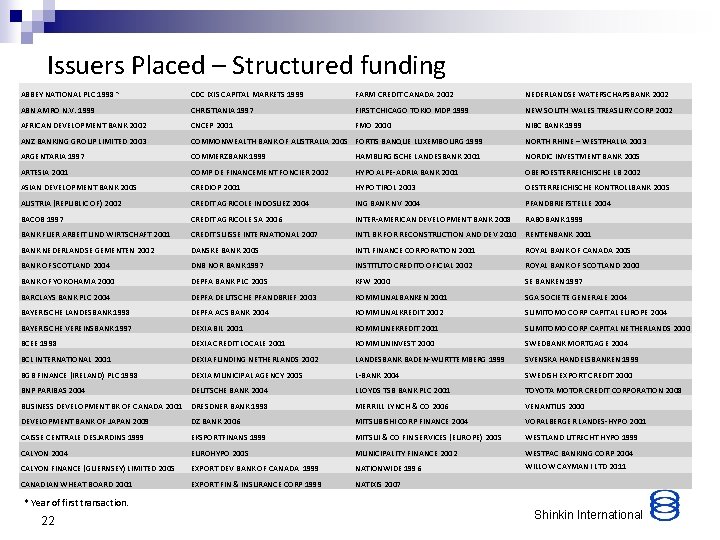
Issuers Placed – Structured funding ABBEY NATIONAL PLC 1998* CDC IXIS CAPITAL MARKETS 1999 FARM CREDIT CANADA 2002 NEDERLANDSE WATERSCHAPSBANK 2002 ABN AMRO N. V. 1999 CHRISTIANIA 1997 FIRST CHICAGO TOKIO MDP 1999 NEW SOUTH WALES TREASURY CORP 2002 AFRICAN DEVELOPMENT BANK 2002 CNCEP 2001 FMO 2000 NIBC BANK 1999 ANZ BANKING GROUP LIMITED 2003 COMMONWEALTH BANK OF AUSTRALIA 2005 FORTIS BANQUE LUXEMBOURG 1999 NORTH RHINE – WESTPHALIA 2003 ARGENTARIA 1997 COMMERZBANK 1999 HAMBURGISCHE LANDESBANK 2001 NORDIC INVESTMENT BANK 2005 ARTESIA 2001 COMP DE FINANCEMENT FONCIER 2002 HYPO ALPE-ADRIA BANK 2001 OBEROESTERREICHISCHE LB 2002 ASIAN DEVELOPMENT BANK 2005 CREDIOP 2001 HYPO TIROL 2003 OESTERREICHISCHE KONTROLLBANK 2005 AUSTRIA (REPUBLIC OF) 2002 CREDIT AGRICOLE INDOSUEZ 2004 ING BANK NV 2004 PFANDBRIEFSTELLE 2004 BACOB 1997 CREDIT AGRICOLE SA 2006 INTER-AMERICAN DEVELOPMENT BANK 2008 RABOBANK 1999 BANK FUER ARBEIT UND WIRTSCHAFT 2001 CREDIT SUISSE INTERNATIONAL 2007 INTL BK FOR RECONSTRUCTION AND DEV 2010 RENTENBANK 2001 BANK NEDERLANDSE GEMENTEN 2002 DANSKE BANK 2005 INTL FINANCE CORPORATION 2001 ROYAL BANK OF CANADA 2005 BANK OF SCOTLAND 2004 DNB NOR BANK 1997 INSTITUTO CREDITO OFICIAL 2002 ROYAL BANK OF SCOTLAND 2000 BANK OF YOKOHAMA 2000 DEPFA BANK PLC 2005 KFW 2000 SE BANKEN 1997 BARCLAYS BANK PLC 2004 DEPFA DEUTSCHE PFANDBRIEF 2003 KOMMUNALBANKEN 2001 SGA SOCIETE GENERALE 2004 BAYERISCHE LANDESBANK 1998 DEPFA ACS BANK 2004 KOMMUNALKREDIT 2002 SUMITOMO CORP CAPITAL EUROPE 2004 BAYERISCHE VEREINSBANK 1997 DEXIA BIL 2001 KOMMUNEKREDIT 2001 SUMITOMO CORP CAPITAL NETHERLANDS 2000 BCEE 1998 DEXIA CREDIT LOCALE 2001 KOMMUNINVEST 2000 SWEDBANK MORTGAGE 2004 BCL INTERNATIONAL 2001 DEXIA FUNDING NETHERLANDS 2002 LANDESBANK BADEN-WURTTEMBERG 1999 SVENSKA HANDELSBANKEN 1999 BGB FINANCE (IRELAND) PLC 1998 DEXIA MUNICIPAL AGENCY 2005 L-BANK 2004 SWEDISH EXPORT CREDIT 2000 BNP PARIBAS 2004 DEUTSCHE BANK 2004 LLOYDS TSB BANK PLC 2001 TOYOTA MOTOR CREDIT CORPORATION 2008 BUSINESS DEVELOPMENT BK OF CANADA 2001 DRESDNER BANK 1998 MERRILL LYNCH & CO 2006 VENANTIUS 2000 DEVELOPMENT BANK OF JAPAN 2009 DZ BANK 2006 MITSUBISHI CORP FINANCE 2004 VORALBERGER LANDES-HYPO 2001 CAISSE CENTRALE DESJARDINS 1999 EKSPORTFINANS 1999 MITSUI & CO FIN SERVICES (EUROPE) 2005 WESTLAND UTRECHT HYPO 1999 CALYON 2004 EUROHYPO 2005 MUNICIPALITY FINANCE 2002 WESTPAC BANKING CORP 2004 CALYON FINANCE (GUERNSEY) LIMITED 2005 EXPORT DEV BANK OF CANADA 1999 NATIONWIDE 1996 WILLOW CAYMAN I LTD 2011 CANADIAN WHEAT BOARD 2001 EXPORT FIN & INSURANCE CORP 1999 NATIXIS 2007 * Year of first transaction. 22 Shinkin International
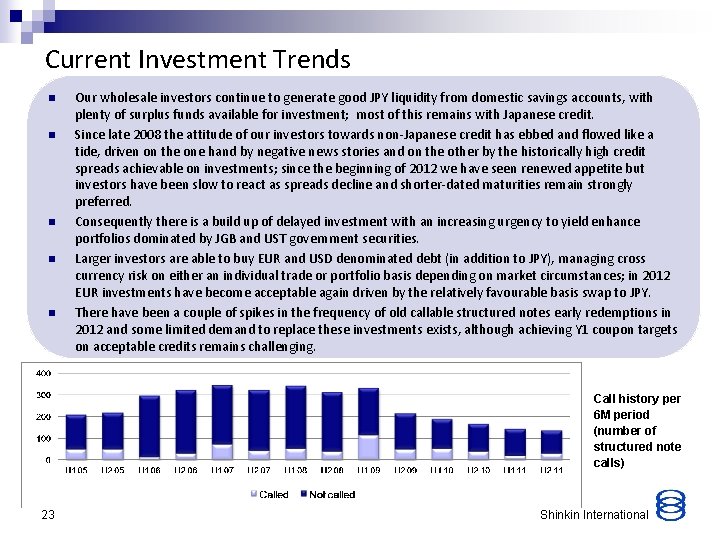
Current Investment Trends n n n Our wholesale investors continue to generate good JPY liquidity from domestic savings accounts, with plenty of surplus funds available for investment; most of this remains with Japanese credit. Since late 2008 the attitude of our investors towards non-Japanese credit has ebbed and flowed like a tide, driven on the one hand by negative news stories and on the other by the historically high credit spreads achievable on investments; since the beginning of 2012 we have seen renewed appetite but investors have been slow to react as spreads decline and shorter-dated maturities remain strongly preferred. Consequently there is a build up of delayed investment with an increasing urgency to yield enhance portfolios dominated by JGB and UST government securities. Larger investors are able to buy EUR and USD denominated debt (in addition to JPY), managing cross currency risk on either an individual trade or portfolio basis depending on market circumstances; in 2012 EUR investments have become acceptable again driven by the relatively favourable basis swap to JPY. There have been a couple of spikes in the frequency of old callable structured notes early redemptions in 2012 and some limited demand to replace these investments exists, although achieving Y 1 coupon targets on acceptable credits remains challenging. Call history per 6 M period (number of structured note calls) 23 Shinkin International
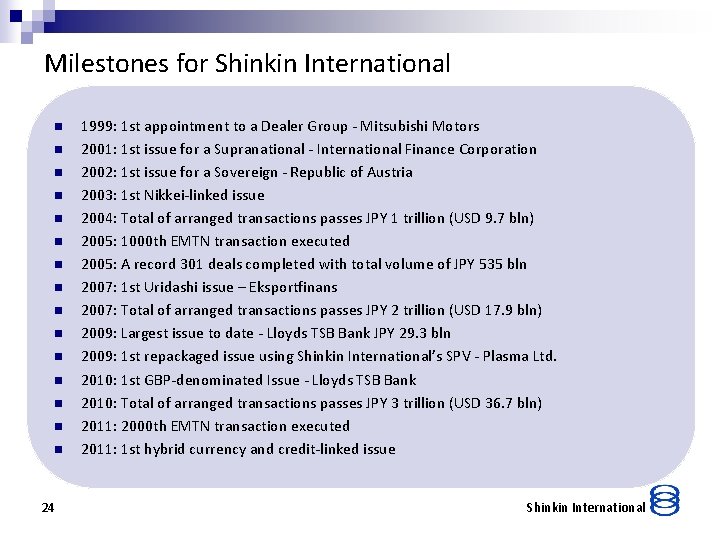
Milestones for Shinkin International n n n n 24 1999: 1 st appointment to a Dealer Group - Mitsubishi Motors 2001: 1 st issue for a Supranational - International Finance Corporation 2002: 1 st issue for a Sovereign - Republic of Austria 2003: 1 st Nikkei-linked issue 2004: Total of arranged transactions passes JPY 1 trillion (USD 9. 7 bln) 2005: 1000 th EMTN transaction executed 2005: A record 301 deals completed with total volume of JPY 535 bln 2007: 1 st Uridashi issue – Eksportfinans 2007: Total of arranged transactions passes JPY 2 trillion (USD 17. 9 bln) 2009: Largest issue to date - Lloyds TSB Bank JPY 29. 3 bln 2009: 1 st repackaged issue using Shinkin International’s SPV - Plasma Ltd. 2010: 1 st GBP-denominated Issue - Lloyds TSB Bank 2010: Total of arranged transactions passes JPY 3 trillion (USD 36. 7 bln) 2011: 2000 th EMTN transaction executed 2011: 1 st hybrid currency and credit-linked issue Shinkin International
Summary n Shinkin is a co-operative financial network of local banks located throughout Japan servicing individuals and small/ medium sized businesses. n Shinkin Central Bank acts as a central bank for all the shinkin banks and is one of Japan’s strongest banks, reflected by its A 1/A+ rating. n With deposits totaling USD 1, 549 billion equivalent, shinkin banks are active investors and, with assets of USD 372 billion, SCB is also one of Japan’s largest institutional investors. n Shinkin International’s relationships with SCB and the extensive shinkin bank network provides natural distribution for EMTN product. n Shinkin International ranked fourth as a 3 rd-party provider of JPY vanilla EMTNs in 2010 (MTNi – syndicated and self-issued excluded). 25 Shinkin International
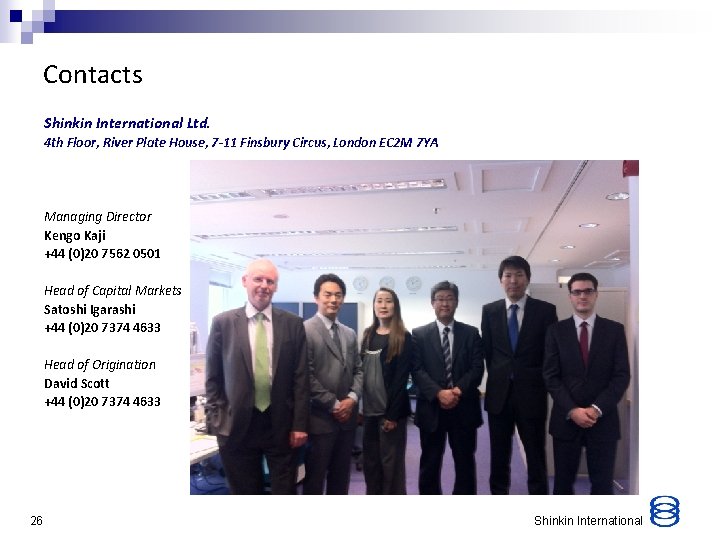
Contacts Shinkin International Ltd. 4 th Floor, River Plate House, 7 -11 Finsbury Circus, London EC 2 M 7 YA Managing Director Kengo Kaji +44 (0)20 7562 0501 Head of Capital Markets Satoshi Igarashi +44 (0)20 7374 4633 Head of Origination David Scott +44 (0)20 7374 4633 26 Shinkin International