Shear statistics in the lower troposphere and impacts


")
 •")


- Slides: 31
Shear statistics in the lower troposphere and impacts on DWL data interpretation G. D. Emmitt and S. Greco Simpson Weather Associates WG on Space-Based Lidar Winds Monterey, CA 5 – 8 February 2008
Wind Shear • Wind Shear is defined in NOAA Technical Memorandum NWS FCST-23 as “a change in horizontal wind speed and/or direction, and/or vertical speed with distance, measured in a horizontal and/or vertical direction” • As defined by the National Weather Service, Low-Level Wind Shear is wind shear of 5 m/s or more per 30 m (. 169 s-1) in a layer more than 60 m thick within the lowest 600 m of the atmosphere
Wind Shear • Vertical wind shear is not a scalar quantity, but a vector. Using just “speed shear” will often underestimate the amount of shear present. Direction of the horizontal winds must be considered as well • On benign days, wind shear values are typically < 0. 08 s-1. Wind shear meeting official criteria is 0. 169 s-1
NCEP SREF Aviation Products (Experimental)
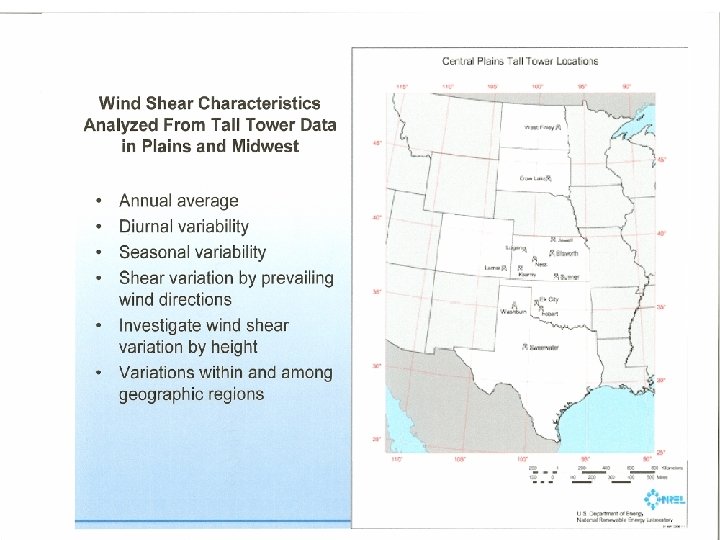
Wind Shear Climatologies • Very limited and usually averaged (hourly, monthly, seasonally, annually) • Deep layer (850 -200 mb) shear for tropics • Mostly based on tower level data (0 -150 m) Central Plains network α = ln(v 2/v 1)/ln(H 2/H 1)
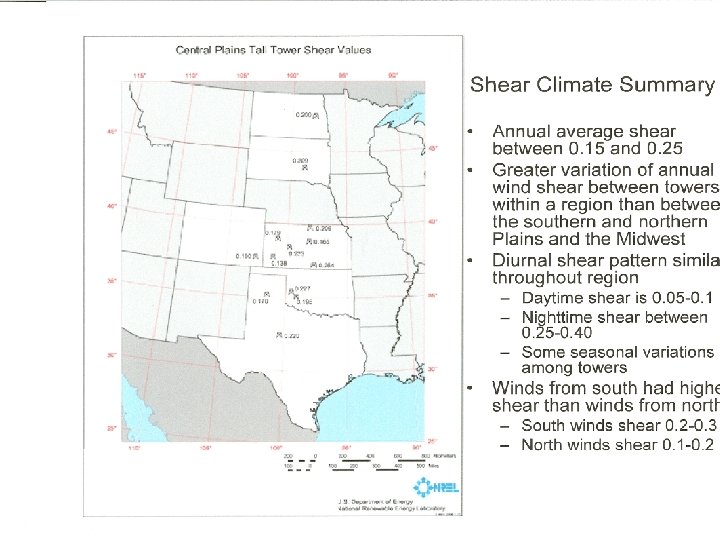
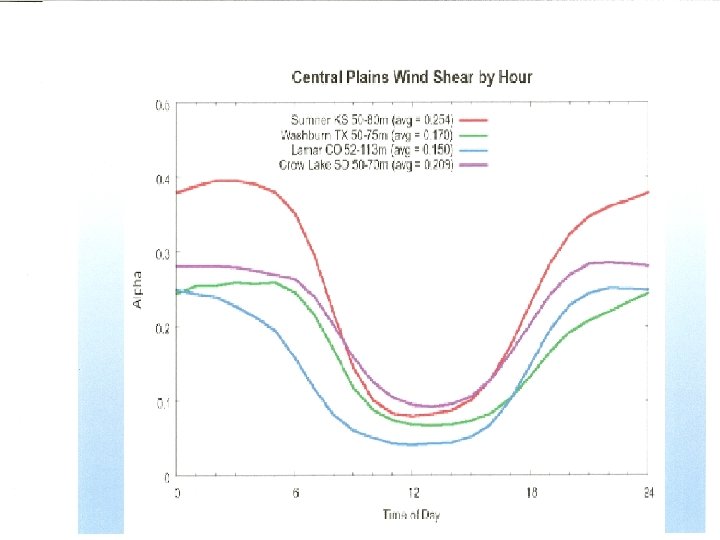
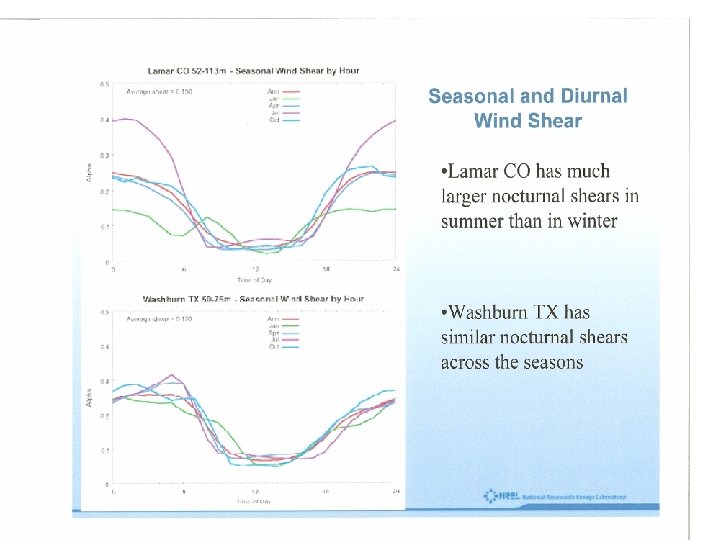
Wind Shear Climatologies From “Wind Resource and Wind Shear Characteristics at Elevated Heights” by Dennis Elliot (NREL/NWTC) (June 2006) for 150 m towers in the Central US. - Annual average shear between 0. 15 and 0. 25 (alpha) Greater variation of annual wind shear between towers within a region than between the southern and northern Plains and Midwest Diurnal shear pattern similar throughout region • Daytime shear is 0. 05 - 0. 1 • Nighttime shear between 0. 25 - 0. 40 • Some seasonal variations among towers
NASA Wind Shear Study NASA Technical Memorandum 82566 - Wind Speed and Direction Shears With Associated Vertical Motion During Strong Surface Winds (1984) NASA 150 -Meter Tower Facility at Kennedy Space Center 1) Below 90 m is the most active area for occurrence of events with wind speed shear >0. 1 s-1 and directional shear >1. 0 deg-1
NASA Wind Shear Study
NASA Wind Shear Study
TODWL vs. microwave tower
TODWL vs. microwave tower
TODWL vs. microwave tower
TODWL vs. microwave tower
Model Shear
Wind Shear
Wind Shear
Summary • Shear represents both a primary target of space-based observations and a challenge to signal processing • Shear represents a major source of bias in estimating an average wind over a layer • Ground based and airborne lidar with < 100 m pulse lengths provide excellent data bases for simulating space-based DWL observations of shear.