SHARING MODELS COIT SEPTEMBER 2013 Playground Sharing High

SHARING MODELS COIT SEPTEMBER 2013


Playground Sharing High Demand Lots of Kids & Pets Limited Capacity Few Desirable Toys, Snacks Mandates Right thing to do Mom made us Models & Tools Take Turns, Fight, Straws

Agenda • Our Problem: High Demand, Limited Capacity, Mandates • Sharing Models including Shared Services • Update: OU Shared Services • Possible IT Sharing for COIT

Institutional Sharing High Demand Near-record Enrollments High Expectation of Services Limited Capacity Funding, Facilities, Infrastructure, Services Mandates Graduate more students at lowest possible cost Models & Tools Service Frameworks, Purchasing Contracts, Committees, Collaboration, Cloud, Outsourcing

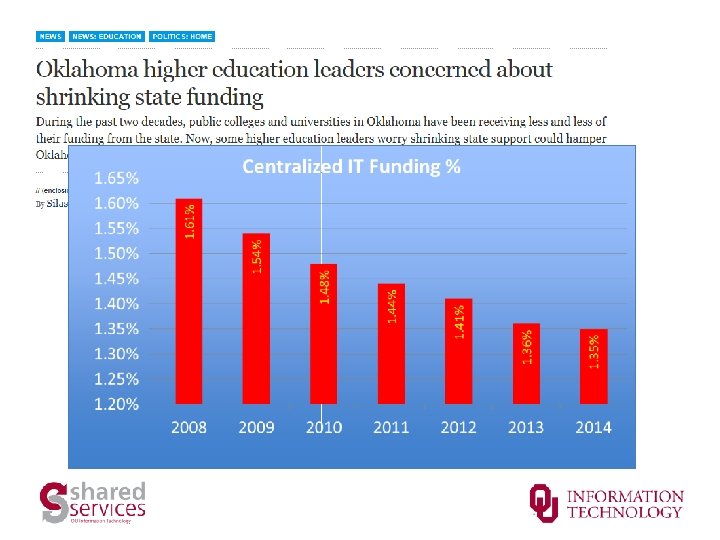
*Fall enrollment has increased by more than 14, 000 students since 2008. *Oklahoma State Regents for Higher Education

OU Norman Unique Network Devices Wifi Concurrent Peak May 2013 Sept 2013 32, 404 37, 475

2011 Higher Ed Compromise • Exempted from Consolidation • Created a State Regents’ CIO • Accomplish Governor’s goals: – Accountability – Transparency – Cost-efficiencies – Oversight Across 25 Oklahoma HE public institutions

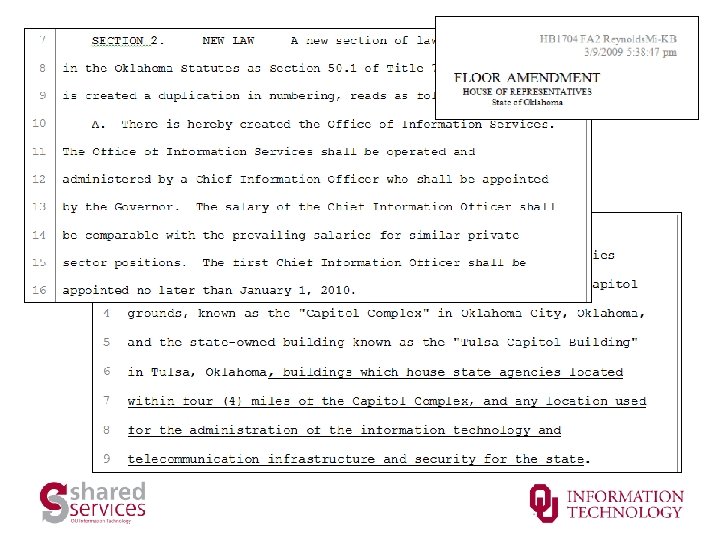
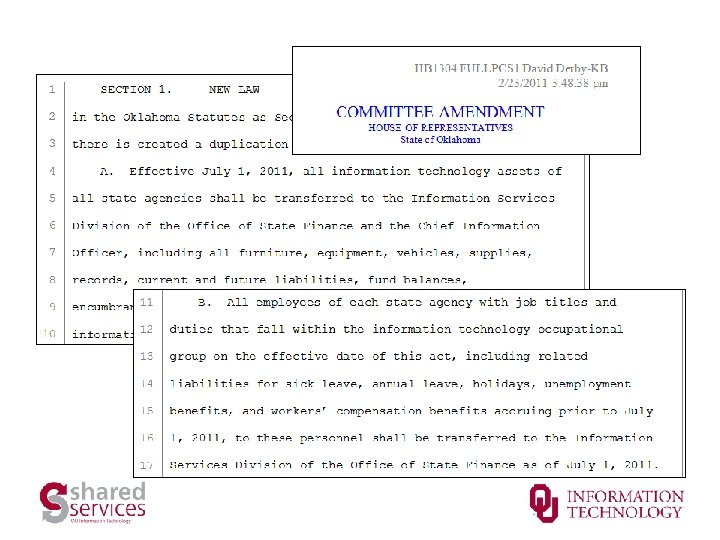
Recent Oklahoma Legislation Open Source and Open Standards Purchasing Policy House Bill 2197 (Murphey - Breechen) Shared Services Agency Consolidation House Bill 3053 (Steele - David) Creation of Unified IT Purchasing System House Bill 2939 (Derby - Brinkley) State CIO (2013) House Bill 2062 (Derby) Using Higher Ed Spend to Increase Purchasing Savings House Bill 2197 (Murphey - Breechen) Determining the Performance of Government Agencies House Bill 3053 (Steele - David)

“Push for state IT update targets Higher Ed” The Edmond Sun, Feb. 5, 2013 Governor Mary Fallin: Two years ago, I asked you to work with me and our state’s Chief Information Officer Alex Petit to consolidate and improve IT. As I said in my state of the State address then, state government can’t continue to operate like an 8 -track in an i. Pod world. Rep. Jason Murphey: The consolidation of information technology among agencies has been beneficial. But the lobbying strength of higher education institutions has been successful in exempting itself from reforming information technology. Higher education’s reluctance to give up control is a huge stumbling block in that effort. Higher education fought consolidation efforts last year so it could charge state agencies more money.

Restructure and reorganize administrative offices, academic departments, and other units (e. g. IT services, …) resulting in fewer personnel Consolidate and outsource services such as email and other information technology when cost-efficient Outsource all or selected IT functions; contract to use offsite servers; contract to use Blackboard’s servers; share and consolidate IT services

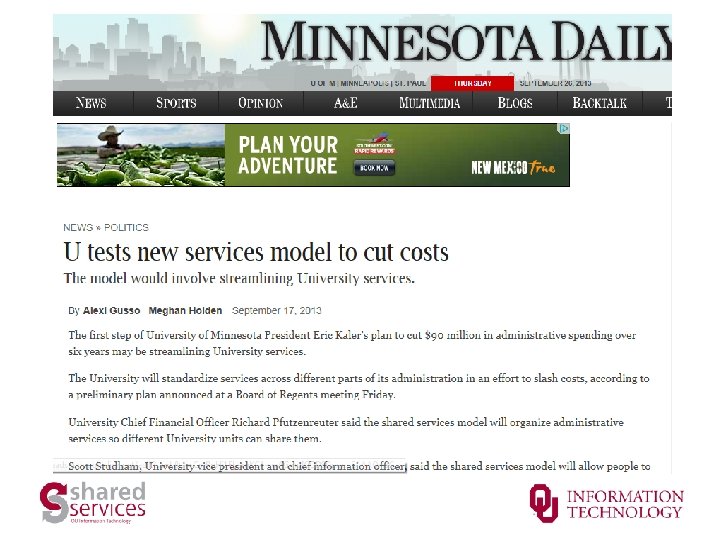
“For the last two to three years, our board is working closely with institutions on cost efficiency. We recognize that if we’re going to maintain the same level of access and service at our institutions, we have to bend the long-term cost curve. ” -Dominic Chavez, Texas Higher Education Coordinating Board

It is critical that we make sure that college is affordable for every single American who’s willing to work for it. Families and taxpayers can’t just keep paying more and more into an undisciplined system where costs just keep on going up and up. We’ll never have enough loan money, we’ll never have enough grant money, to keep up with costs that are going up 5, 6, 7 percent a year. We’ve got to get more out of what we pay for… President Obama July 24, 2013

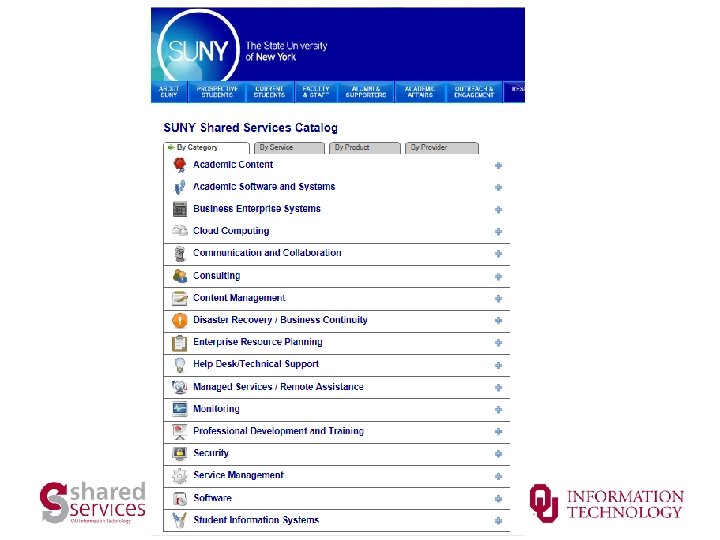
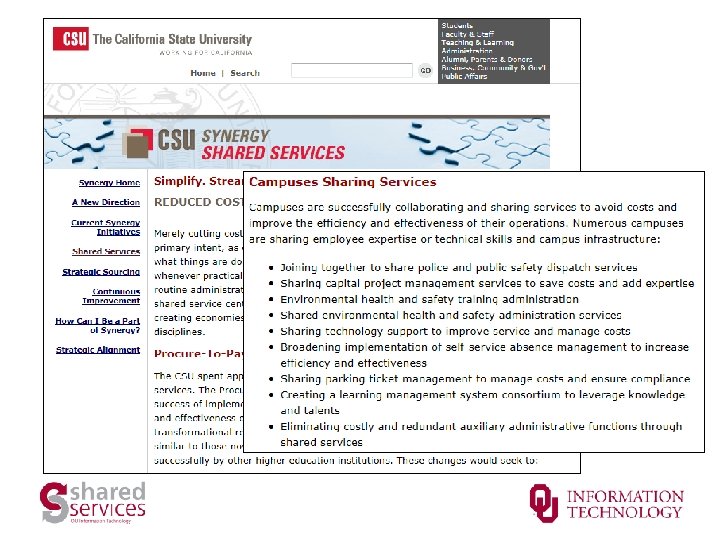
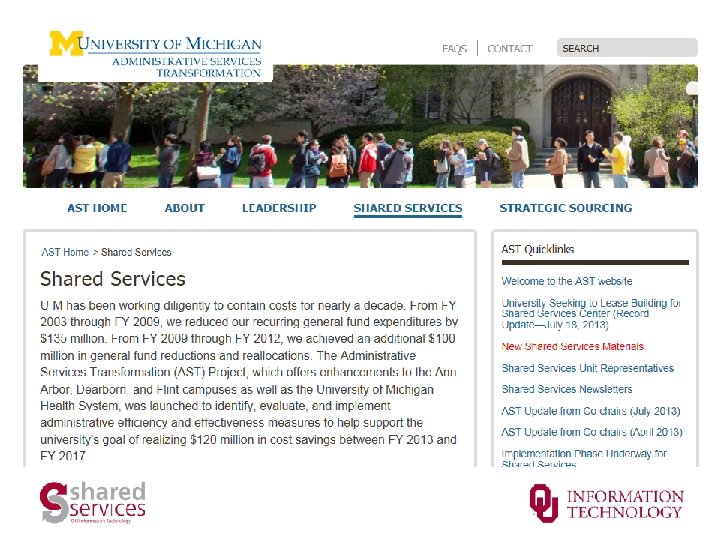
Across the Public Sector


Public Sector Sharing Factor Institutions High Demand Near-record Enrollments High Expectation of Services Limited Capacity Funding, Facilities, Infrastructure, Services Mandates Graduate more students at lowest possible cost Grants, Services, Contracts, Committees, Collaboration, Models & Tools Communities, Clouds, Outsourcing

State of Oklahoma Shared Services Center
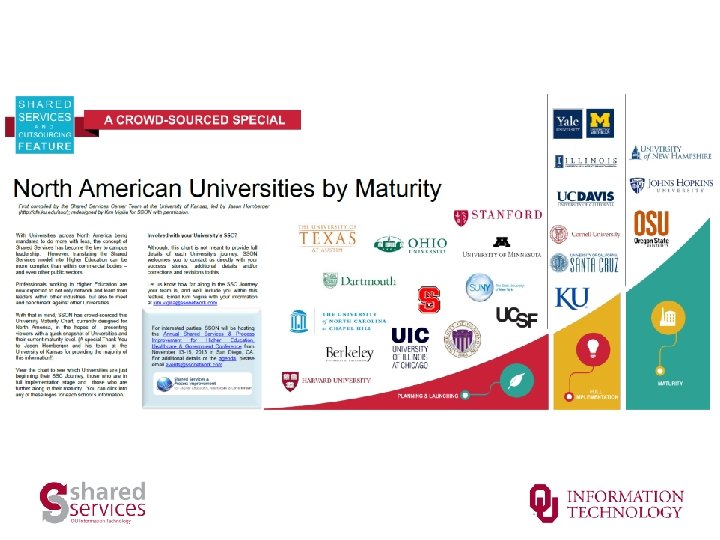
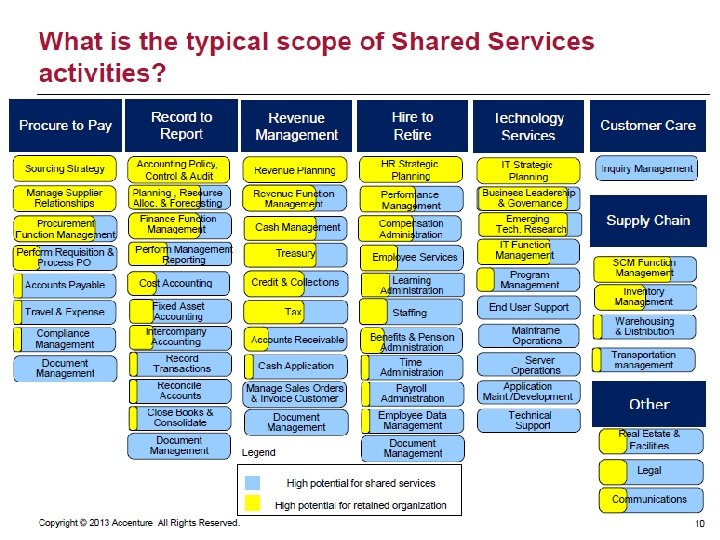

*Source: Harvard Shared Services Summit

OU Shared Services • • IT Function Only Significant Investment by OU Virtual Shared Services Center Cross-Campuses External Institutions and Affiliates Private Cloud Solution Building Blocks Insourcing: “Outsourced to ourselves” Local Campus Budgets

Virtual Shared Services Center • People First - No Consolidation • Management Team + Fractional Resources • Availability determined by local Director • Collaboration Tools • No Physical Workspace currently • Work Aligned to ITILv 3 Design, Transition, Operations

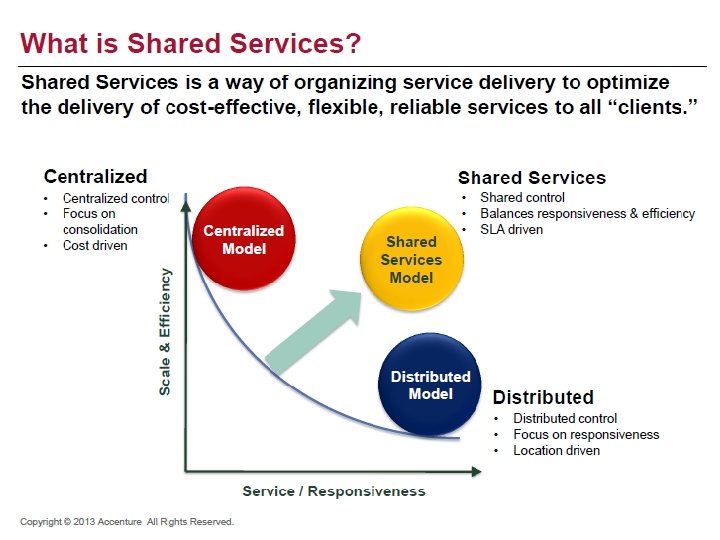
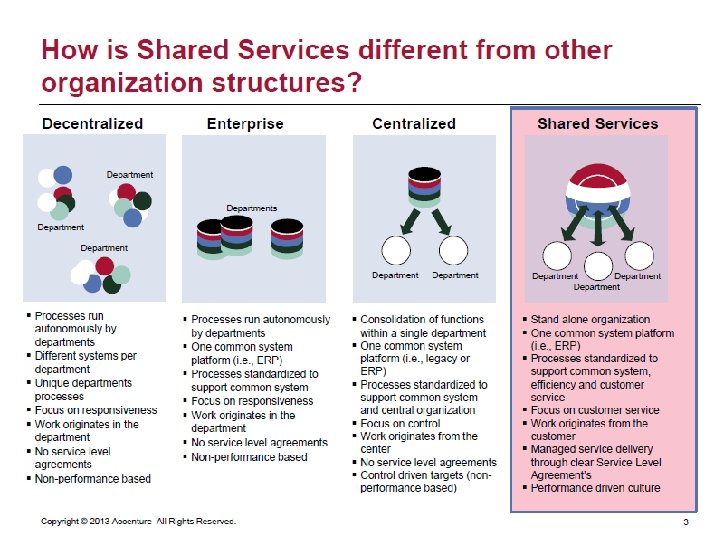
Shared Services

S 2 Program Timeline Design Workshops Complete August 2011 October 2011 HSC Data Center Live March 2012 Norman OU-Tulsa Data First Data Center Services Center Live October 2012 March 2013 April 2013

A Private Cloud for OU Virtual Operations Team Tri-campus design Geo-Redundant Purpose-Built for Universitywide services Standardized De-duplicated Cost efficient

OU IT Shared Services Live • • Data Center Co-Location Data Center Connectivity Block Storage (SAN) File Storage (NAS) Sharepoint Virtual Server Hosting Professional Services Pipeline • • Data Protection (Fall 2013) SQL Cluster (Fall 2013) Oracle Cluster (Fall 2013) Virtual Desktops (Fall 2013) Log Management (tbd) Archive Storage (tbd) Voice Services (tbd)

S 2 Acquisitions 5 Year Campus To-Date FY 14 -18 Total % Annual Norman 6, 853, 998 5, 980, 025 12, 834, 024 54% 2, 566, 805 HSC 5, 909, 973 4, 017, 805 9, 927, 778 42% 1, 985, 556 Tulsa 693, 045 167, 923 860, 968 4% 172, 194 TOTALS 13, 457, 016 10, 165, 753 23, 622, 769 100% 4, 724, 554

S 2 Acquisitions By Category 5 Yrs Category 5 Year Total Backups $1. 6 M DHCP/DNS $0. 6 M Facility $1. 2 M Network $7. 7 M Security $1. 9 M Storage $3. 1 M SQL Server Licensing $1. 0 M Tools $1. 7 M Virtualization $1. 3 M Voice $2. 8 M
 $15 M $18 M Cost Efficiencies Staffing Datacenter Purchases")
Cost Efficiency Goal (5 Years) $15 M $18 M Cost Efficiencies Staffing Datacenter Purchases De-Duplication Volume Discounts Energy Savings External Chargeback License Pooling Maintenance Savings *Business Process Efficiencies

Efficiency Examples Activity Type 5 Yr Projection Data center purchases 1. 5 M VMWare ELA License Pooling 300 K Microsoft ELA Volume Discount 2. 2 M Avaya Contract Maintenance 400 K Volume Discount 1 M Border Router Consolidation De-duplication 1. 6 M Sharepoint (5 departments) De-duplication 50 K DC Network sharing De-duplication 275 K One-Net Lambdas Enhanced Value 4. 6 M Maintenance 200 K Storage Sharing Initial Cisco DC Purchase Comm. Vault Example Totals: $12, 125, 000

Efficiency Example Activity Type 5 Yr Projection Data center purchases 1. 5 M VMWare ELA License Pooling 300 K Microsoft ELA Volume Discount 2. 2 M Avaya Contract Maintenance 400 K Volume Discount 1 M Border Router Consolidation De-duplication 1. 6 M Sharepoint (5 departments) De-duplication 50 K DC Network sharing De-duplication 275 K One-Net Lambdas Enhanced Value 4. 6 M Maintenance 200 K Storage Sharing Initial Cisco DC Purchase Comm. Vault Example Totals: $12, 125, 000

Initial Cisco DC Purchase Best OU Discount Before S 2: Standardized, Volume List Price $7, 129, 950 Discount Rate 40% Discount Rate 55% Total Discount $2, 851, 980 Total Discount $3, 921, 473 OU Price $4, 277, 970 OU Price $3, 208, 478 Savings $1, 069, 493

S 2 Staffing: Example Plan Role Director Managers Accounting/Billing Design Transition Operations Totals Salary + Benefits Weekly Monthly June 2013 Admin 32, 982 Design 18, 513 Current FTE Future FTE 0 4 0 3 0 5 12 1, 435, 000 27, 596 119, 583 1 4 1 6 0 12 24 2, 880, 000 55, 385 240, 000 Transition 437 Operations 33, 128 Total 85, 061 Budget 71%

S 2 Staffing: Example Impact Before S 2 After S 2 FY 12 Infrastructure Local Non Data Center Local Data Center *FY 16 Infrastructure Projected S 2 Staffing Projected Local Staff Transform Opportunity Staff Salary + Benefits 106 26 80 9, 311, 496 1, 714, 759 7, 596, 737 24 42 40 106 3, 000 3, 234, 107 3, 077, 390 9, 311, 496

Staffing: Driving to Versatility

Defining Work Units

Staff Skills

Virtual Badging • Tied to Cross-Training Goals • Social Media Feeds • Performance Management • Learning Times / Badge Stack • “Gamification” • Project Kicked-off
 Name Campus Clasby, Aaron HSC Coldwell, Gray Name Campus 0.")
Operations Team Members (orig) Name Campus Clasby, Aaron HSC Coldwell, Gray Name Campus 0. 4 Knipfer, Josh Tulsa 0. 1 HSC 0. 2 Wisby, David Tulsa 0. 1 Duree, Christopher HSC 0. 2 Walls, Steve Norman 0. 4 Fairless, Daniel HSC 0. 4 Gehrman, Bill Norman 0. 2 Ledford, Yvonne HSC 0. 1 Simpsen, Paul HSC 0. 2 Little, Amanda HSC 0. 4 Ma, Rosa Norman 0. 6 Miller, Tony HSC 0. 2 Keller, Cherry Norman 0. 2 Alcock, Bruce Norman 0. 4 Farha, Andrew Norman 0. 2 Sabatino, Chris Norman 0. 4 Cox, Jim Norman 0. 4 Mumma, Randy Norman 0. 2 Goforth, Mark HSC 0. 2 Robertson, Elliot Norman 0. 4 Johnson, Micheal Norman 0. 4 Fox, BJ Tulsa 0. 1 Qian, Gensheng Norman 0. 2 6. 6 FTE Day 0

v. Ops Scheduling

Monetizing Services • • Key Differentiator of Shared Services Difficult for IT as an industry True costs within an university are elusive Consumption Model is a new approach Transparency Sustainable Don’t make money; don’t lose money

3 New Datacenters

Data Center Space Facility Cabinets Rack Units *Reserved Available OKC 127 5, 334 1, 856 3, 478 Norman 124 5, 208 1, 604 3, 604 Tulsa - - TOTAL 251 10, 542 3, 460 7, 082 *Reserved cabinets and rack units are for the data center network

Data Center Co-Location Cost Co-Location Rack Unit Cost Monthly % Building Construction Cost 11. 15 60. 27% Rack/PDUs 0. 97 5. 24% Mechanical Maintenance 1. 16 6. 27% Safety & Monitoring 0. 21 1. 14% Diesel 0. 25 1. 35% Labor: Facility Management 2. 35 12. 70% Admin Overhead 2. 41 13. 03% Total without Utilities: Power and Chilled Water Total with Utilities: $18. 50 10. 50 $29. 00

Data Center Connectivity 1/10 Gig Ports Total Ports OKC 1, 378 Norman 1, 532 768 1, 402 608 0 2, 754 2, 934 Tulsa TOTAL 2, 910 2, 170 608 5, 688 Facility 1 Gig Ports *Projected after full build-out and includes ports used by IT

Data Center Connectivity Data Center Network Port Cost Data Center Network Hardware Maintenance Cross Campus Connection Data Center Network Cabling Labor: Data Center Network Management Load Balancers, DNS/DHCP IDS/IPS, Taps, Spans Firewalls Internet Bandwidth Monitoring Facility Charge Admin Overhead Total without Utilities: Power and Chilled Water 1 Gig 1/10 Gig % 5. 15 1. 86 1. 80 1. 15 6. 99 0. 93 2. 52 0. 78 1. 74 0. 56 8. 27 4. 76 8. 78 1. 86 1. 80 1. 15 6. 83 0. 93 2. 52 0. 78 1. 74 0. 56 8. 27 5. 28 8. 73 1. 93 1. 80 0. 96 7. 08 0. 95 2. 61 0. 92 1. 54 0. 56 10. 76 5. 67 19% 5% 4% 3% 17% 2% 6% 2% 4% 1% 23% 13% $36. 50 $40. 50 $43. 50 4. 50 $45. 00 $48. 00 Total with Utilities: $41. 00
 Storage Tier 3 Per Gig Cost Storage Hardware and Software Vendor")
Enterprise Block (SAN) Storage Tier 3 Per Gig Cost Storage Hardware and Software Vendor Maintenance and Support Network Port Charge: Storage Facility Charge Monitoring Labor: Storage Management Admin Overhead Total without Utilities: Power and Chilled Water Initial % *2. 5 X % 0. 032 0. 017 0. 006 0. 002 0. 013 0. 043 0. 017 24. 85% 12. 78% 4. 72% 1. 18% 10. 06% 33. 36% 13. 04% 0. 017 0. 013 0. 002 0. 001 0. 005 0. 020 0. 009 25. 45% 19. 28% 3. 65% 1. 94% 7. 66% 28. 99% 13. 04% $0. 130 $0. 068 0. 03 Total with Utilities: $0. 16 $0. 098 *2. 5 X price projection based on initial purchase of 429 TB growing to 1, 072 TB

Enterprise Backup Per Gig Cost *Avg Cost % Comm. Vault Enterprise Software Compellent Disk Arrays Servers Network Port Charge: Enterprise Backup Facility Charge Monitoring Labor: Backup and Restore Admin Overhead 0. 09 0. 06 0. 01 0. 07 0. 04 31% 20% 5% 2% 25% 13% Total without Utilities: $0. 30 Utilities: Power and Chilled Water Retention Price/Gig 15 Days $0. 25 30 Days $0. 35 45 Days $0. 45 60 Days $0. 55 0. 01 Total with Utilities: $0. 31 *Average Cost Blended over 5 Years with 2 X Compellent Growth

Virtual Server Hosting Per Hosted VM Server and Blade Network Hardware Warranty Extension (48 mos) VMWare Licensing VMWare Software Support Virus Scan Solution Network Port Charge: VMWare Cluster Facility Hosting Charge Bandwidth Monitoring Labor: VMWare Cluster Administration Storage Bundle 50 Gigs Admin Overhead Total without Utilities: Power and Chilled Water Base VM* Upgrade** % 3. 73 0. 38 1. 94 2. 33 0. 44 0. 45 0. 23 3. 91 3. 78 27. 59 3. 43 7. 23 2. 79 0. 28 1. 45 1. 75 0. 33 0. 34 0. 17 2. 93 2. 84 6. 72% 0. 68% 3. 50% 4. 20% 0. 79% 0. 81% 0. 42% 7. 05% 6. 83% 49. 77% 6. 19% 13. 04% $55. 44 $14. 82 1. 84 0. 08 Total with Utilities: $57. 38 1. 93 $15. 00 *1, 350 Base Capacity OR **1, 800 Upgrade Capacity

Virtual Server Pricing Configuration Shared Max. Resource Use Price v. Gig v. CPU v. NIC Monthly 3 YR Total 4 YR Total VM (1 v. Gig/1 v. CPU/1 v. NIC) Shared Max 1 1 1 55 1, 980 2, 640 VM (2 v. Gig/1 v. CPU/1 v. NIC) Shared Max 2 1 1 70 2, 520 3, 360 VM (3 v. Gig/2 v. CPU/2 v. NIC) Shared Max 3 2 2 85 3, 060 4, 080 VM (4 v. Gig/2 v. CPU/2 v. NIC) Shared Max 4 2 2 100 3, 600 4, 800 VM (5 v. Gig/2 v. CPU/2 v. NIC) Shared Max 5 2 2 115 4, 140 5, 520 VM (6 v. Gig/3 v. CPU/3 v. NIC) Shared Max 6 3 2 130 4, 680 6, 240 VM (7 v. Gig/3 v. CPU/3 v. NIC) Shared Max 7 3 3 145 5, 220 6, 960 VM (8 v. Gig/4 v. CPU/3 v. NIC) Shared Max 8 4 3 160 5, 760 7, 680 VM (9 v. Gig/4 v. CPU/3 v. NIC) Shared Max 9 4 3 175 6, 300 8, 400 VM (10 v. Gig/5 v. CPU/3 v. NIC) Shared Max 10 5 3 190 6, 840 9, 120 VM (11 v. Gig/5 v. CPU/3 v. NIC) Shared Max 11 5 3 205 7, 380 9, 840 VM (12 v. Gig/6 v. CPU/4 v. NIC) Shared Max 12 6 4 220 7, 920 10, 560 VM (13 v. Gig/6 v. CPU/4 v. NIC) Shared Max 13 6 4 235 8, 460 11, 280 VM (14 v. Gig/7 v. CPU/4 v. NIC) Shared Max 14 7 4 250 9, 000 12, 000 VM (15 v. Gig/7 v. CPU/4 v. NIC) Shared Max 15 7 4 265 9, 540 12, 720 VM (16 v. Gig/8 v. CPU/4 v. NIC) Shared Max 16 8 4 280 10, 080 13, 440 Custom Shared or Reserved Resources Contact us

S 2 5 Yr Value Projection Investment Original Purpose Value Upfront Cost Efficiencies IT Staff Return Excess Capacity Return $29 M $43 M $15 M $10 M $68 M Total Return: 2. 3 : 1 Department Value TBD University Value TBD

Institutional Sharing High Demand Near-record Enrollments High Expectation of Services Limited Capacity Funding, Facilities, Infrastructure, Services Mandates Graduate more students at lowest possible cost Models & Tools Service Frameworks, Purchasing Contracts, Committees, Collaboration, Cloud, Outsourcing

Possible COIT Sharing Model • Continue to Build Shared Key Contracts • Develop Framework for Sharing Services • Web Catalog – Service Description – Pricing – Contact – OSRHE Hosts? – Capture Savings for Von • Each Institution Contributes & Consumes as Desired – “Big” and “Little” services, resources, expertise • Some services will require common Id. M • Cross-Jurisdictional Sharing Common in Public Sector but NOT in Higher Education

Questions Discussion Thank you!

HORTON@OU. EDU @HORTONHEARSYOU
- Slides: 87