
Shanghai Subway and Quality Control for Meta SUB

Shanghai Subway and Quality Control for Meta. SUB Anyi Tang, Wanwan Hou, Sibo Zhu, Tao Qing, Yuanting Zheng, Leming Shi Center for Pharmacogenomics School of Pharmacy and School of Life Sciences Fudan University Shanghai, China The First Meta. SUB Summit New York, NY, USA June 20, 2015 Micro. Array and Sequencing Quality Control

Welcome to Shanghai! • The biggest economic, financial, trade and shipping hub in China • Population: >24 million 2
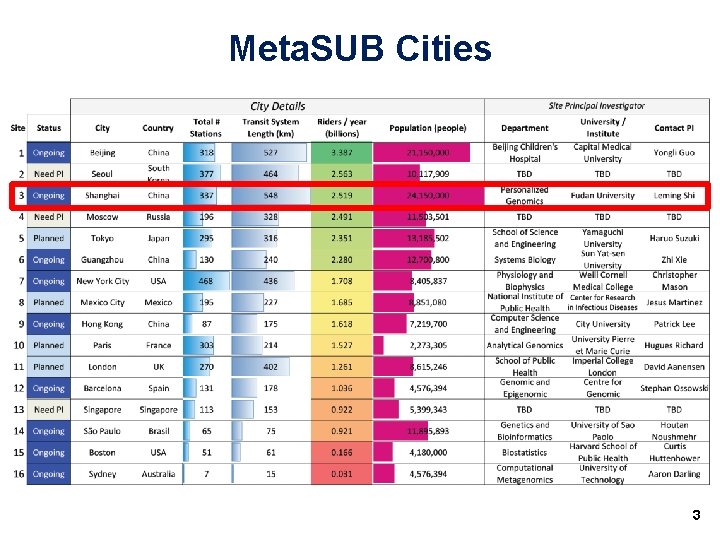
Meta. SUB Cities 3
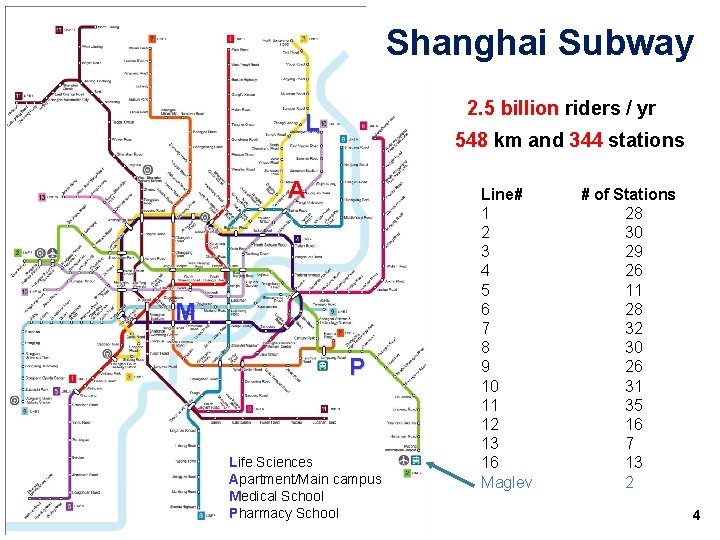
Shanghai Subway 2. 5 billion riders / yr L 548 km and 344 stations A M P Life Sciences Apartment/Main campus Medical School Pharmacy School Line# 1 2 3 4 5 6 7 8 9 10 11 12 13 16 Maglev # of Stations 28 30 29 26 11 28 32 30 26 31 35 16 7 13 2 4
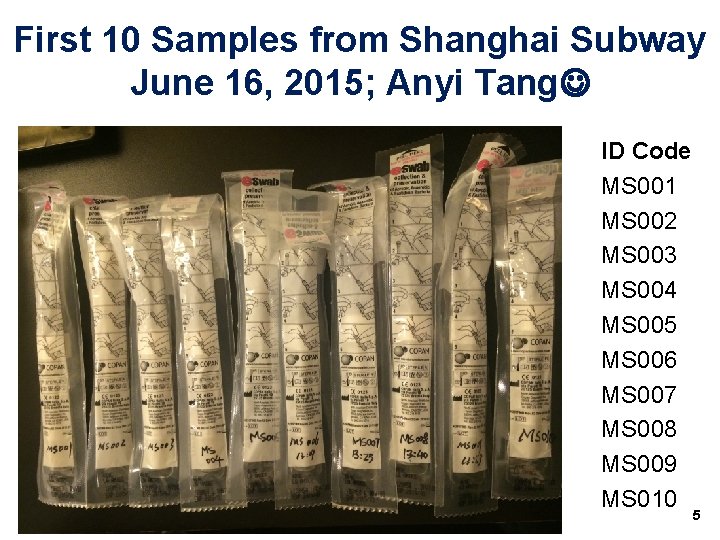
First 10 Samples from Shanghai Subway June 16, 2015; Anyi Tang ID Code MS 001 MS 002 MS 003 MS 004 MS 005 MS 006 MS 007 MS 008 MS 009 MS 010 5

Meta. SUB Shanghai @ Fudan University • • • Micro. Array and Sequencing Quality Control Sample collection Sample processing Sequencing Bioinformatics Coordination
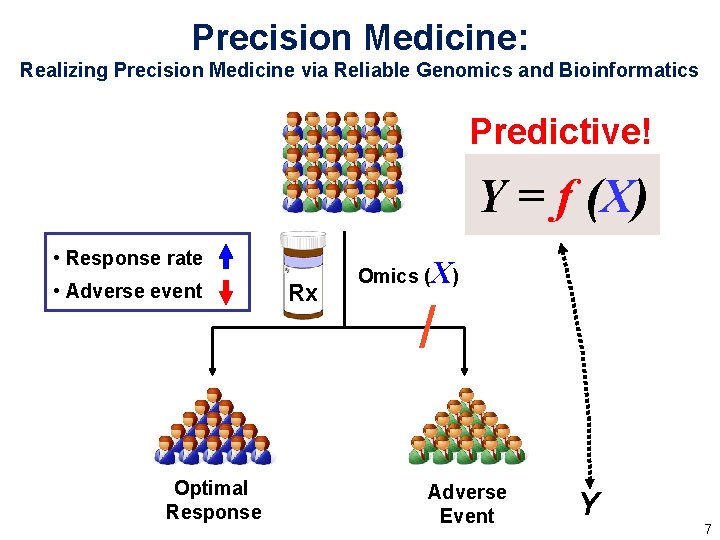
Precision Medicine: Realizing Precision Medicine via Reliable Genomics and Bioinformatics Predictive! Y = f (X) • Response rate • Adverse event Optimal Response Rx Omics ( X) / Adverse Event Y 7
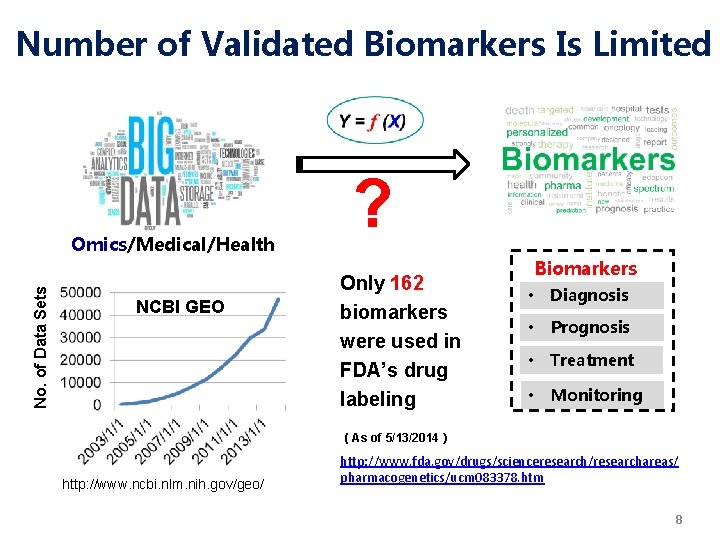
Number of Validated Biomarkers Is Limited No. of Data Sets Omics/Medical/Health NCBI GEO ? Only 162 biomarkers were used in FDA’s drug labeling Biomarkers • Diagnosis • Prognosis • Treatment • Monitoring (As of 5/13/2014) http: //www. ncbi. nlm. nih. gov/geo/ http: //www. fda. gov/drugs/scienceresearch/researchareas/ pharmacogenetics/ucm 083378. htm 8
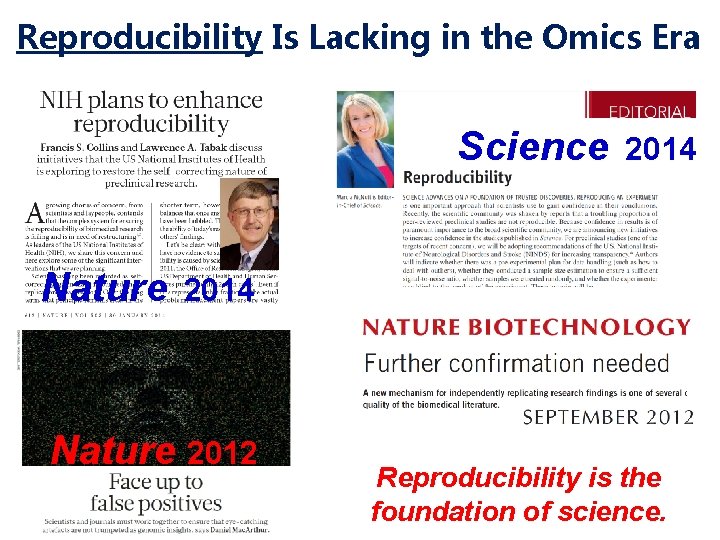
Reproducibility Is Lacking in the Omics Era Science Nature 2014 Nature 2012 Reproducibility is the foundation of science.
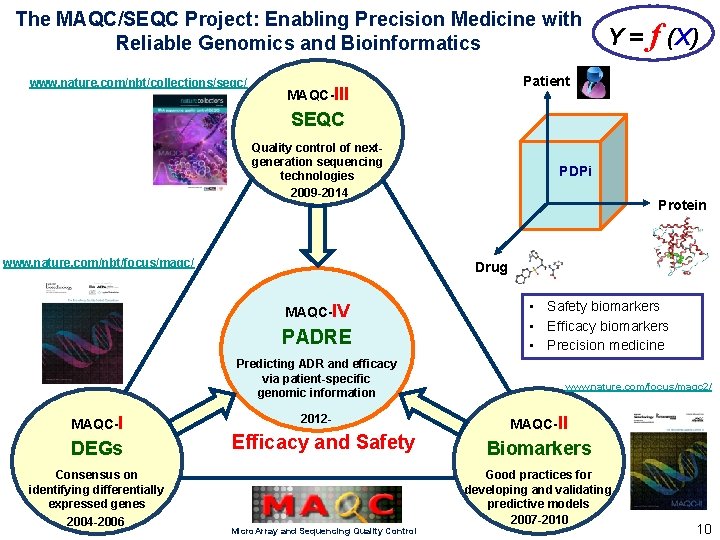
The MAQC/SEQC Project: Enabling Precision Medicine with Reliable Genomics and Bioinformatics www. nature. com/nbt/collections/seqc/ Y = f (X) Patient MAQC-III SEQC Quality control of nextgeneration sequencing technologies 2009 -2014 www. nature. com/nbt/focus/maqc/ PADRE Predicting ADR and efficacy via patient-specific genomic information DEGs 2012 - Efficacy and Safety Consensus on identifying differentially expressed genes 2004 -2006 Protein Drug MAQC-IV MAQC-I PDPi Micro. Array and Sequencing Quality Control • Safety biomarkers • Efficacy biomarkers • Precision medicine www. nature. com/focus/maqc 2/ MAQC-II Biomarkers Good practices for developing and validating predictive models 2007 -2010 10
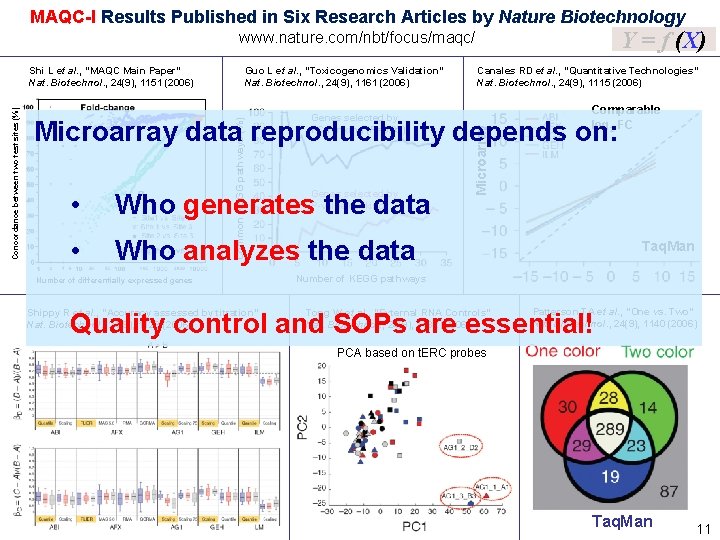
MAQC-I Results Published in Six Research Articles by Nature Biotechnology Y = f (X) www. nature. com/nbt/focus/maqc/ Guo L et al. , “Toxicogenomics Validation” Nat. Biotechnol. , 24(9), 1161 (2006) Genes selected by FC-ranking (P<0. 05) Canales RD et al. , “Quantitative Technologies” Nat. Biotechnol. , 24(9), 1115 (2006) Comparable log 2 FC • Who generates the data • Who analyzes the data Number of differentially expressed genes Shippy R et al. , “Accuracy assessed by titration” Nat. Biotechnol. , 24(9), 1123 (2006) Genes selected by P-value ranking Microarray data reproducibility depends on: Common KEGG pathways (%) Concordance between two test sites (%) Shi L et al. , “MAQC Main Paper” Nat. Biotechnol. , 24(9), 1151 (2006) Taq. Man Number of KEGG pathways Tong W et al. , “External RNA Controls” Nat. Biotechnol. , 24(9), 1132 (2006) Patterson TA et al. , “One vs. Two” Nat. Biotechnol. , 24(9), 1140 (2006) Quality control and SOPs are essential! PCA based on t. ERC probes Taq. Man 11
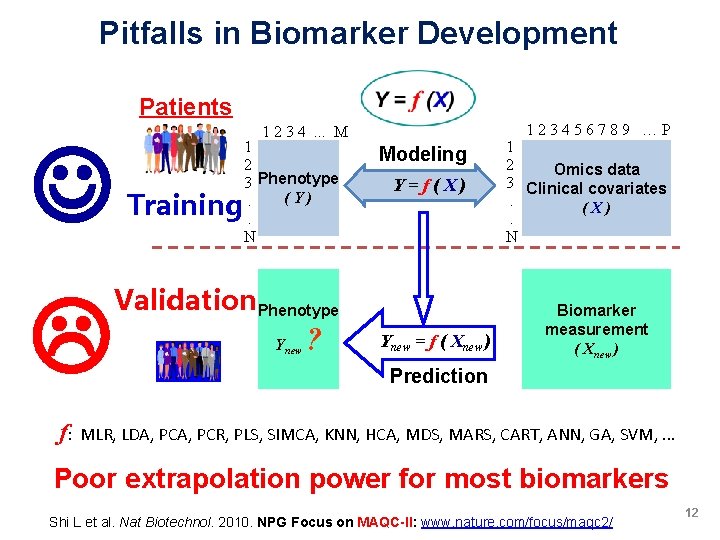
Pitfalls in Biomarker Development Patients f: 123456789 …P 1 2 3 4. . . M Training 1 2 3 Phenotype (Y). . N Modeling Y=f(X) Validation. Phenotype Ynew ? Ynew = f ( Xnew ) 1 2 Omics data 3 Clinical covariates. (X). N Biomarker measurement ( Xnew ) Prediction MLR, LDA, PCR, PLS, SIMCA, KNN, HCA, MDS, MARS, CART, ANN, GA, SVM, . . . Poor extrapolation power for most biomarkers Shi L et al. Nat Biotechnol. 2010. NPG Focus on MAQC-II: www. nature. com/focus/maqc 2/ 12
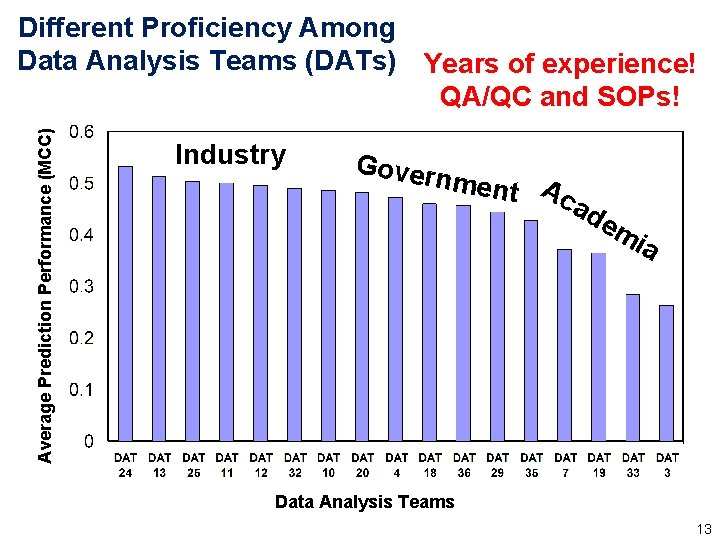
Average Prediction Performance (MCC) Different Proficiency Among Data Analysis Teams (DATs) Years of experience! QA/QC and SOPs! Industry Gover nm ent Ac ad e mi a Data Analysis Teams 13
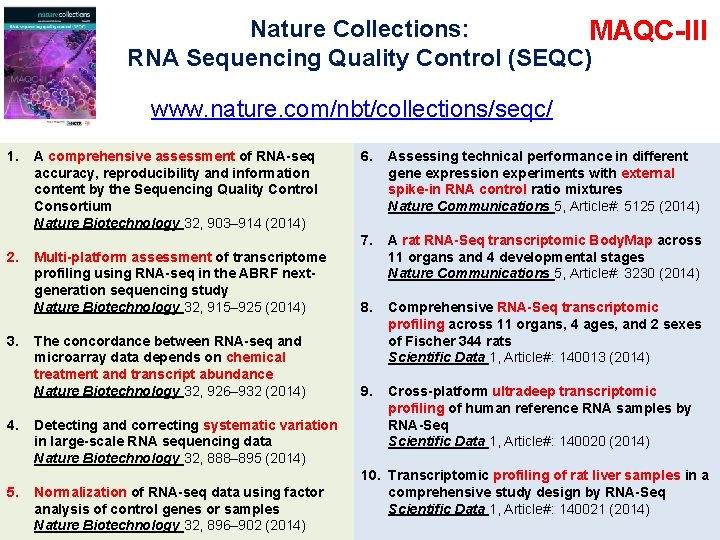
Nature Collections: MAQC-III RNA Sequencing Quality Control (SEQC) www. nature. com/nbt/collections/seqc/ 1. 2. 3. 4. 5. 6. Assessing technical performance in different gene expression experiments with external spike-in RNA control ratio mixtures Nature Communications 5, Article#: 5125 (2014) 7. Multi-platform assessment of transcriptome profiling using RNA-seq in the ABRF nextgeneration sequencing study Nature Biotechnology 32, 915– 925 (2014) A rat RNA-Seq transcriptomic Body. Map across 11 organs and 4 developmental stages Nature Communications 5, Article#: 3230 (2014) 8. The concordance between RNA-seq and microarray data depends on chemical treatment and transcript abundance Nature Biotechnology 32, 926– 932 (2014) Comprehensive RNA-Seq transcriptomic profiling across 11 organs, 4 ages, and 2 sexes of Fischer 344 rats Scientific Data 1, Article#: 140013 (2014) 9. Cross-platform ultradeep transcriptomic profiling of human reference RNA samples by RNA-Seq Scientific Data 1, Article#: 140020 (2014) A comprehensive assessment of RNA-seq accuracy, reproducibility and information content by the Sequencing Quality Control Consortium Nature Biotechnology 32, 903– 914 (2014) Detecting and correcting systematic variation in large-scale RNA sequencing data Nature Biotechnology 32, 888– 895 (2014) Normalization of RNA-seq data using factor analysis of control genes or samples Nature Biotechnology 32, 896– 902 (2014) 10. Transcriptomic profiling of rat liver samples in a comprehensive study design by RNA-Seq Scientific Data 1, Article#: 140021 (2014)
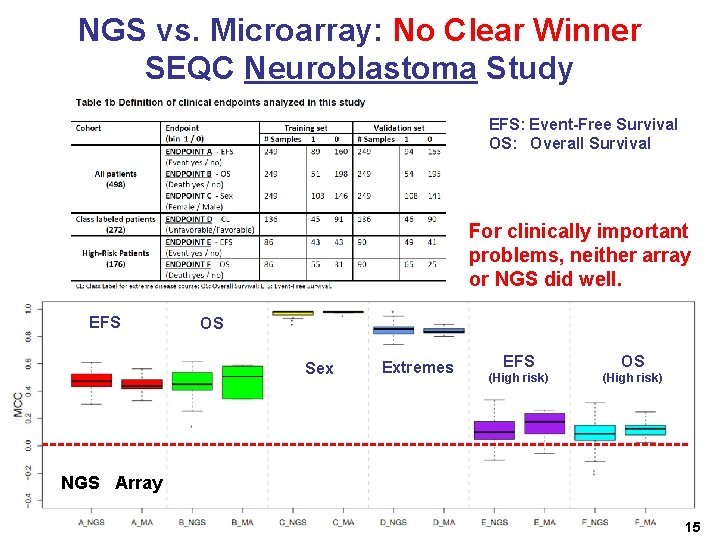
NGS vs. Microarray: No Clear Winner SEQC Neuroblastoma Study EFS: Event-Free Survival OS: Overall Survival For clinically important problems, neither array or NGS did well. EFS OS Sex Extremes EFS OS (High risk) NGS Array 15

Metagenomic Analysis of Unmapped Human RNA-Seq Reads M. Chierici 1, A. Zandonà 1, G. Jurman 1, H. Falk 2, M. Fischer 2, L. Shi 3, C. Furlanello 1 1 Fondazione Bruno Kessler, Trento, Italy 2 University Children's Hospital, Cologne, Germany 3 Fudan University, Shanghai, China RNA-Seq preprocessing by SEQC
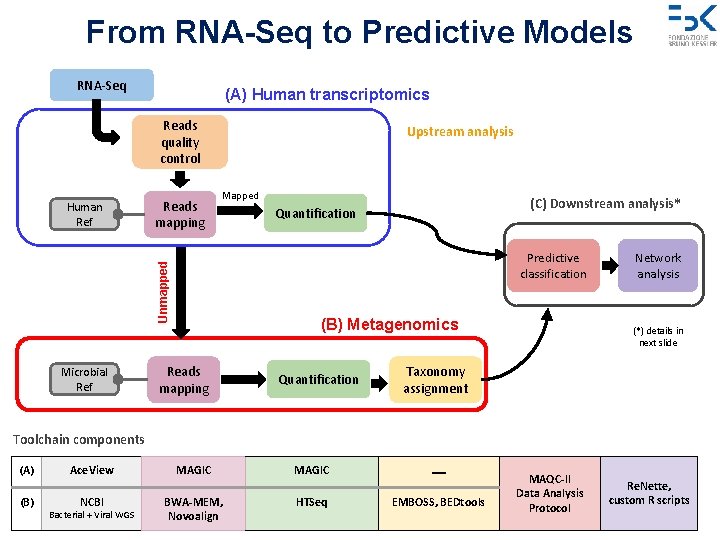
From RNA-Seq to Predictive Models RNA-Seq (A) Human transcriptomics Reads quality control Reads mapping Mapped Microbial Ref (C) Downstream analysis* Quantification Predictive classification Unmapped Human Ref Upstream analysis (B) Metagenomics Reads mapping Quantification Network analysis (*) details in next slide Taxonomy assignment Toolchain components (A) (B) Ace. View NCBI Bacterial + Viral WGS MAGIC BWA-MEM, Novoalign MAGIC HTSeq — EMBOSS, BEDtools MAQC-II Data Analysis Protocol Re. Nette, custom R scripts
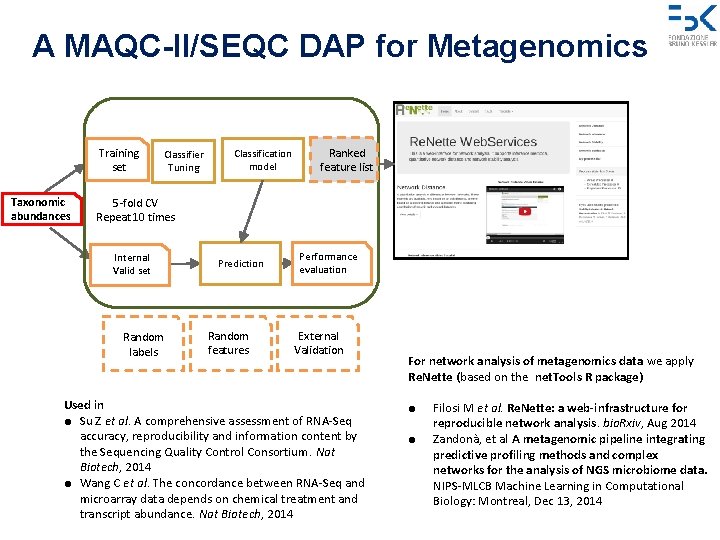
A MAQC-II/SEQC DAP for Metagenomics Training set Taxonomic abundances Classifier Tuning Classification model Ranked featurelist 5 -fold CV Repeat 10 times Internal Valid set Random labels Prediction Random features Performance evaluation External Validation Used in ● Su Z et al. A comprehensive assessment of RNA-Seq accuracy, reproducibility and information content by the Sequencing Quality Control Consortium. Nat Biotech, 2014 ● Wang C et al. The concordance between RNA-Seq and microarray data depends on chemical treatment and transcript abundance. Nat Biotech, 2014 For network analysis of metagenomics data we apply Re. Nette (based on the net. Tools R package) ● ● Filosi M et al. Re. Nette: a web-infrastructure for reproducible network analysis. bio. Rxiv, Aug 2014 Zandonà, et al A metagenomic pipeline integrating predictive profiling methods and complex networks for the analysis of NGS microbiome data. NIPS-MLCB Machine Learning in Computational Biology: Montreal, Dec 13, 2014
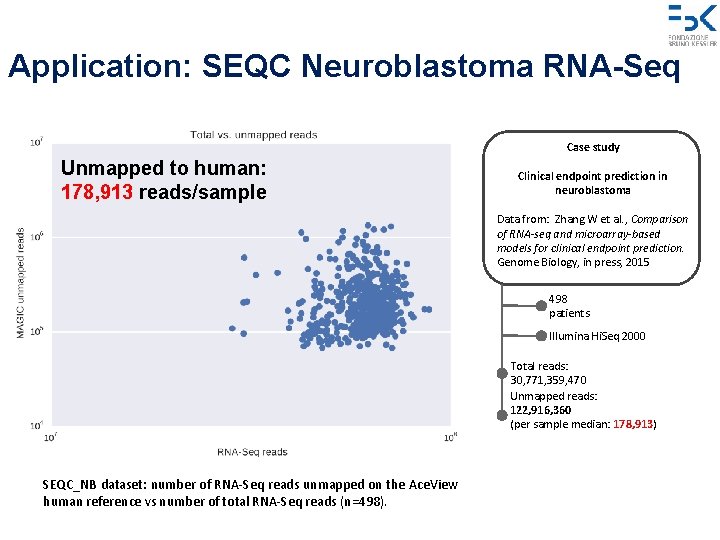
Application: SEQC Neuroblastoma RNA-Seq Case study Unmapped to human: 178, 913 reads/sample Clinical endpoint prediction in neuroblastoma Data from: Zhang W et al. , Comparison of RNA-seq and microarray-based models for clinical endpoint prediction. Genome Biology, in press, 2015 498 patients Illumina Hi. Seq 2000 Total reads: 30, 771, 359, 470 Unmapped reads: 122, 916, 360 (per sample median: 178, 913) SEQC_NB dataset: number of RNA-Seq reads unmapped on the Ace. View human reference vs number of total RNA-Seq reads (n=498).
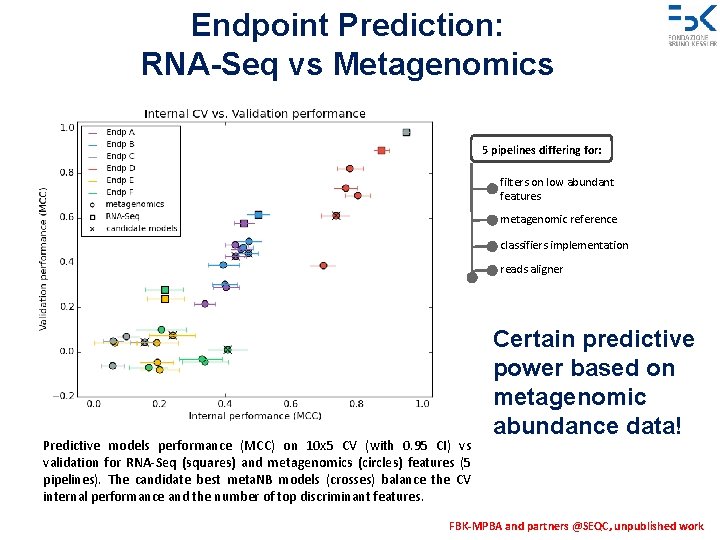
Endpoint Prediction: RNA-Seq vs Metagenomics 5 pipelines differing for: filters on low abundant features metagenomic reference classifiers implementation reads aligner Predictive models performance (MCC) on 10 x 5 CV (with 0. 95 CI) vs validation for RNA-Seq (squares) and metagenomics (circles) features (5 pipelines). The candidate best meta. NB models (crosses) balance the CV internal performance and the number of top discriminant features. Certain predictive power based on metagenomic abundance data! FBK-MPBA and partners @SEQC, unpublished work
Discussion on Meta. SUB • Data quality • Data analysis • Teamwork • Timeline 21 Micro. Array and Sequencing Quality Control
Acknowledgments Thank you! Leming. Shi@Fudan. edu. cn +86 -18616827008
- Slides: 22