SHALE GAS DRILLING EVER GET THESE EMAILS Heres


 with")


 size, casing plan, mud")


 On-structure (“In-field”, Appraisal) Normal Success Rate = +/-")


 • Costs per Foot (FOOTAGE")

 • Unplanned drill breaks: stuck pipe, lost circulation, required fishing trip,")


 Reserves – 90 % chance")

- Slides: 70
SHALE GAS DRILLING
EVER GET THESE EMAILS… Here’s my. AM problems with > Here's Sent: Thu, an. February astonishing 10, read. 2011 Important 11: 33: 09 Subject: and verifiable Comments? information: these well intended messages: > A About > new drilling 6 months technique ago, 1. the is opening writer up vast from the News Oftenwas quoted fields of previously watching a news program out-of-reach on oil and in one the of Media western the Forbes United Bros. States, was the helping guest. reverse The host a two-decade said to Forbes, decline "I amingoing domestic to ask production you a 2. Often quoted out of context of crude. direct question and I would like a direct 3. Supposed “reserves” data given answer; how much oil does the U. S. have Companies in the ground? " are Forbes investing didbillions not miss of dollars astating beat, what level of without to get he said, at "more oil deposits than all scattered the Middle across Eastthose North put numbers are reserves Dakota, Colorado, Texas and California. By together. " 2015, oil executives and > the without 4. analysts Claimssay, made new > Thefields U. S. could Geological yield as. Service much as issued 2 million a of what the real knowledge barrelsinof. April report oil a 2008 day --that more only than scientists the entire and energy picture is Gulf oil men of Mexico knew was produces coming, now…. but man was it big… 5. It takes hours to unravel one of those emails, to cross check data, look up reserves, compare like terms, etc.
Energy Overview Reserves Analysis Well Design & Drilling Fracking Problems 3
Energy Overview
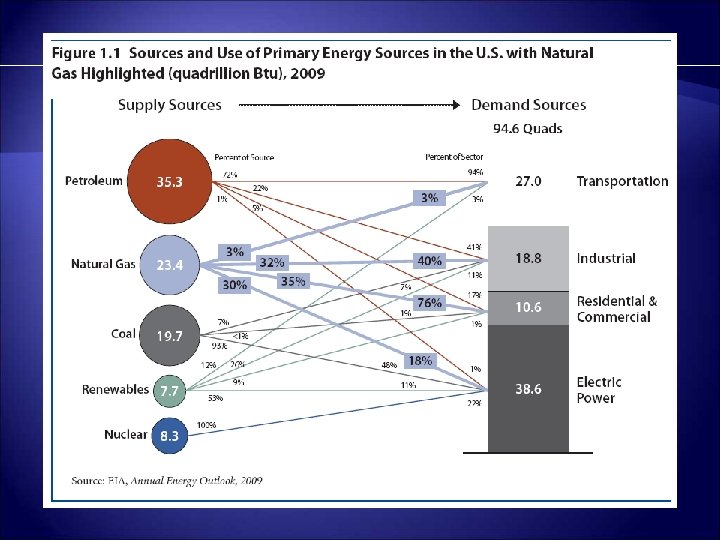
Estimated US Energy Use – 2009 Nuclear 9%c Hydro 3% Natural Gas 25% Coal 21% Oil 37% Other 5% Energy Sources Energy Wasted 58% Residential 12% Commercial 9% Energy Uses Industrial 23% Transport 29%
Estimated US Energy Use – 2009 Energy Wasted 58% 85% of Waste from 2 Sources Electricity Generation 47. 6% Transportation (autos) 37. 0
Estimated US Energy Use – 2009
Natural Gas Overview
42% 53%
Forecasted in April 2009
LARGEST GAS RESERVES № Field name Country 1 South Pars/North Dome Iran and Qatar 2 Urengoy Russia 3 Yamburg Russia 4 Hassi R’Mel Algeria 5 Shtokman Russia 6 South Iolotan–Osman Turkmenistan 7 Zapolyarnoye Russia 8 Shale Hugoton USA Since Gas Extraction is(TX-OK-KS) 9 Groningen Netherlands so 10 new, Bovanenko this chart may not Russia 11 Medvezhye Russia include ANY of the world’s 12 North Pars Iran shale gas 13 Dauletabad-Donmez Turkmenistan 14 Karachaganak Kazakhstan 15 Kish Iran 16 Orenburg Russia 17 Kharsavey Russia 18 Shah Deniz Azerbaijan 19 Golshan Iran 20 Tabnak Iran 21 Kangan Iran TCF* 1235 222 138 123 110 98 95 Current US Shale Gas 81 Estimated Reserves 73 70 are 750 TCF 68 48 47 BUT 46 comparing to this 45 45 chart might be 42 comparing 42 30 APPLES and 22 ORANGES 20 * Recoverable
US SHALE GAS RESERVES Source: US Energy Information Adminstration BUT! USGS came back and revised the EIA’s data for This is a whoppingthe Marcellus down by 79. 5% to 55% of the total 84 TCF Total Might Acutally be 153. 6 TCF? ?
Shale Gas Overview
Forecasted in April 2009
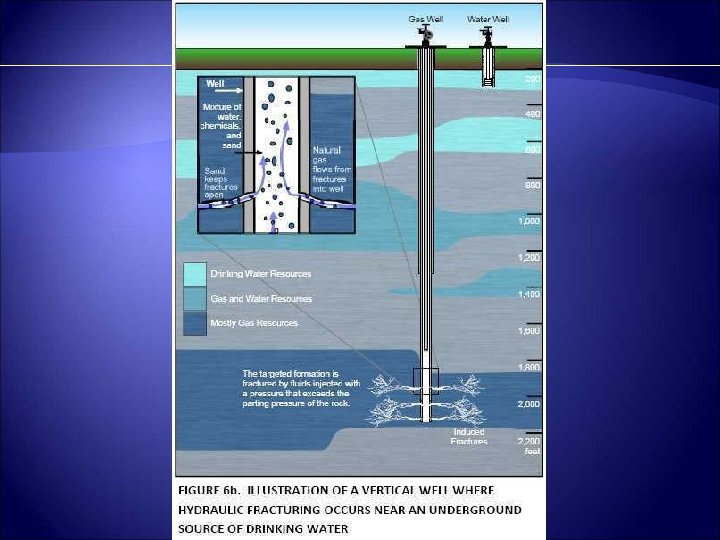
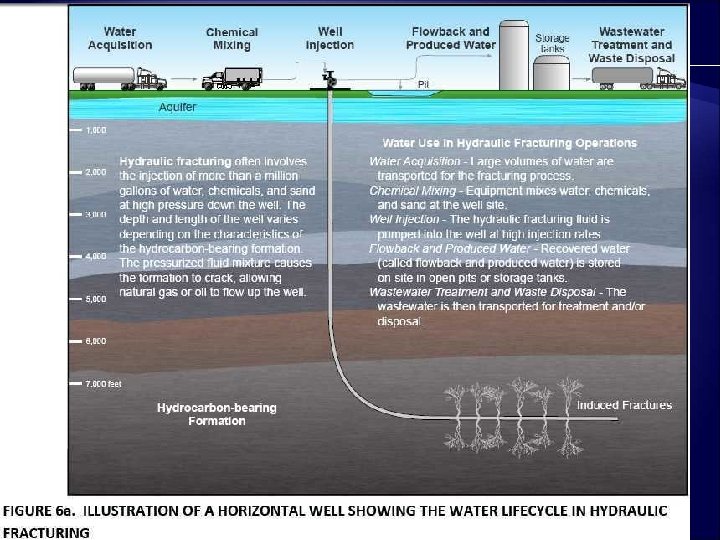
When the distance between the top of the target shale and the bottom of the aquifer is small, ONLY experienced operators should be drilling! drilling
Fracking Overview
Production Decline Curve • Production rates are a function of reservoir pressure. Economic Uneconomic • As production is removed from the reservoir, pressure decreases and therefore production decreases. • At some point, the economic limit is reached and decisions about the reservoir/ well must be made. 25
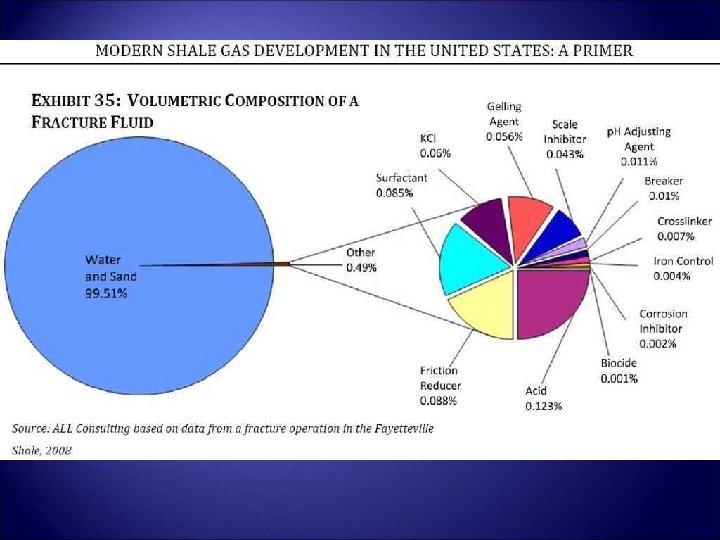
Production Enhancement Hydraulic Fracturing • Fracture reservoir rock (up to 500’ from perforations) with high pressure fluid & place a permeable proppant material into the fracture channel • Fracture remain open after pressure is reduced providing a high conductivity pathway for reservoir fluids to flow to the well 26
Production Enhancement Hydraulic Fracturing • In North America, 58 percent of new gas wells and 38 percent of new oil wells are hydraulically fractured. • Hydraulic fracturing is also being used more often in high permeability formations 58 % New Gas Wells 38 % New Oil Wells 27
Production Enhancement Hydraulic Fracturing A Frac Job takes considerable equipment 28
Environmental Overview
Claims Against Fracking Cows killed • Drinking water burns • Skin rashes • Contaminated soils • Air pollution • Dust •
Overview of One Experts Opinion Conversation with Dr. Ian Duncan Associate Director, Texas Dept of Economic Geology • Areas of Dimock, PA have historical records of NATURAL methane seepage into underground aquifers • He notes that the local Ag Extension service used and still do provide a warning brochure, which he has a copy of, advising prospective new residents of the area of the dangers of methane in their drinking water as home have blown up in the past as a result. This was a problem in the 1950’s and 60’s. • Evidence shows that more often than not, it is the natural seepage of methane that is causing problems with their drinking water, not Fracking as reported by the News Media and You. Tube
Separating FACT from FICTION Conversation with Dr. Ian Duncan Associate Director, Texas Dept of Economic Geology • Over 1000 supposed claims of environmental disasters associated with Fracking • Only 30 -40 have been filed with the Environmental Defense League • 6 identified as possible issues • 3 found incorrectly attributed fracking with naturally occuring methane seepage into underground aquifers • 3 found with bad cement jobs (Wyoming, Colorado, Ohio) • 2 of those had prior knowledge of the cement situation but Fracked anyway – Therefore only 1 instance of fracking causing unintentional problems Dr. Duncan notes that a paper will be published this year with his results
Separating FACT from FICTION MASSACHUTTES INSTITUTE OF TECHNOLOGY – July 2011 (http: //web. mit. edu/mitei/research/studies/documents/natural-gas-2011/Natural. Gas_Chapter%201_Context. pdf) “There has been concern that these fractures can also penetrate shallow freshwater zones and contaminate them with fracturing fluid, but there is no evidence that this is occurring. There is, however, evidence of natural gas migration into freshwater zones in some areas, most likely as a result of substandard well completion practices by a few operators. ”
Separating FACT from FICTION Environmental Protection Agency Study started in 2010 Results due in 2012
EPA STUDY IN PROGRESS
EPA STUDY IN PROGRESS EP A RS TU DY TO BE CO MP LE TE D BY 20 12
Well Design Overview
Well Design and Drilling 46
Well Design during drilling Blowout Preventer – Monitor & Controls the pressure within each casing string of the well Blowout Preventer Surface Casing String – Successive sections of pipe of decreasing diameter set one inside the other and cemented in place Casing Strings `` 47
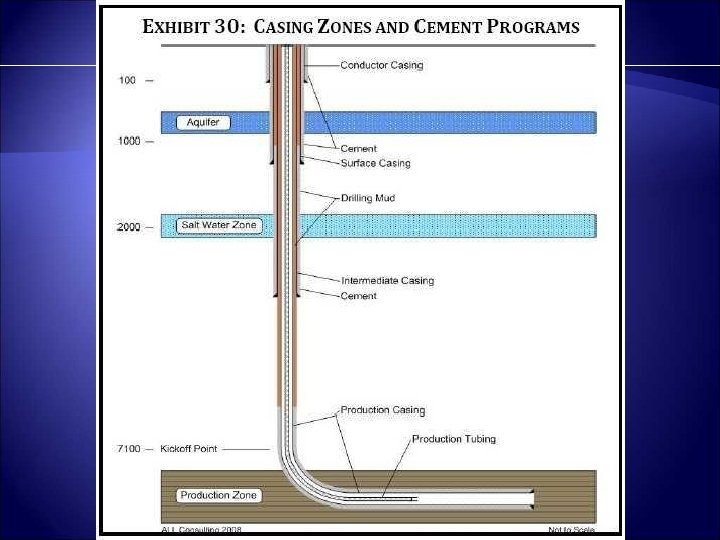
How is Casing Installed? • Drill 36” hole to design depth Surface • Slide 30” casing to depth within 36” hole • Cement 30” casing to 36” hole 30” Casing • Drill 24” hole thru cement in 30” casing to design depth 36”hole • Slide 20” casing to depth within the 24” hole • And so on …. 24”hole 20” Casing 48
Typical Well Casing Program • 30” Casing = Conductor Pipe (hung at surface; it is drilled or driven) Casing Size Depth • 20” Casing = Surface Casing (hung at surface; may not be necessary, depends on geology) 30 in (36”hole) 500 ft • 13 3/8” Casing = Intermediate Casing (hung at the surface) 20 in (26”hole) 3, 000 ft • 9 5/8” Casing = Intermediate casing (depending on design, could be hung off of 13 3/8”) 13 3/8 in (17 ½” hole) 7, 000 ft 9 5/8 in (12 ½” hole) 10, 000 ft 7 in Liner (8½” hole) 15, 000 ft • 7” Liner = Not a casing per se because it is hung off the end of the 9 5/8” casing; it doesn’t run to the surface 49
Well Casing Program Why is casing needed? • Protect freshwater aquifers that might be present in the subsoil • Prevents contamination between rock strata layers • Contain any unusual pressure in the layers of rock strata that might be encountered • Prevent borehole collapse while drilling deeper • Provide control of drilling mud being pumped down-hole Freshwater Aquifer Low Pressure Zone or future producing zone High Pressure Zone ck o p. R a C Wellbore thru the rock strata Black Gold! 50
Well Design during completion Xmas Tree– Monitor & Controls the pressure within the each casing of the well while allowing the well to flow to the surface Xmas Tree Surface Perforations – Holes shot thru the casing to allow fluid to flow into the wellbore Down-hole Completion Equipment – Devices & tools installed in the well to control which reservoir is produced and to give real-time data `` Perforations Down-hole Completion Equipment` 51
Well Design during completion To Production Facilities Xmas Tree Production Tubing – A string of pipe that runs from the producing zone to the wellhead in which oil and/or gas flows to the surface facilities Surface `` Perforations Down-hole Completion Equipment` 52
Types of Well Design • “Straight-hole” • Directional or “Deviated Well” • “Horizontal Well” ck o p. R a C Black Gold! 53
Deviated Well Why drill a deviated well? • Known fault can cause an unplanned deviation from the projected drill path High Pressure zones behind fault • High pressure zones might exist to one side of a fault • Subsurface “debris” like ancient reefs could cause a slower drill rate (ROP) than desired (time is money!) Fault ck o p. R a C Black Gold! 54
Deviated, Horizontal Wells Why drill a horizontal well? • Low permeability reservoirs are best produced by horizontal wells, the ultimate in “deviated well” • Three kinds of horizontal wells, long/short/medium radius: Target Reservoir • Long = 10 per 100 ft • Medium = 20 per 100 ft • Short = 40 per 100 ft 55
Horizontal Well Procedure • At start of deviation, replace drillbit with a “bent sub”, gyroscope, steerable mud motor & bit • Add logging-while-drilling (LWD) unit & power pack within 20 ft of bit • Slowly rotate drillstring to prevent “sticking” & start “pushing” steerable system forward while flowing mud to mud motor • Drill while being pushed forward & steer system as need be to maintain horizontal direction 56
Multilateral, Horizontal Wells • Added advantage of horizontal well design is to include “Multilaterals” (additional boreholes from the same drillsite) • From one wellsite, several sections of the reservoir can be accessed & produced Drillsit e Significant Production Increase Plan view 57
Horizontal Drilling Advantages • Increase in reserves in place by 2% of the original oil in place (OIIP)** • Cost ratio of horizontal versus vertical wells is approximately 2 to 1** • Production ratio for horizontal wells versus vertical wells is approximately 3. 2 to 1** • Inclusion of multilaterals increases production ratio even more!! ** per U. S. Department of Energy 58
Final Well Program • Well Schematic – Showing hole (bit) size, casing plan, mud plan, planned TD • Drilling Time Estimate – Breakdown total time into key components to various depths • Well Cost Estimate – Listing of all expected costs for the well • Well Time VS. Depth Plot – a “picture” of how much drilling time is planned for each casing run 59
Drilling Overview
Drilling LE T SG E DR T S ILL TA IN RT G! E D ! 61
Drilling Well Location? Onshore Offshore 62
Drilling Well Type? Exploratory (“Wildcat Well”) On-structure (“In-field”, Appraisal) Normal Success Rate = +/- 1 in 10 to +/- 3 in 10 Normal Success Rate = +/- 5 in 10 to +/- 9 in 10 63
Drilling Main Components of Drilling Derrick Traveling Block/Swivel Turntable/Kelly/ Kelly Bushing Blowout Preventer Casing (different sizes) Drill String Drill Bit 64 Drill Mud
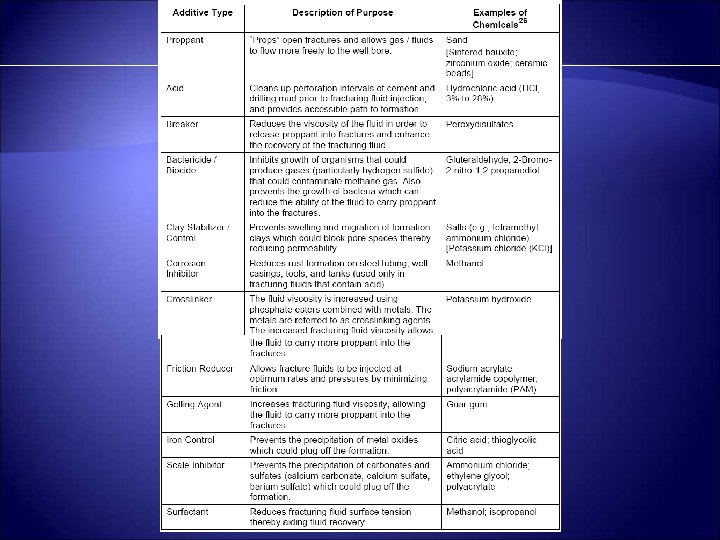
Drilling Mud What is Drilling Mud A mixture of clay with either water, oil and water, or synthetic organic matter and water. To this, various viscosity and density enhancers and additives to achieve specific objectives (adjust p. H, control bacteria, defoam, filtrate reducers, etc. ) are added. How does it get in the well? Mud is pumped into the drill pipe, flows down the pipe, exits out the drill bit, and flows, along with rock cuttings, up the borehole back to the rig. Mud IN Mud out Drilling Well bore Drill Bit 65
Drilling What is the Drilling Mud System? A ‘CLOSED SYSTEM’ where the drilling mud is mixed & pumped: 3. Mud Hose 2. Mud Pump • from the mud pit/tanks, • up into the mud hose • down into the drillstring, 1. Mud Pit or Tanks • thru the drillbit, 4. Circulate Mud down drillstring and back up borehole exit below Blowout Preventer • up the wellbore, • over the shellshakers and 5. Shale shakers • back to the mud pit/tanks 66
Drilling What does Drilling Mud do? • Cools drill-bit • Stabilizes borehole walls • Transports rock cuttings (“cuttings”) to surface (mud engineer examines cuttings w/microscope to check for oil and porosity) • Offsets hydrostatic/reservoir pressure 67
Drilling Plan How Critical is Drilling Mud? 0 500 • Blue line is Pore Pressure (the pressure from the overburden) • Yellow line is Mud Weight pressure 20" 1, 500 TVDBDF (m) • Red line is the Pressure that will fracture the Reservoir 1, 000 2, 500 13. 5/8" 3, 000 3, 500 4, 000 Overpressu re zones 10. 3/4" x 9. 7/8" 4, 500 • If Mud weight is too hi, it will damage the reservoir; if too low, a well blowout is possible! 5, 000 5, 500 0. 5 0. 6 0. 7 0. 8 0. 9 1. 0 1. 1 1. 2 1. 3 1. 4 1. 5 1. 6 1. 7 1. 8 1. 9 2. 0 2. 1 2. 2 2. 3 SG Specific Gravity 68
Drilling Plan Components • Location & coordinates of well • Anticipated time for each major activity • Drill-bit Plan (what size to what depth) • Casing Plan (what size to what depth) • Planned mud weight to offset hydrostatic/ reservoir pressure • Testing/logging plan • Signoff plan for Non-Operator reps 69
Drilling Contract Types • Costs per Day (DAY RATE) • Costs per Foot (FOOTAGE RATE) • Set Costs (TURNKEY BASIS) • Success often depends on quality & experience of Operator 70
Drilling Operations • Survey well location • Build roads, clear and level ground • Drill water well (optional) • Layout casing pipe/drill string & equipment • Prepare drilling mud • Assemble Rig • Drill each segment; set casing & cement 71
Drilling Operations (cont’d) • Unplanned drill breaks: stuck pipe, lost circulation, required fishing trip, etc. • Planned drill breaks: layout and position casing on deck, circulate bottom to remove cuttings, coring, drill stem testing, etc. • Let’s look at POSSIBLE DRILLING PROBLEMS, CORING and WELL LOGGING 72
Drilling Possible Drilling Problems • Lost tool (something breaks off or is dropped in well) • Stuck Pipe (drill pipe adheres to well walls due to suction/differential pressure or dogleg in wellbore) • Sloughing shale (swelling of shales, drops to bottom, can’t circulate out) • • • Lost circulation (high porosity zone/cavernous zone) Corrosive gases encountered (hydrogen sulfide) Abnormal high pressure (drill into/through a high press zone) • Blowout (mud weight not sufficient to hold back abnormal 73 high pressure gas; gas flows to surface and ignites unexpectedly)
Reserves Overview
Classification of Reserves is key! What are Reserves? The amount of oil & gas in a reservoir currently available for production There are several different reserves names used: • Reserves in Place (physically contained in the reservoir; remember that only 25 to 30% of that can actually be recovered with conventional technologies; OOIP) • Recoverable Reserves (estimate of what can be produced from the reservoir) • Proven Reserves, Developed or Undeveloped (reserves that can be calculated with reasonable certainty because the field has been defined by appraisal well(s) that have been tested) • Proved Behind-Pipe Reserves (undeveloped, proven reserves calculated behind the casing) • Proved (P 90), Probable (P 50) and Possible (P 10) Reserves 75
Classification of Reserves is key! • Proved (P 90) Reserves – 90 % chance or greater that the reserves are there; must have “very high certainty” that reserves can be “economically” recovered with current technology. SEC allows only reporting of P 90 • Probable (P 50) Reserves- 50 % chance that the reserves are there • Possible (P 10) Reserves - 10 % chance that the reserves are there • Remember estimates are based on data from a location as much as 2 miles below the surface, and on characteristics of a hole 6” in diameter extrapolated over several hundred acres of reservoir… Reserves estimating is more of an art than a science! 76
http: //water. epa. gov/type/groundwater/uic/class 2/hydraulicfracturing/index. cfm http: //www. dec. ny. gov/docs/materials_minerals_pdf/ogdsgeischap 5. pdf http: //www. netl. doe. gov/technologies/oilgas/publications/epreports/shale_gas_primer_2009. pdf http: //www. cbsnews. com/video/watch/? id=7054210 n&tag=related; photovideo http: //video. pbs. org/video/1801494624 http: //blogs. telegraph. co. uk/finance/rowenamason/100006602/shale-gas-pollution-fears-leaveamericans-with-another-energy-headache/#