
Sexing Fruit Flies http www hemingwayhome comcats How





- Slides: 37
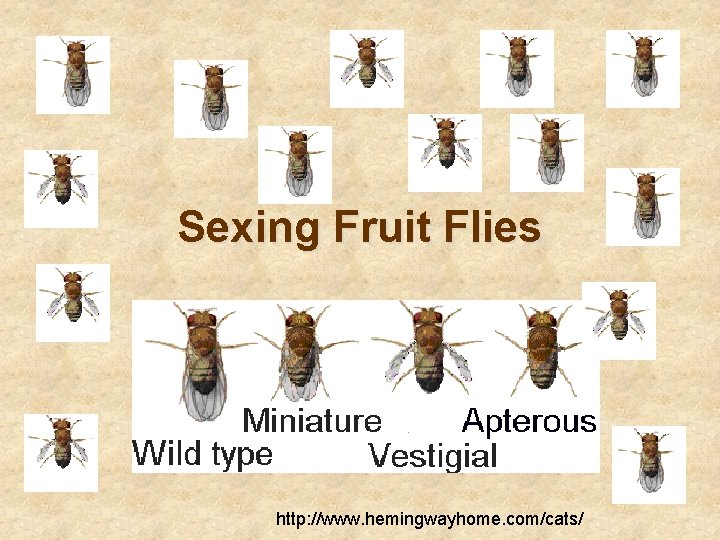
Sexing Fruit Flies http: //www. hemingwayhome. com/cats/
How to Prepare Your Cultures • Put labels on bottle with your name and class section– bottom part • Add about 10 -15 m: of sterile water – medium will turn blue • Add NO MORE THAN 1 scoopful of dry medium • Put in mesh, all the way down to the bottom • Make sure that your medium is not too wet or not too dry – CHECK WITH YOUR TEACHER!!! • Add a small pinch of yeast • Stopper
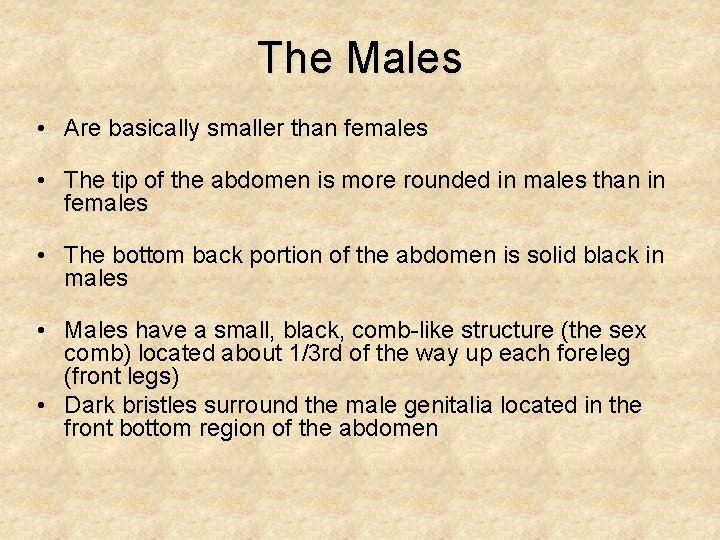
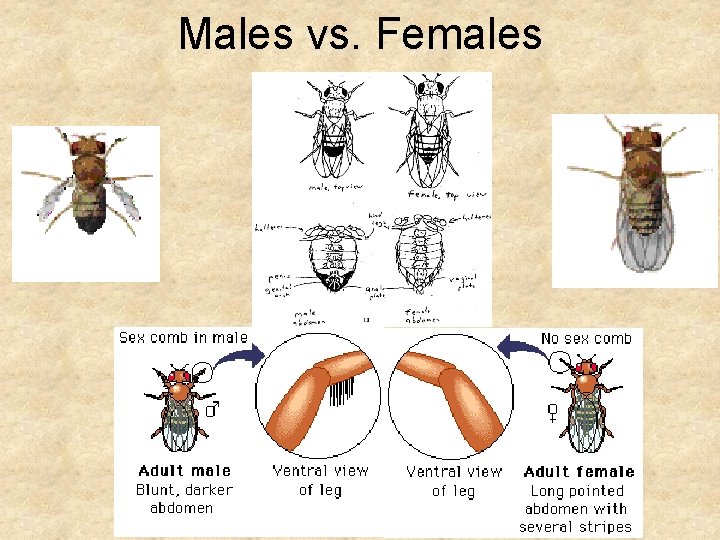
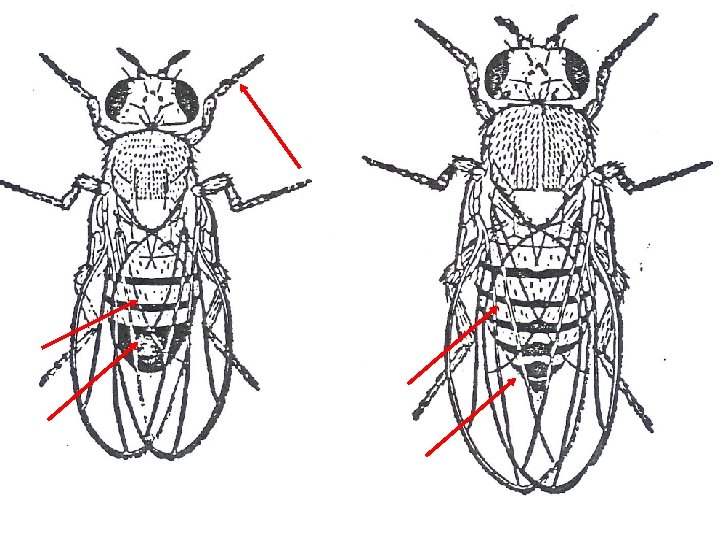
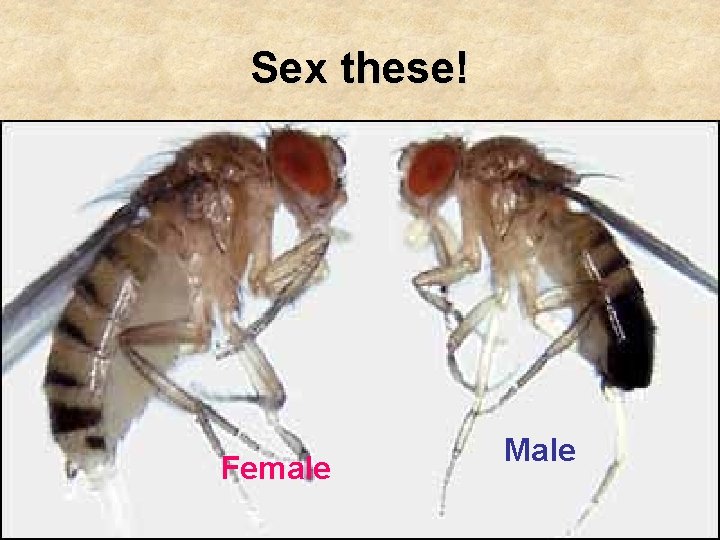
The Males • Are basically smaller than females • The tip of the abdomen is more rounded in males than in females • The bottom back portion of the abdomen is solid black in males • Males have a small, black, comb-like structure (the sex comb) located about 1/3 rd of the way up each foreleg (front legs) • Dark bristles surround the male genitalia located in the front bottom region of the abdomen
Males vs. Females
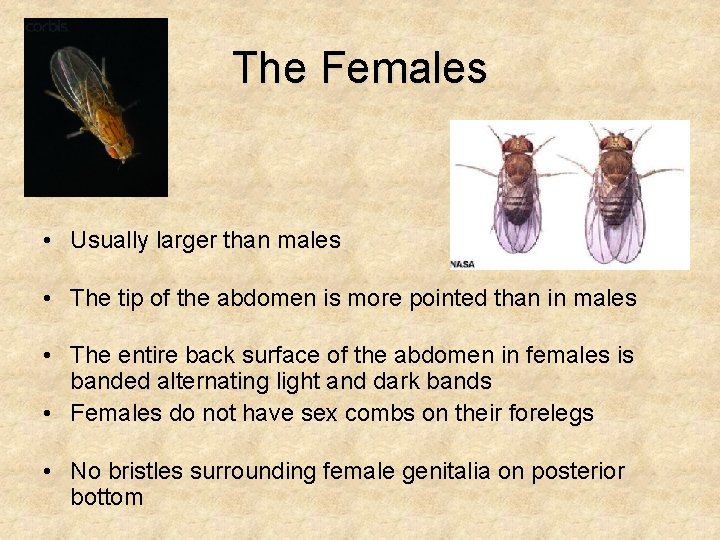
The Females • Usually larger than males • The tip of the abdomen is more pointed than in males • The entire back surface of the abdomen in females is banded alternating light and dark bands • Females do not have sex combs on their forelegs • No bristles surrounding female genitalia on posterior bottom
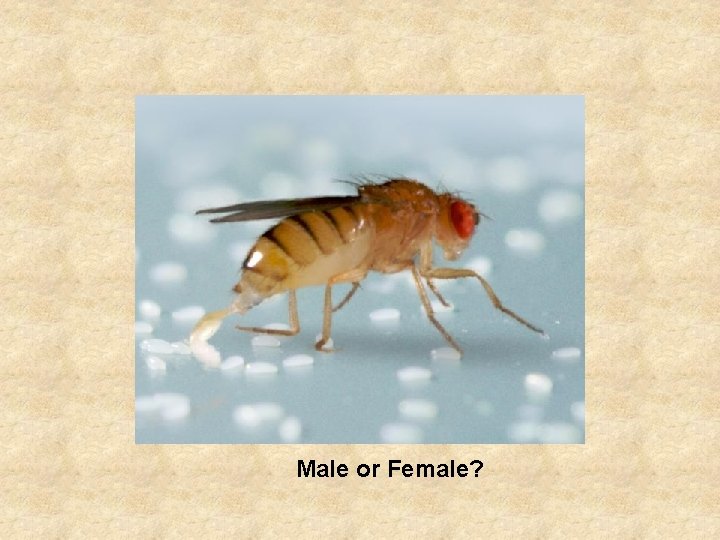
Male or Female?
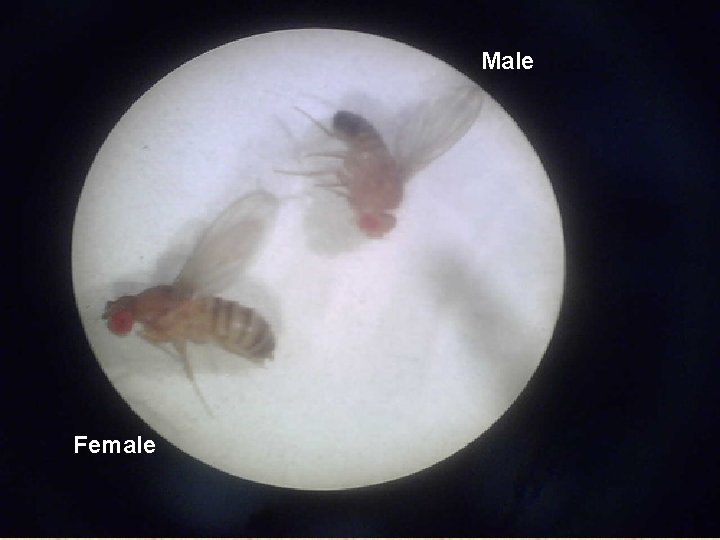
Male Female
Sex these! Female Male
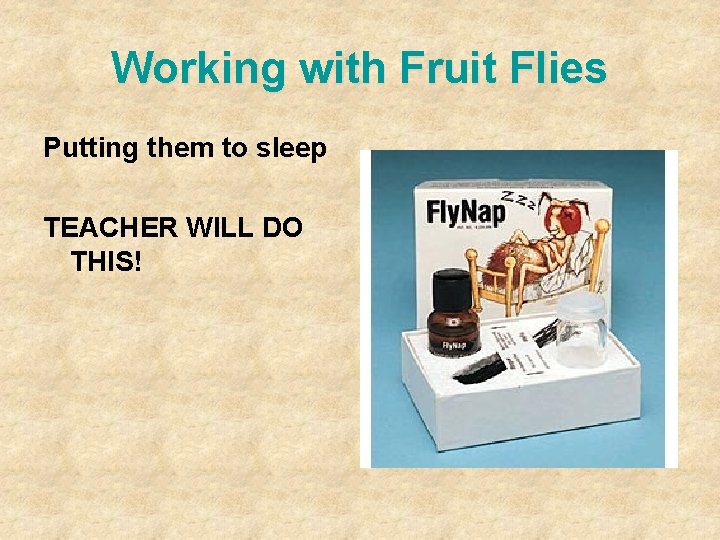
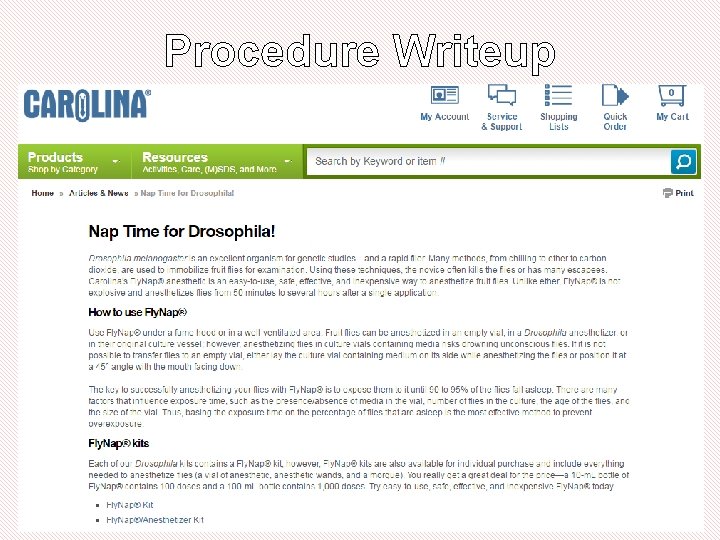
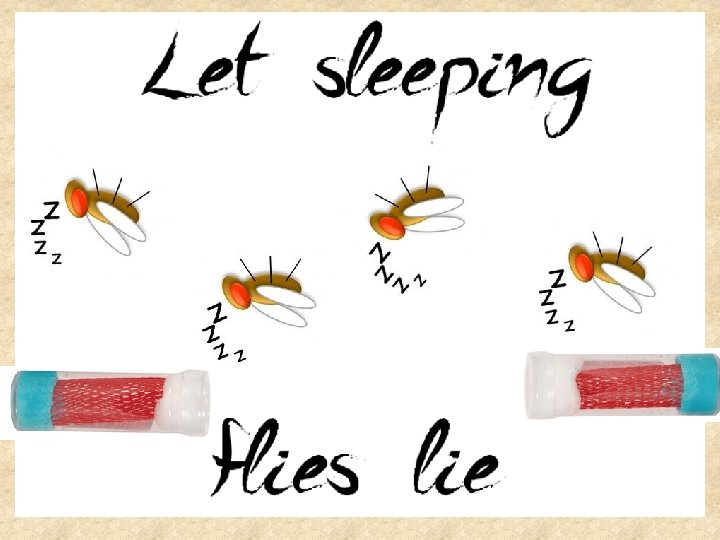
Working with Fruit Flies Putting them to sleep TEACHER WILL DO THIS!
Today’s goals • Make culture vial • Label culture vial • Transfer 5 males and 6 females into culture vial SUCCESSFULLY
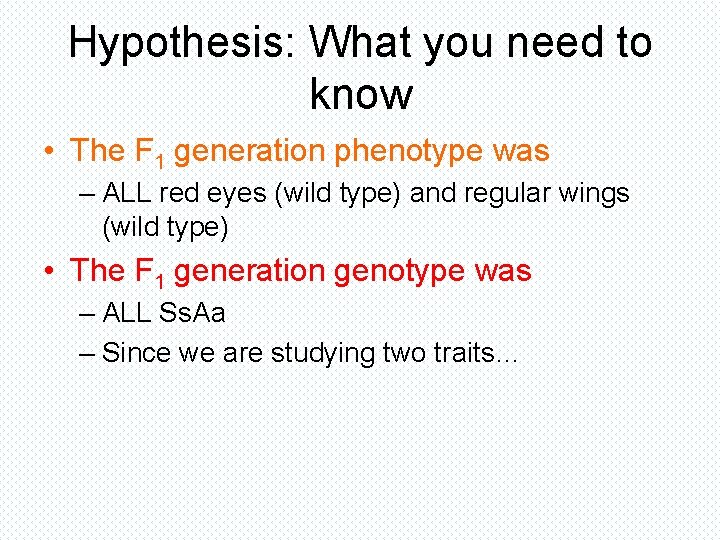
Hypothesis: What you need to know • The F 1 generation phenotype was – ALL red eyes (wild type) and regular wings (wild type) • The F 1 generation genotype was – ALL Ss. Aa – Since we are studying two traits…
Hypothesis: What you need to explain • HYPOTHESIS 1: What are the phenotypes and genotypes of the parent generation (you never saw these flies)? – You will need a dihybrid Punnett square with your explanation
Hypothesis: What you need to explain • HYPOTHESIS 2: What are the phenotypes and genotypes of the F 2 generation (this is what you will be counting)? – You will need a dihybrid Punnett square with your explanation
Procedure Writeup • Start with the P generation – What did they have to do to make the F 1? – How did we receive the F 1 generation? (container? )
Procedure Writeup • Move to the F 1 generation – – – How did we make the vials? How did we label the vials? How did we anesthetize the flies? How did we sort the flies? Tools needed? How many of each type of fly were put in the new vial?
Procedure Writeup
Procedure Writeup • How long (roughly) did we have to wait to see the F 2 emerge? – This can be either based on your life cycle data in your background OR the actual observations you have made?
Procedure Writeup • How long (roughly) did we have to wait to see the F 2 emerge? – This can be either based on your life cycle data in your background OR the actual observations you have made?
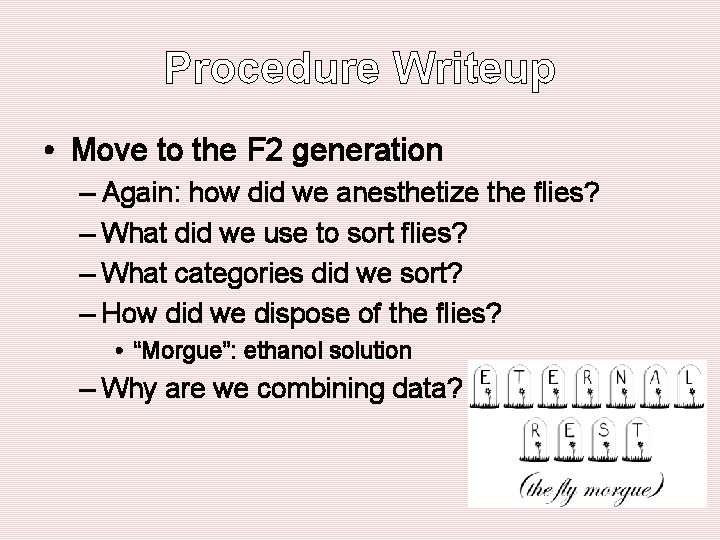
Procedure Writeup • Move to the F 2 generation – Again: how did we anesthetize the flies? – What did we use to sort flies? – What categories did we sort? – How did we dispose of the flies? • “Morgue”: ethanol solution – Why are we combining data?
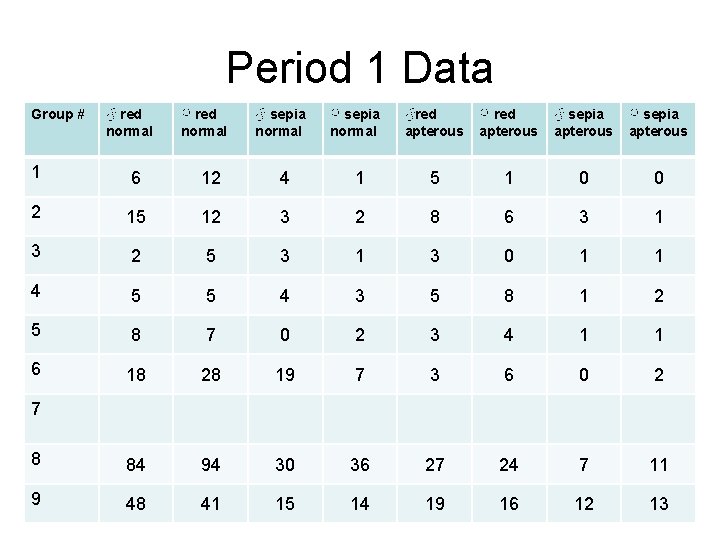
Period 1 Data Group # ♂ red normal ♀ red normal ♂ sepia normal ♀ sepia normal ♂red apterous ♀ red apterous ♂ sepia apterous ♀ sepia apterous 1 6 12 4 1 5 1 0 0 2 15 12 3 2 8 6 3 1 3 2 5 3 1 3 0 1 1 4 5 5 4 3 5 8 1 2 5 8 7 0 2 3 4 1 1 6 18 28 19 7 3 6 0 2 8 84 94 30 36 27 24 7 11 9 48 41 15 14 19 16 12 13 7
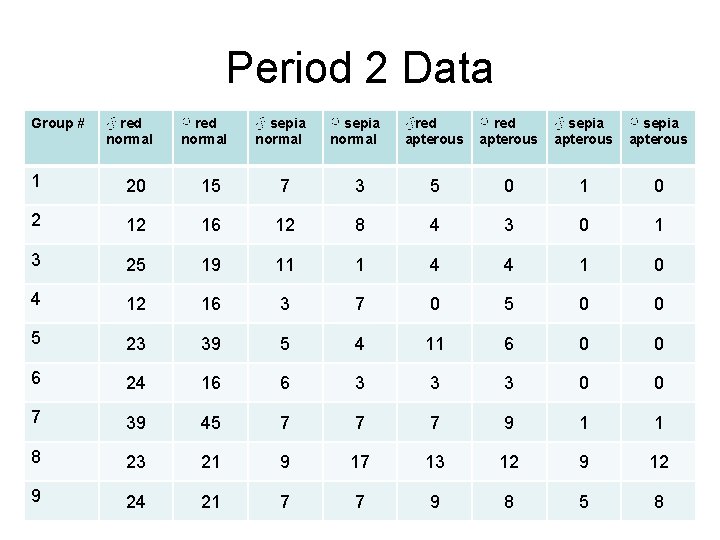
Period 2 Data Group # ♂ red normal ♀ red normal ♂ sepia normal ♀ sepia normal ♂red apterous ♀ red apterous ♂ sepia apterous ♀ sepia apterous 1 20 15 7 3 5 0 1 0 2 12 16 12 8 4 3 0 1 3 25 19 11 1 4 4 1 0 4 12 16 3 7 0 5 0 0 5 23 39 5 4 11 6 0 0 6 24 16 6 3 3 3 0 0 7 39 45 7 7 7 9 1 1 8 23 21 9 17 13 12 9 24 21 7 7 9 8 5 8
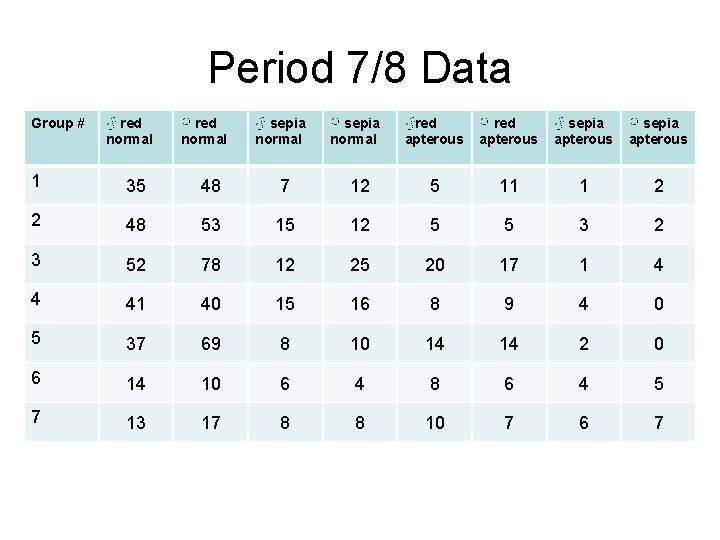
Period 7/8 Data Group # ♂ red normal ♀ red normal ♂ sepia normal ♀ sepia normal ♂red apterous ♀ red apterous ♂ sepia apterous ♀ sepia apterous 1 35 48 7 12 5 11 1 2 2 48 53 15 12 5 5 3 2 3 52 78 12 25 20 17 1 4 4 41 40 15 16 8 9 4 0 5 37 69 8 10 14 14 2 0 6 14 10 6 4 8 6 4 5 7 13 17 8 8 10 7 6 7
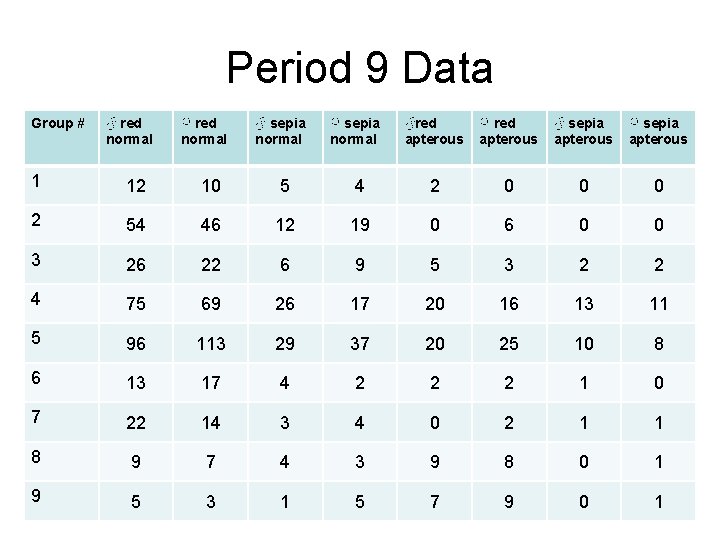
Period 9 Data Group # ♂ red normal ♀ red normal ♂ sepia normal ♀ sepia normal ♂red apterous ♀ red apterous ♂ sepia apterous ♀ sepia apterous 1 12 10 5 4 2 0 0 0 2 54 46 12 19 0 6 0 0 3 26 22 6 9 5 3 2 2 4 75 69 26 17 20 16 13 11 5 96 113 29 37 20 25 10 8 6 13 17 4 2 2 2 1 0 7 22 14 3 4 0 2 1 1 8 9 7 4 3 9 8 0 1 9 5 3 1 5 7 9 0 1
Results 1. Type up observation log Date 2/? ? /17 Observations (insert observation here)
Results 2. Make a table (with a table designation and title) of the pooled class data with the total numbers for each (added together)
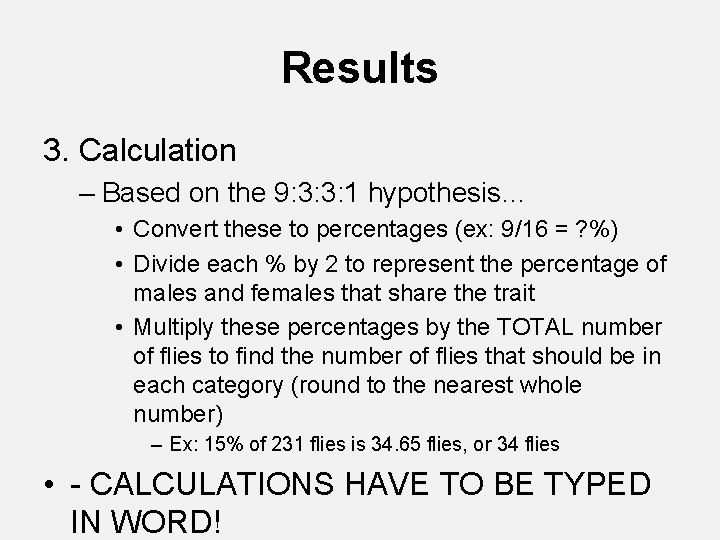
Results 3. Calculation – Based on the 9: 3: 3: 1 hypothesis… • Convert these to percentages (ex: 9/16 = ? %) • Divide each % by 2 to represent the percentage of males and females that share the trait • Multiply these percentages by the TOTAL number of flies to find the number of flies that should be in each category (round to the nearest whole number) – Ex: 15% of 231 flies is 34. 65 flies, or 34 flies • - CALCULATIONS HAVE TO BE TYPED IN WORD!
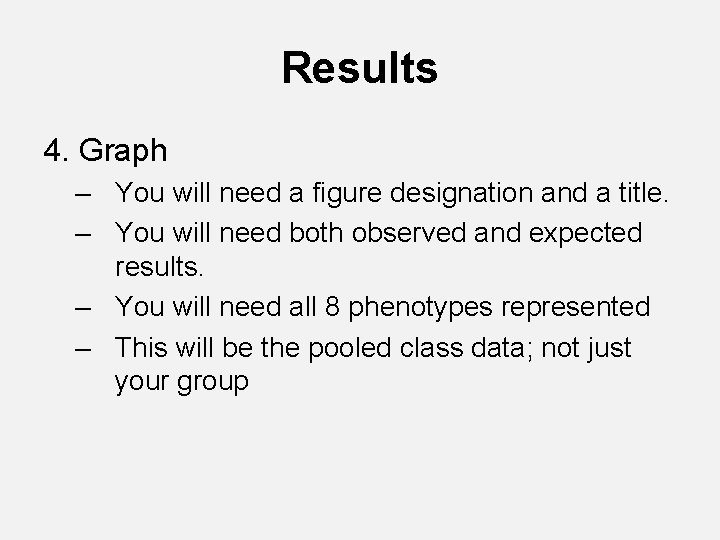
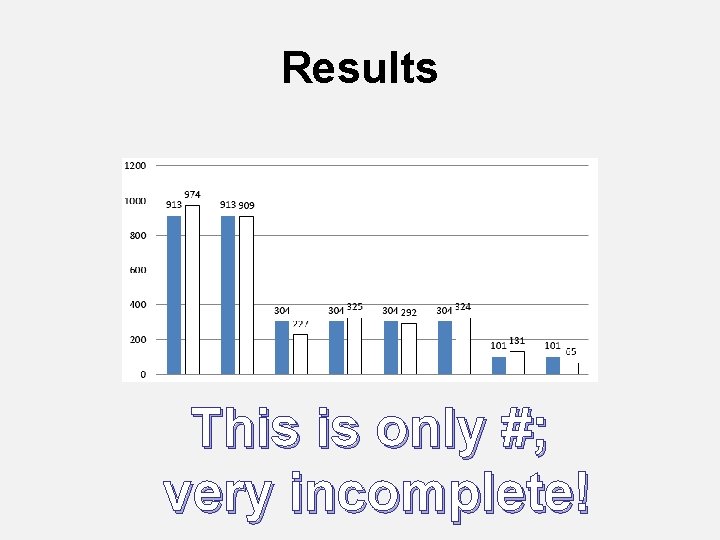
Results 4. Graph – You will need a figure designation and a title. – You will need both observed and expected results. – You will need all 8 phenotypes represented – This will be the pooled class data; not just your group
Results This is only #; very incomplete!
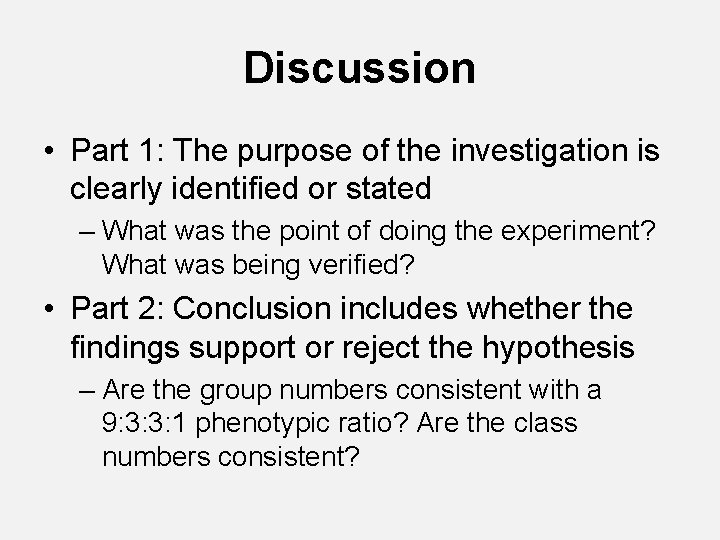
Discussion • Part 1: The purpose of the investigation is clearly identified or stated – What was the point of doing the experiment? What was being verified? • Part 2: Conclusion includes whether the findings support or reject the hypothesis – Are the group numbers consistent with a 9: 3: 3: 1 phenotypic ratio? Are the class numbers consistent?
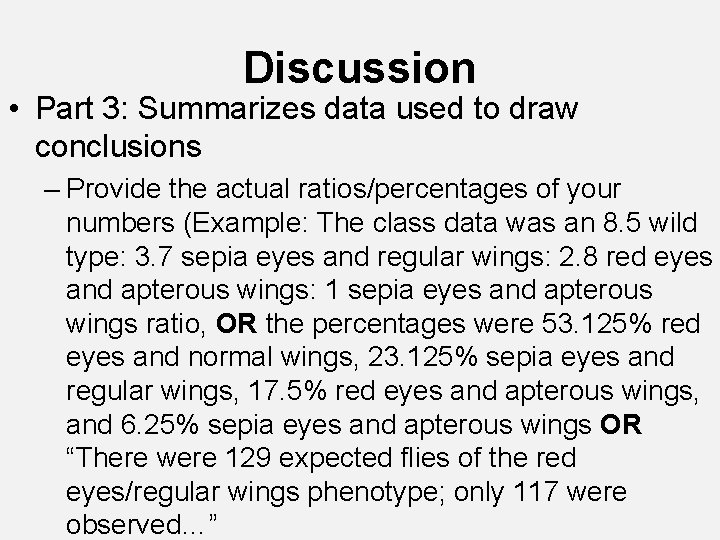
Discussion • Part 3: Summarizes data used to draw conclusions – Provide the actual ratios/percentages of your numbers (Example: The class data was an 8. 5 wild type: 3. 7 sepia eyes and regular wings: 2. 8 red eyes and apterous wings: 1 sepia eyes and apterous wings ratio, OR the percentages were 53. 125% red eyes and normal wings, 23. 125% sepia eyes and regular wings, 17. 5% red eyes and apterous wings, and 6. 25% sepia eyes and apterous wings OR “There were 129 expected flies of the red eyes/regular wings phenotype; only 117 were observed…”
Discussion • Part 4: Identifies flaws and possible errors in the investigation – What things did go wrong? What things could have gone wrong? What factors could have resulted in more diversity of phenotypes than expected?
Discussion • Part 5: Demonstrate comprehensive understanding of the concepts that apply to this investigation – Interpret the results. Do these make sense based on these traits being autosomal recessive? – How are the phenotypes of the F 2 generation able to be so diverse compared to the F 1 generation? – Discuss Mendel’s 3 laws
Discussion • Part 6 : Discusses applications or real world connections. – How do the concepts in this investigation go beyond Mendel’s pea plants and fruit flies? How do they apply to humans and the study of life?
Works Cited • Based on background information sources – Must have a minimum of 2 – Wikipedia does not count • Must be in MLA format – Don’t forget to • Alphabetize • Indent 2 nd line