Severe Weather Event Public Health Response Kentuckys Experience
 Doug Thoroughman, Ph. D,")
Severe Weather Event Public Health Response: Kentucky’s Experience CAPT (USPHS) Doug Thoroughman, Ph. D, MS CDC Career Epidemiology Field Officer Kentucky Department for Public Health

Ice Storm Impact on Kentucky • Jan 26, 2009 Ice storm moves across state • Leaves nearly 800, 000 without power • Worst natural disaster in Kentucky’s history • 36 Storm Related Deaths • 101 counties declared state of emergency
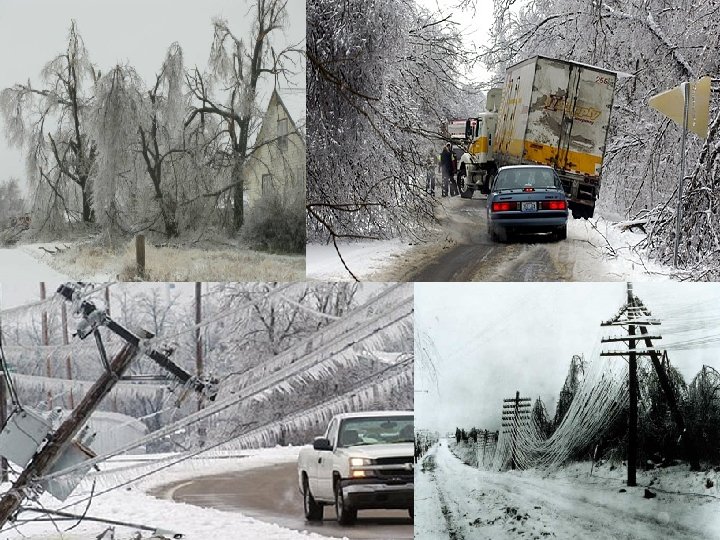

Statewide Impact

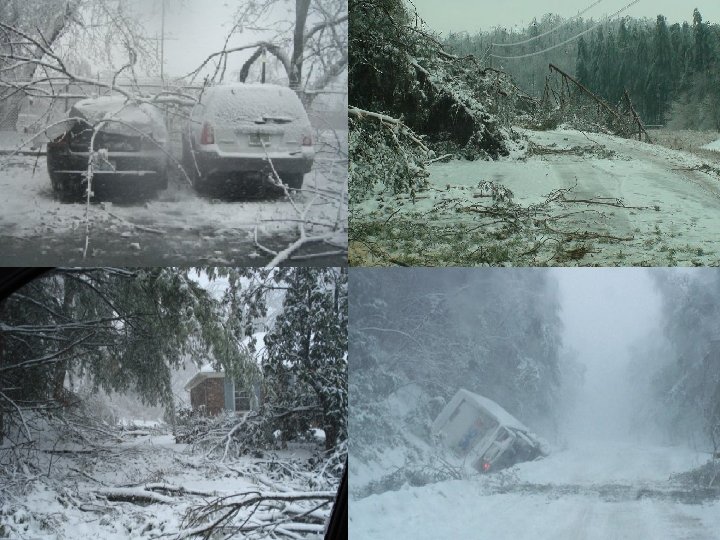
Tornado Impact on Kentucky • March 2, 2012 severe weather event moves across state • 15 tornados spawned – 1 tracked 86 miles – Even affected “hollers” • 22 Tornado related deaths • 650 Homes destroyed (1600 more damaged) • Two communities destroyed

Background 7

West Liberty, KY 8

West Liberty, KY 9

Disaster Data Collection • Shelter surveillance – Environmental – Infectious disease • CASPER Rapid Needs Assessments • Carbon Monoxide Poisoning Surveillance • Tornado Injury Surveillance • Mortality surveillance 10

CASPER • Community Assessment for Public Health Emergency Response • Epidemiologic technique to provide household-based information about an affected community’s needs after a disaster. — Identify needs — Prioritize responses — Plan for distribution of resources • Based on WHO-EPI method

When to Conduct a CASPER • Effect of disaster on population is unknown • Health status and basic needs are unknown • Concerns about specific groups or individuals (e. g. older adults, children, pregnant women) • Response and recovery efforts evaluation • Information needed for planning
 § Political boundaries §")
Multi-stage Cluster Sampling q Define sampling frame (population of concern) § Political boundaries § Geographic boundaries § Subpopulation of affected area q 30 clusters/region § census block § probability proportional to estimated number of housing units q q 7 households/cluster Data weighted to: 30 X 7 Desi gn § account for incomplete sampling § provide population estimates of data collected

CASPER in Kentucky • 2 Emergency Response Uses – 2009 Ice Storm – 2012 Tornado Response • 1 Health Impact Assessment • 2 Preparedness/Functional Needs Assessments – USPHS Response Team Training Missions – National Level Exercise: Western KY – Training Mission in Eastern KY • Strategic Plan – non-disaster CASPER use to increase PH Preparedness

CO Poisonings By Day
 HBOT’s (%) KRPC Incidents (% of incidents)")
Sources of CO Poisoning Generator Deaths (%) HBOT’s (%) KRPC Incidents (% of incidents) 8 (80%) 16 (57%) 20 (31%) 1 (4%) 29 (45%) Kerosene heater Propane heater 1 (10%) Propane cooking device Indoor charcoal use Vehicle running in garage 11 (17%) 5 (18%) 1 (10%) 5 (18%) 1 (4%)

Tornado Injury Surveillance • Night of March 2 nd adapted CDC Mortality Surveillance Form • Revised, vetted and distributed before noon March 3 rd • Tasked regional Epi’s with data collection • Hospital ICP’s, LHD Epi’s submitted reports daily 17

Surveillance Findings Table 1. Submitted injury surveillance forms 3/2 3/3 3/4 3/5 3/6 3/7 3/8 F Sa Su M T W Th Long-Term Care Facilities 0 30 1 41 24 2 22 120 (59) Hospitals 3 13 3 29 9 12 3 72 (35) Shelters/Other Facilities 0 0 1 7 2 1 0 11 (6) 3 (1) 43 (21) 5 (2) 77 (38) 35 (17) 15 (7) 25 (12) 203 Total Type of Facility Total 18

Surveillance Findings Table 2. Frequencies of storm-related injuries by severity 3/2 3/3 3/4 3/5 3/6 3/7 3/8 Total F Sa Su M T W Th Minor 26 56 12 11 0 0 2 107 Serious 2 27 3 2 0 0 0 34 Life Threatening 1 10 1 0 0 12 31 92 18 13 0 2 2 158 Injury Severity Total 19
- Slides: 19