SESSION PLAN Introduction 10 minutes Objectives 30 minutes

SESSION PLAN Introduction 10 minutes Objectives 30 minutes Example, Case Study 10 minutes Group Discussion 30 minutes Exercise 10 minutes Conclusions 10 minutes

Low Emissions Land Use Planning Development Team Acknowledgements Name Affiliation David Saah; Co-Lead University of San Francisco, SIG Name Affiliation Phan Xuan Thieu Vinh University, Vietnam Mohd Zaki Hamzah; Co-Lead University Putra Malaysia Chalita Sriladda USAID-LEAD Khamla Phanvilay, Co-Lead National University of Laos Hoang Thi Thu Duyen Vietnam Forestry University, Vietnam Cao Thuy Anh Dalat University, Vietnam Ladawan Puangchit Kasetsart University, Thailand Chalermpol Samranpong Chiang Mai University, Thailand Do Anh Tuan Vietnam Forestry University, Vietnam Pham Thanh Nam USAID LEAF Vietnam Lyna Khan Royal University of Phnom Penh, Cambodia Peter Stephen USAID LEAF Bangkok Le Ba Thuong Vietnam Forestry University, Vietnam Hoang Vinh Phu Vinh University, Vietnam Napat Jakwattana University of Phayao, Thailand Vipak Jintana Kasetsart University, Thailand Nur Anishah Binti Aziz University Kebangsaan Malaysia Kulala Mulung PNG University of Technology Ratcha Chaichana Kasetsart University, Thailand Sureerat Lakanavichian Chiang Mai University, Thailand Somvilay Chanthalounnavong National University of Laos Thavrak Huon Royal University of Agriculture, Cambodia Vongphet Sihapanya National University of Laos Athsaphangthong Munelith USAID LEAF Laos David Ganz USAID LEAF Bangkok Attachai Jintrawet Chiang Mai University, Thailand Chi Pham, Project Coordinator USAID LEAF Bangkok Chanin Chiumkanokchai USAID LEAF Bangkok Kent Elliott US Forest Service Lam Ngoc Tuan Dalat University, Vietnam Beth Lebow US Forest Service Mark Fenn USAID Vietnam Forests & Deltas Geoffrey Blate US Forest Service
 Section 2. Assessment of Current and Historical Condition")
Low Emission Land Use Planning (LELUP) Section 2. Assessment of Current and Historical Condition 2. 3. Data and Capacity Gap Assessment Regional Climate Change Curriculum Development

LELUP Framework 1. 1. Regulatory Assessments 1. 2. Stakeholder Engagement 1. 3. Planning & Development Goals & Objectives MONITORING & EVALUATION NEGOTIATING & PRIORITIZING IMPLEMENTATION PLAN ENABLING ENVIRONMENT Low Emission Land Use Planning ANALYSIS OF FUTURE OPTIONS ASSESSMENT OF CURRENT CONDITION 2. 1. Environment, Social, & Economic Data Needs 2. 2. Understanding Historic Land Use Change 2. 3. Data & Capacity Gap Assessment

Summary § Quality Assurance and Quality Control § Accuracy and Precision § Ethics of Uncertainty § UNFCCC Principles § Gap Audit

Learning Objectives At the end of this session, learners will be able to: § Identify gaps in data and information needed. § Determine what skill would be required to establish in a multidisciplinary team.

Defining the Need for QA/QC Plans need to be made to monitor for: § Quality Assurance (QA): is a way of preventing mistakes § Quality Control (QC): is a process by which entities review the quality of all factors involved in an analysis.
 The QA/QC plan should become part of project")
Quality Assurance and Quality Control (QA/QC) The QA/QC plan should become part of project documentation and cover the following procedures: § Field measurements § Laboratory measurements § Data entry § Data analysis § Data maintenance and archiving

Accuracy and Precision Accuracy: Precision: Agreement between the true value and repeated measured observations or estimations The level of agreement among repeated measurements of the same quantity Accurate but not precise Precise but not accurate Accurate and Precise

QA/QC for Field Measurements § Standard Operating Procedures should be created Ensure Accuracy of measurements (consistency of methods) § Thorough training of all field crews in procedures § Followed by: Hot Checks Cold Checks Blind Checks

Example: QA/QC for Field Measurements Blind Checks § Used to access the amount of error § Remeasure 10 - 20% of plots (guide) § This error level should be reported
 should be developed and implemented.")
QA/QC for Data Entry § Standard Operating Procedures (SOP) should be developed and implemented. § Data should be examined for extreme numbers - may be caused by data entry mistakes. § If problems exist, the plot (s) should be removed.

QA/QC for Laboratory Measurements SOP for laboratory analysis. Blind Checks: § Used to access the amount of error § Re-measure 10 – 20% of samples § This error level should be reported

QA/QC for Data Storage § SOP to update and backup all data is needed. § Copies of all data should be stored in a secured location. § Important to Update all electronic data to new types of data storage.

Tool to estimate C stocks in all pools measured using appropriate regressions and factors to convert to t C/ha http: //www. leafasia. org/tools/manual-carbonstock-calculation-tool

Definitions: Uncertainty § Uncertainty means the lack of knowledge of the true value of a variable, including both bias and random error. § Error: Something that is not correct.

Definitions: Uncertainty: § Imperfect and inexact knowledge § Data uncertainty § Rule uncertainty

Definitions: Measuring Uncertainty Higher Certainty Lower Certainty

Confidence Interval § 90% of data points will fall within 1. 645 standard deviations of the mean. § Calculate the 90% confidence interval using Standard deviation (σ) Sample size (n) § Report C stock as mean ± 90%CI § Uncertainty can also be estimated: (90% CI / mean) x 100 -> should be <10%

Group Discussion 1: QA, QC & Error and Uncertainty § List the importance of understanding Error and Uncertainty? § In small groups list down ALL the common sources of error?

Geographic Data Uncertainty and Ethics From an ethics point of view: § Poor quality data should not be used for sensitive applications where it poses a risk of harm § Need appropriate safeguards to avoid the harm, and to provide effective warnings § Not enough just to anticipate intended uses and data quality requirements. Must anticipate the possible misuses of the system as well

The Typical Approach Specifications, Quality control Spatial Integrity constraints Methods to select best sources Spatial Database Data collection Quality analysis Context-sensitive system warnings Metadata management Data production Error-aware GIS, Fuzzy operators Users. . . Users Internet Paper map Web services Data Diffusion Data Selection Usage web services § -Training § -Manuals § -Access control
. Decision 4/CP. 15, paragraph 1(d) “Requests” Parties to:")
UNFCCC Principles COP 15, Copenhagen (2009). Decision 4/CP. 15, paragraph 1(d) “Requests” Parties to: “…establish, according to national circumstances and capabilities, robust and transparent national forest monitoring systems and, if appropriate, sub-national systems as part of national forest monitoring systems that: i) Use a combination of remote sensing and ground-based forest carbon inventory approaches for estimating, as appropriate, anthropogenic forest-related greenhouse gas emissions by sources and removals by sinks, forest carbon stocks and forest area changes; ii) Provide estimates that are transparent, consistent, as far as possible accurate, and that reduce uncertainties, taking into account national capabilities and capacities; iii) Are transparent and their results are available and suitable for review as agreed by the Conference of the Parties;

UNFCCC Principles § Transparency § Consistency § Comparability § Completeness § Accuracy § Conservative From: GOFC-GOLD 2009

Matrix of Knowledge Data Unknown Question Known Unknown

Gap § We knew what happened in the past § We knew the current condition § Why do we have different pictures of the future?

Gap Audit Things To Include § Presence of Data § Presence of Results § Presence of Thresholds § Measurement of Uncertainty § Spatial Extent § Temporal Extent Things Not to Include § Interpretation of Results § Information that will bias the monitoring effort

Matrix of Knowledge Data/Knowledge Known Unknown LE LUP Issues Known Unknown Most of LELUP work will fit into this box

Spatial Example: Gap Audit

Example: Cloud Cover

Non-Spatial Example: Gap Audit 1. 2. 3. Studies selected based on geography and context Study Quality (peer, white, gray, . . ) GAP analysis
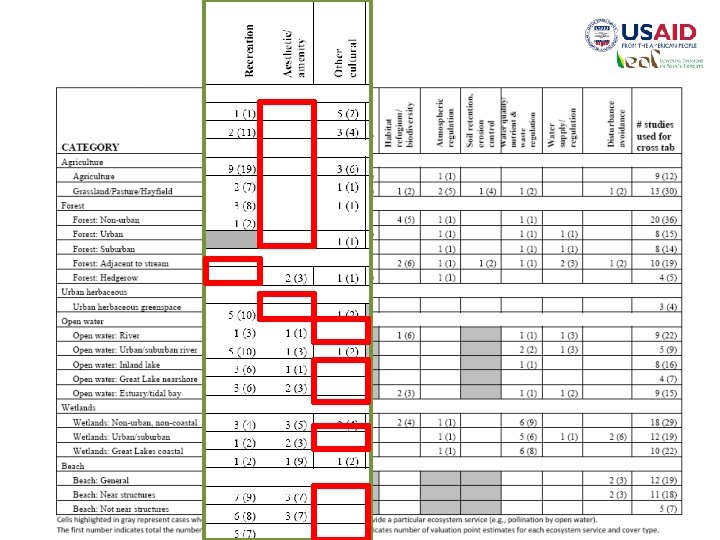

GAP Analysis by Land Cover Types § Gaps in the data mean results should be treated as conservative baselines, not upper bound estimates. § Technical reports and grey literature are not included in this analysis. § These estimates are likely to underestimate ESVs

Matrix of Knowledge Our knowledge Known Unknown Climate Change Drivers Known Unknown

Group Discussion 2 § Non-spatial gap § Spatial gap § Temporal gap § Knowledge gap (how well do we understand the process? )

Case Study Category Objective Indicator Environmental Maintain at least 61% forest cover by 2015 Percent forest cover Maintaining or improving ecological integrity 1) Ratio of natural forest to plantations 2) Species type diversity 3) Richness Increase annual GDP growth rate from 12 -15% GDP growth rate GDP per capita will reach 2300 USD by 2015 GDP per capita Economic Social Population growth reduced to Population growth rate by 1. 3% (2015) and 1. 2% (2020) urban and rural sectors No poor households by 2020 General poverty rate by urban and rural sectors

Lam Dong, Vietnam Case Study Example RICHNESS in FIPI data

Build Your Team 1. Include Stakeholders 2. Select Experts 3. Integrate Team 4. Team Cohesiveness 5. Resource Availability

Team Capacity Expert A Indicator 1 Indicator 2 Indicator 3 Indicator 4 Expert B Expert C Expert D

TAKE HOME MESSAGE 1. Identify the limitations of your data 2. Determine that selecting data has an ethical element that is dependent on the QA/QC results 3. Leverage your teams to build up capacity

References Reference for QA/QC details: EPA 1996, Environmental Protection Agency Volunteer Monitor’s Guide to: Quality Assurance Project Plans. 1996. EPA 841 -B-96 -003, Sep 1996, U. S. EPA, Office of Wetlands, Washington, D. C. 20460, USA http: //www. epa. gov/owowwtr 1/monitoring/volunteer/qappexec. htm Reference for Uncertainty in REDD+: Reference: GOFC-GOLC report “A sourcebook of methods and procedures for monitoring measuring and reporting” Chapter 2. 7
- Slides: 41