Session 8 Two subfields of economics Microeconomics is

Session 8

• Two subfields of economics – Microeconomics is the study of how individual households and firms make decisions and how they interact with one another in markets. – Macroeconomics is the study of the economy as a whole. • Its goal is to explain the economic changes that affect many households, firms, and markets at once.

• Macroeconomics answers questions such as • the following: – Why is average income high in some countries and low in others? – Why do prices rise rapidly in some time periods while they are more stable in others? – Why do production and employment expand in some years and contract in others? – What can governments do to promote economic growth, employment, and low inflation

• Micro vs. Macro – Micro-foundations of Macroeconomics: a national economy consists of households and firms • Macroeconomics uses similar tools and concepts to microeconomics. – Example: supply and demand
?")
• What are some things we might care about (related to macro economics)? – Probably central to all of these things is the concept of economic growth • Growth of what? – And scientist (physical or social) will tell you that if you can’t measure something, you can never really study it or know much about it • We need some metric of aggregate econ output

• When judging whether the economy is doing well or poorly, it is natural to look at the total income that everyone in the economy is earning (and if that amount is growing or shrinking). • Gross domestic product (GDP) is the total market value of all final goods and services produced within a country in a given period of time. • GDP is a measure of the income and expenditures of an economy

• One thing to remember: – GDP is not a perfect measure • But it does have the advantage of actually existing thus we’ll do what we can with it • Let’s dissect the definition…

• Meaning of the GDP definition • “GDP is the market value. . . ” – Output is valued at market prices. Then oranges, apples, guns, and butter can be counted within one measure.

• “. . . all. . . ” – GDP tries to be comprehensive but counts sales of goods and services that are visible to data collectors • What are some things GDP will miss? – GDP excludes most items that are produced and consumed at home and that never enter the marketplace. • E. g. vegetables from your garden are not part of GDP. • Housework in your own house done by you or your family that wasn’t paid is not part of GDP. – Free babysitting by grandparents is not part of GDP. – Will also miss transactions in the “informal econ” • Black-market, “underground”, some informal transactions

• “. . . final. . . ” – It records only the value of final goods, not intermediate goods (the value is counted only once) – This is because the value of the final goods will include the value of the intermediate good. This avoids double counting: the value is counted only once.

• “. . . goods and services. . . “ – It includes both tangible/physical goods (food, clothing, cars) and services (haircuts, house cleaning) • “. . . produced. . . ” – It includes goods and services produced in the period we’re considering, not transactions involving goods produced in the past. • E. g. : sale of a used car is not counted towards a GDP. Why?

• “. . . within a country. . . ” – It measures the value of production within the geographic confines of a country – Nationality of the producer or owner of the factory don’t matter. • Eg: my teaching in Mikkeli will be counted towards Finnish GDP even though I’m not a Finnish citizen.

• “. . . in a given period of time. ” – It measures the value of production that takes place within a specific interval of time, usually a year or a quarter (three months). That means GDP measures a flow of goods and services. – Note that quarterly GDP data is also reported as an annual rate (i. e. quarterly production multiplied by 4). This way GDP numbers always on the same scale. – Reported data is also seasonally adjusted, i. e. timespecific variations are taken out. • E. g. a spike in sales in December is evened out

• Income = expenditure – For an economy as a whole, income must equal expenditure because: • Every transaction has a buyer and a seller: every dollar of spending by some buyer is a dollar of income for some seller. • Example: You spend $20 at a restaurant. That spending just became someone’s income. So this transaction can be viewed as an expenditure and income. • The equality of income and expenditure can be illustrated with the circular-flow diagram
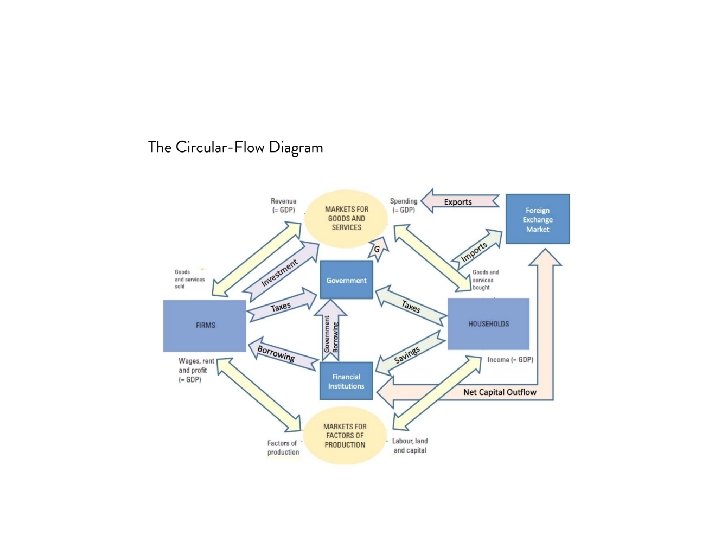

• This Circular Flow Diagram includes government, financial intuitions, foreign exchange, leakages and injections. – Leakages: taxes (T), savings (S), spending on imports (M) • Taxes are paid by households and firms • Savings go into financial institutions (banks, pension funds). Financial institutions lend money to firms. • Spending on imports leave the economy – Injections: government spending (G), investment (I) and revenue from exports (X) • Firms sell some of the production abroad. • Revenue from exports flow back into the economy • Financial firms lend some money abroad and foreigners invest money into the economy; this is the net capital outflow.

• The GDP identity • Y = C + I + G + NX • • • GDP (Y) Consumption (C) Investment (I) Government Purchases (G) Net Exports (NX)
: – The spending by households")
• The components of GDP • Consumption (C): – The spending by households on goods and services, with the exception of purchases of new housing (new housing is counted in investment). – Goods include durable goods (cars and appliances) and non-durable goods (food and clothing).
: • The spending on capital equipment, inventories, and structures, including")
• Investment (I): • The spending on capital equipment, inventories, and structures, including new housing. – by convention, new private house purchases are counted as part of investment. • Non-sold goods are counted as inventory investments.
: • The spending on goods and services by local")
• Government Purchases (G): • The spending on goods and services by local and central governments. • Includes salaries of government workers • Does not include transfer payments because they are not made in exchange for currently produced goods or services. – So transfer payments don’t reflect current production and this is why they’re not counted.
: • Exports minus imports")
• Net Exports (NX): • Exports minus imports

• Does it make sense to compare GDP across countries to get a sense of how prosperous the countries are? • GDP per capita is gross domestic product divided by the population of a country to give a measure of national income person

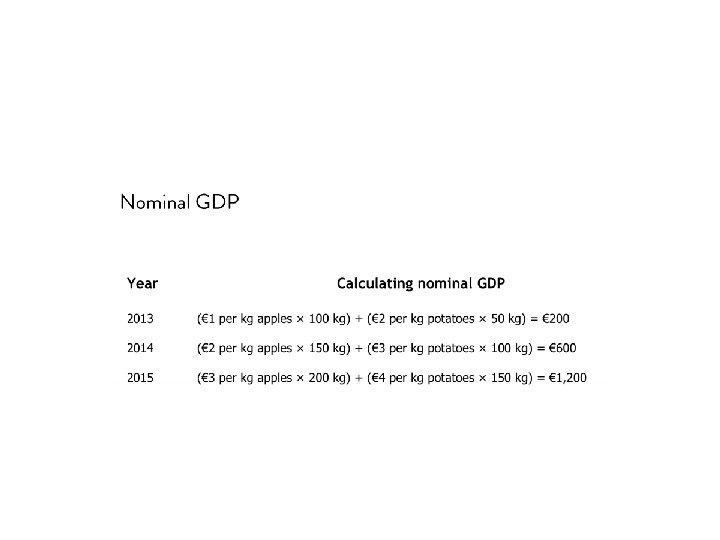
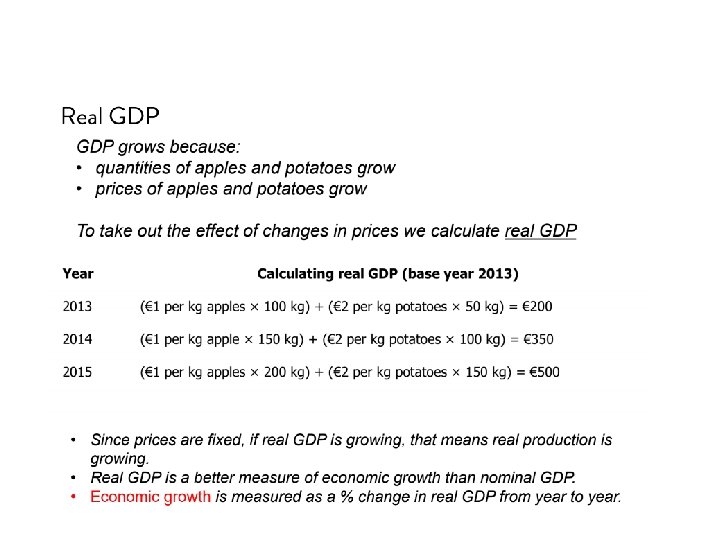
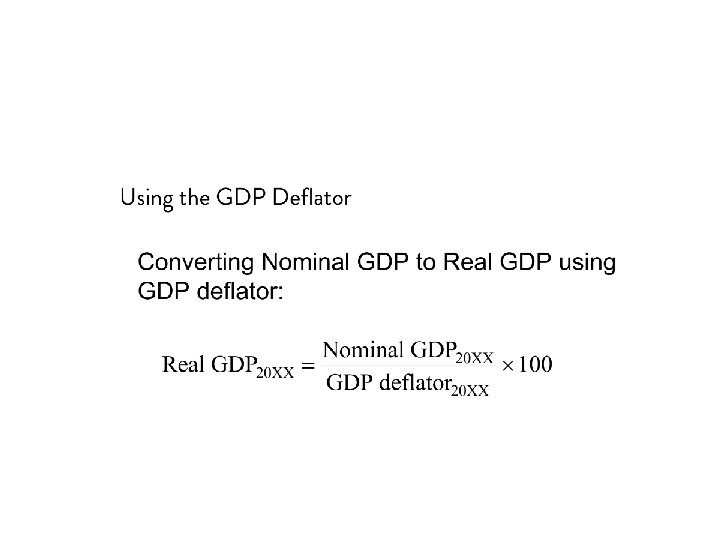
• Real vs. nominal GDP • Nominal GDP values the production of goods and services at current prices (i. e. market prices). • Real GDP values the production of goods and services at constant prices. – Prices are kept equal to the prices of the base year. This eliminates the effect of inflation on GDP.

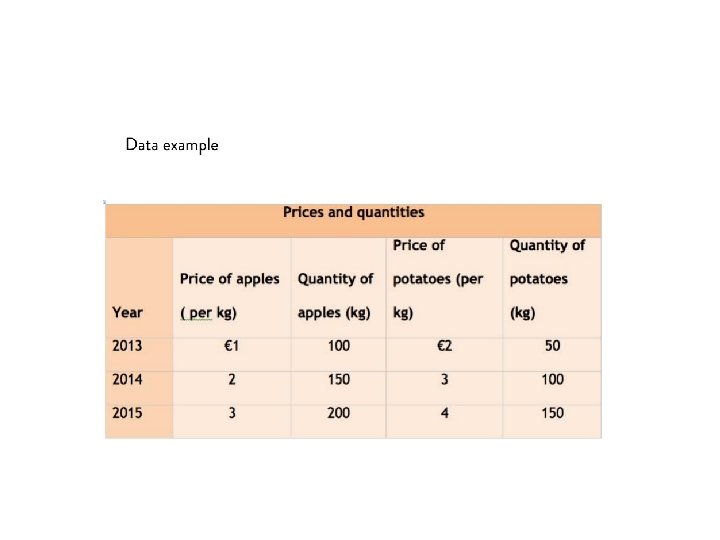
• A numerical example • An economy produces only two goods – apples and potatoes • The following table shows the quantities of the two goods produced and their prices in the years 2013, 2014 and 2015.

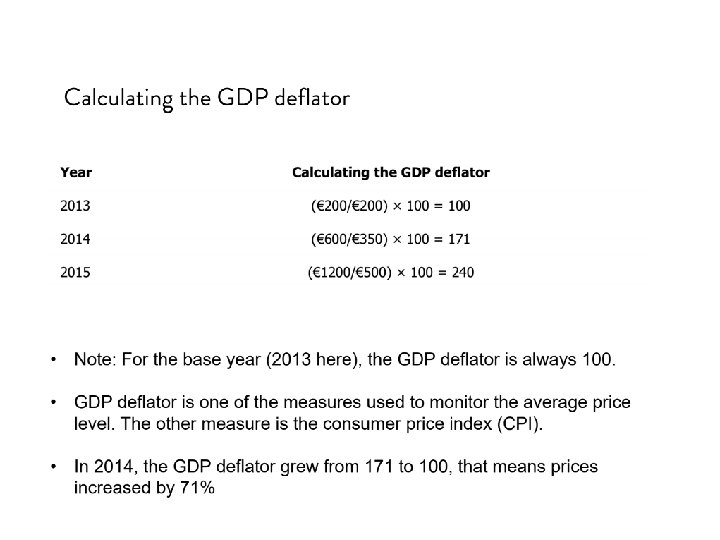
• The GDP deflator is a measure of the price level calculated as the ratio of nominal GDP to real GDP times 100.
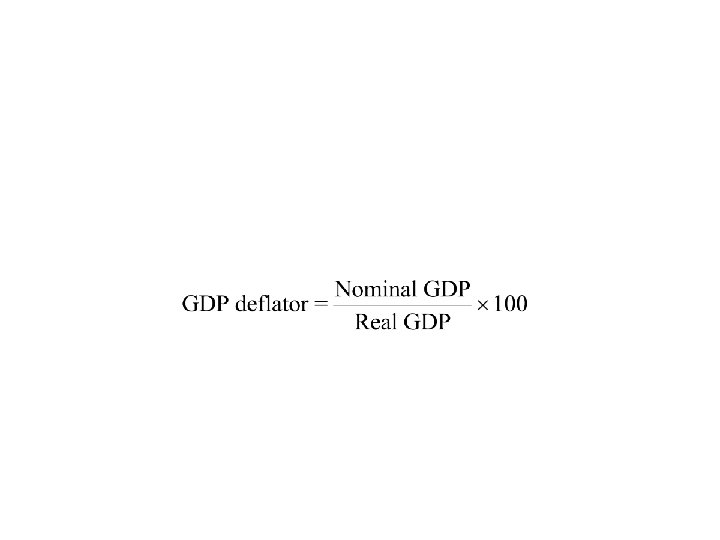

• It tells us the rise in nominal GDP that is attributable to a rise in prices rather than a rise in the quantities produced.

• National agencies responsible for GDP measurement • • EU: Eurostat Finland: Tilastokeskus Italy: Istituto Nazionale di Statistica (ISTAT) Russia: Federal Service of State Statistics (Rosstat) UK: the Office for National Statistics (ONS) United States: Bureau of Economic Analysis (BEA) Vietnam: General Statistics Office (GSO, Tổng cục Thốngkê)

• GDP and economic well-being • GDP is probably the best single measure of the economic well-being of a society. – GDP person tells us the mean income and expenditure of the people in the economy. – Higher GDP person indicates a higher standard of living. • More education, healthcare, etc

• But of course using GDPpc is not a perfect metric for wellbeing – Can mask some undesirable things

• GPDpc doesn’t take into consideration: – Value of leisure – Environmental quality – Level of social problems – Income distribution

• Happiness indices • Other measures that have been developed that take into account such factors as environment, crime, volunteering, etc are: – – Measure of Domestic Progress (MDP) Measure of Economic Welfare (MEW) Index of Sustainable Economic Welfare Genuine Progress Indicator • These measures are not widely accepted. • Trust them…or don’t…
 In the blank preceding each event below, indicate whether the")
• 3 ) In the blank preceding each event below, indicate whether the event would increase (+ ), decrease (-), or not change (0) GDP. • • ____ A) I hire a maid to clean my house through a cleaning company I find in the phone book. • • ____B) I then fall in love with the maid (from part A), marry her, and she agrees to be a housewife. • • ____C) Your gardener quits (deciding it is more profitable to sell marijuana than cut grass). • • ____D) A burglar steals your stereo. • • ____E) You buy a new stereo to replace the one that was stolen.
 Master Pai Mei teaches you the five-point-palm-exploding heart technique in exchange")
• ____F) Master Pai Mei teaches you the five-point-palm-exploding heart technique in exchange for you cleaning his house and cooking for him. • • ____G) I sell my prized David Hasselhoff autographed 8 x 10 (that I originally bought in 1987) for some hard cash. • • ____H) The fraction of women working outside the home increases. • • ____I) Mr. Lebowski pays the $1 million ransom to the kidnappers responsible for abducting his wife. • • ____J) Walt leaves his job as a school teacher to make and sell illegal drugs
- Slides: 39