
SESSION 3 STATISTICS ANALYSIS AND INTERPRETATION Presented by
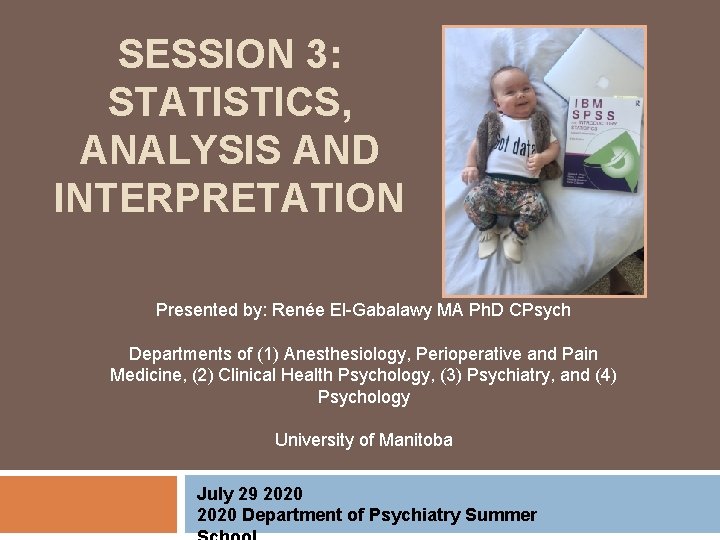
SESSION 3: STATISTICS, ANALYSIS AND INTERPRETATION Presented by: Renée El-Gabalawy MA Ph. D CPsych Departments of (1) Anesthesiology, Perioperative and Pain Medicine, (2) Clinical Health Psychology, (3) Psychiatry, and (4) Psychology University of Manitoba July 29 2020 Department of Psychiatry Summer
Part 1: How to manage data
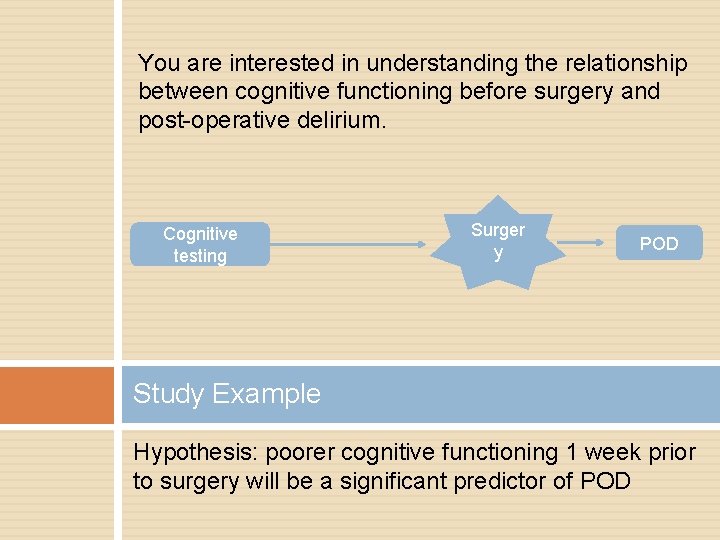
You are interested in understanding the relationship between cognitive functioning before surgery and post-operative delirium. Cognitive testing Surger y POD Study Example Hypothesis: poorer cognitive functioning 1 week prior to surgery will be a significant predictor of POD
Creating a Successful Data Plan STEP 1: Create specific data collection plan � Who will be your participants and how will you recruit them? � Type of surgery? Emergent vs non emergent? How many participants will you need to answer your research question? Power analysis � How will you assess cognitive functioning and POD? � Are there other variables that might impact this relationship that you should test for? � Do you care about what happens surgically? How will you recruit participants and get informed consent?
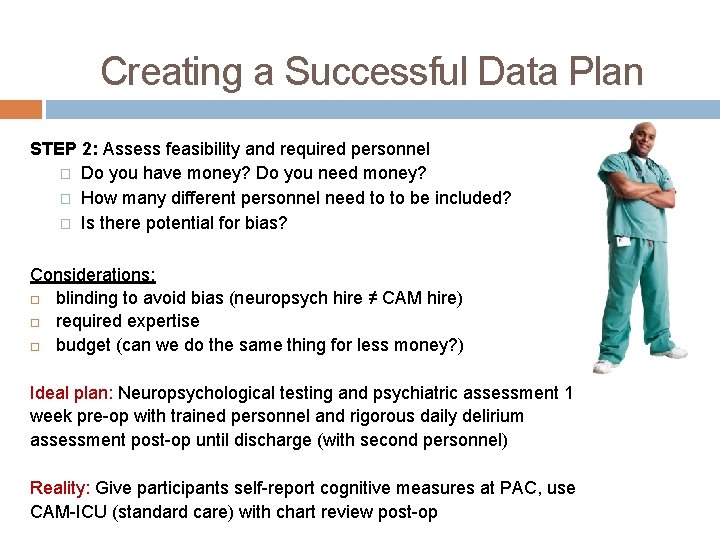
Creating a Successful Data Plan STEP 2: Assess feasibility and required personnel � Do you have money? Do you need money? � How many different personnel need to to be included? � Is there potential for bias? Considerations: blinding to avoid bias (neuropsych hire ≠ CAM hire) required expertise budget (can we do the same thing for less money? ) Ideal plan: Neuropsychological testing and psychiatric assessment 1 week pre-op with trained personnel and rigorous daily delirium assessment post-op until discharge (with second personnel) Reality: Give participants self-report cognitive measures at PAC, use CAM-ICU (standard care) with chart review post-op
Creating a Successful Data Plan STEP 3: Apply for ethics � Have all testing batteries prepared � Personnel identified � Data monitoring and storage strategy in place � Data management: Each pt is coded with unique number. List of pts and numbers kept on password protected computer Each pt has file with number. All pt materials put in file. Files kept in locked laboratory (study personnel have key) Files = consent form, pre-op battery, periop info, all CAM assessments Important note: organization can make or break a study
Data Entry and Management STEP 4: Conduct study & select method of data entry and management (ongoing or post-study entry? ) Important elements to data entry: 1) Use excel/SPSS (or other data management platform) with clear labels 2) Use numerical values to identify patients 3) Create data dictionary where variables and values are clearly defined 4) Decide on a value for missing data (888, 99, 9? ) 5) 6) Only include text in data file when patients can report open-ended response Decide on orientation (long vs wide data)
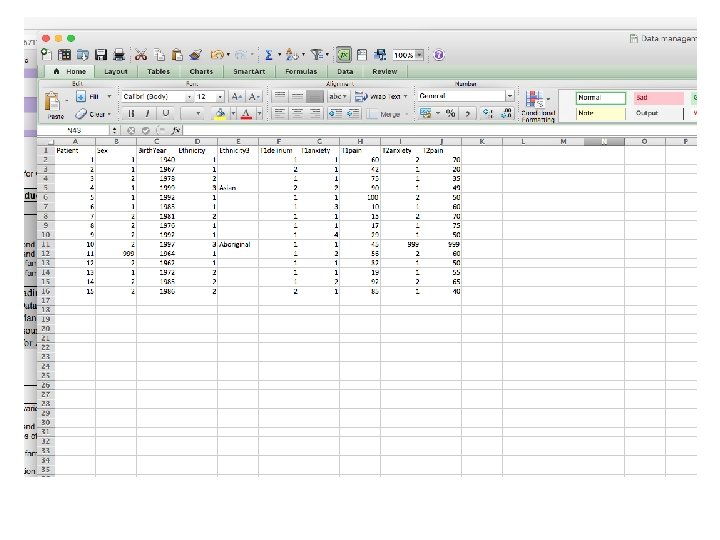
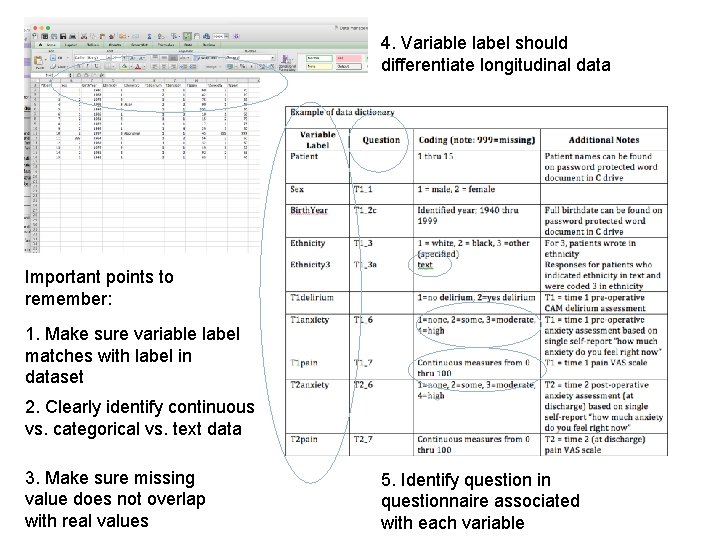
4. Variable label should differentiate longitudinal data Important points to remember: 1. Make sure variable label matches with label in dataset 2. Clearly identify continuous vs. categorical vs. text data 3. Make sure missing value does not overlap with real values 5. Identify question in questionnaire associated with each variable
Management Analysis With a well organized data file you can: � Perform basic statistics in excel � Graph your variables in excel � Transfer the data easily to statistical software (SPSS) for analysis � Clearly identify missings and analyze accordingly � Send the data and data dictionary to a statistician for analysis
Missing data
How do data go missing? You lose it (or have a poor data management strategy…) Participants not responding to certain questions � � � Order/fatigue Sensitivity/refusal Skip-outs Attrition Data entry errors Statistical coding errors
Methods to reduce missings in primary data collection Select shorter scales Avoid long, confusing questions Carefully consider alternate ways of asking sensitive questions and include surrogate questions Change ordering of scales (e. g. , have 3 different versions) Check for completeness immediately Have second person review data entry For online surveys: include forced response, or notification of blank entry
Understanding missingness Understand reasons and patterns for missing Understand distribution of missings Use this information to select the best method of analysis and imputation (if appropriate)
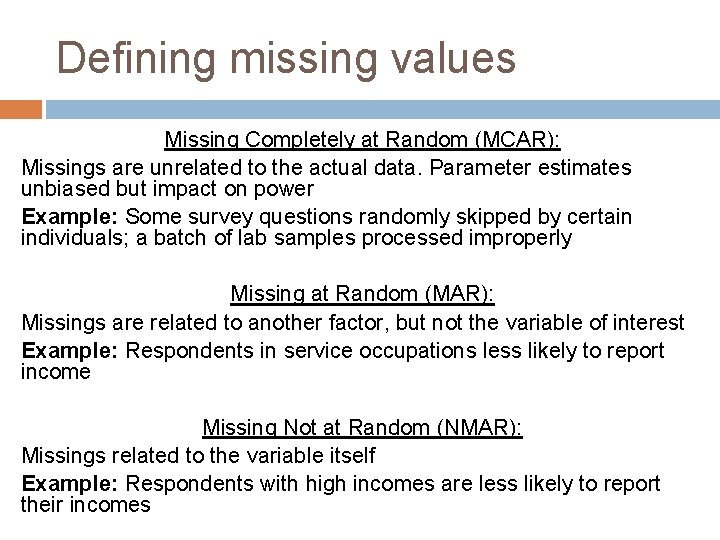
Defining missing values Missing Completely at Random (MCAR): Missings are unrelated to the actual data. Parameter estimates unbiased but impact on power Example: Some survey questions randomly skipped by certain individuals; a batch of lab samples processed improperly Missing at Random (MAR): Missings are related to another factor, but not the variable of interest Example: Respondents in service occupations less likely to report income Missing Not at Random (NMAR): Missings related to the variable itself Example: Respondents with high incomes are less likely to report their incomes
MCAR vs MNAR It is important to understand missingness as statistical methods to deal with missing often assume MCAR or MAR It is problematic to have MNAR
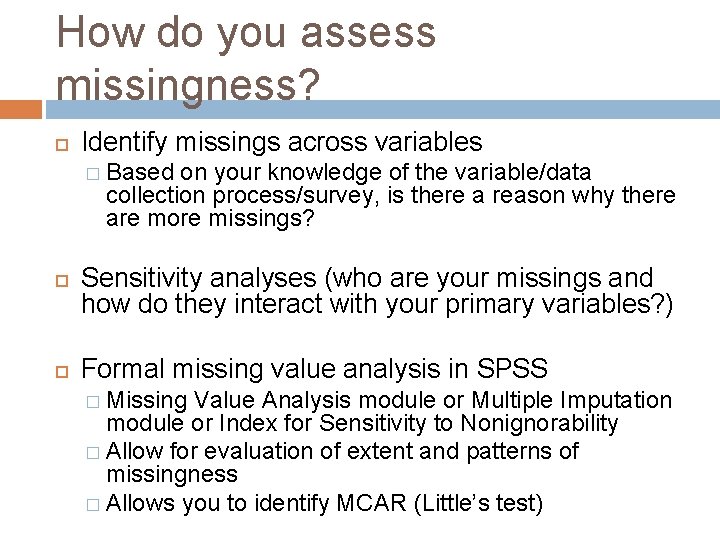
How do you assess missingness? Identify missings across variables � Based on your knowledge of the variable/data collection process/survey, is there a reason why there are more missings? Sensitivity analyses (who are your missings and how do they interact with your primary variables? ) Formal missing value analysis in SPSS � Missing Value Analysis module or Multiple Imputation module or Index for Sensitivity to Nonignorability � Allow for evaluation of extent and patterns of missingness � Allows you to identify MCAR (Little’s test)
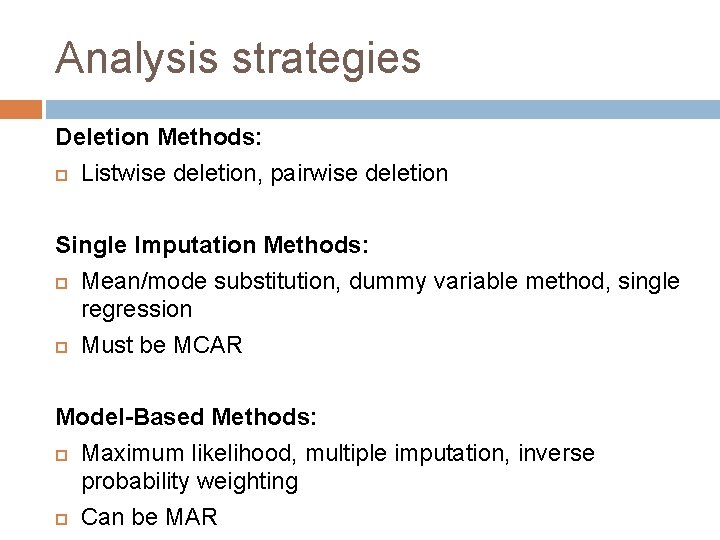
Analysis strategies Deletion Methods: Listwise deletion, pairwise deletion Single Imputation Methods: Mean/mode substitution, dummy variable method, single regression Must be MCAR Model-Based Methods: Maximum likelihood, multiple imputation, inverse probability weighting Can be MAR
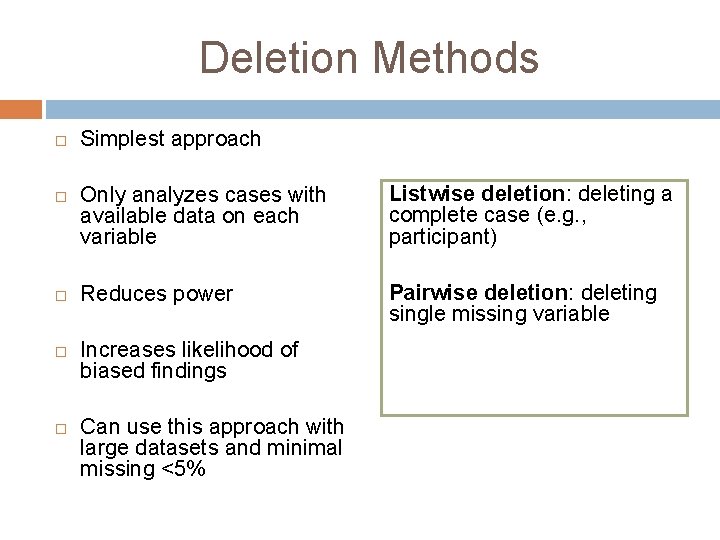
Deletion Methods Simplest approach Only analyzes cases with available data on each variable Listwise deletion: deleting a complete case (e. g. , participant) Reduces power Pairwise deletion: deleting single missing variable Increases likelihood of biased findings Can use this approach with large datasets and minimal missing <5%
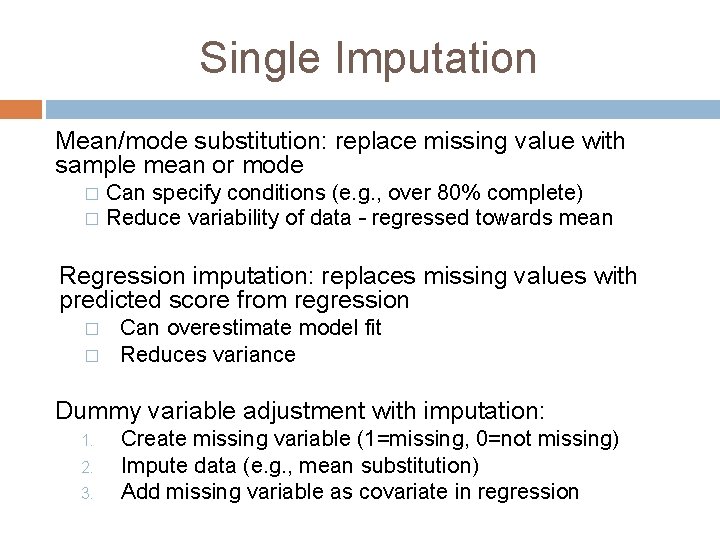
Single Imputation Mean/mode substitution: replace missing value with sample mean or mode Can specify conditions (e. g. , over 80% complete) � Reduce variability of data – regressed towards mean � Regression imputation: replaces missing values with predicted score from regression � � Can overestimate model fit Reduces variance Dummy variable adjustment with imputation: 1. 2. 3. Create missing variable (1=missing, 0=not missing) Impute data (e. g. , mean substitution) Add missing variable as covariate in regression
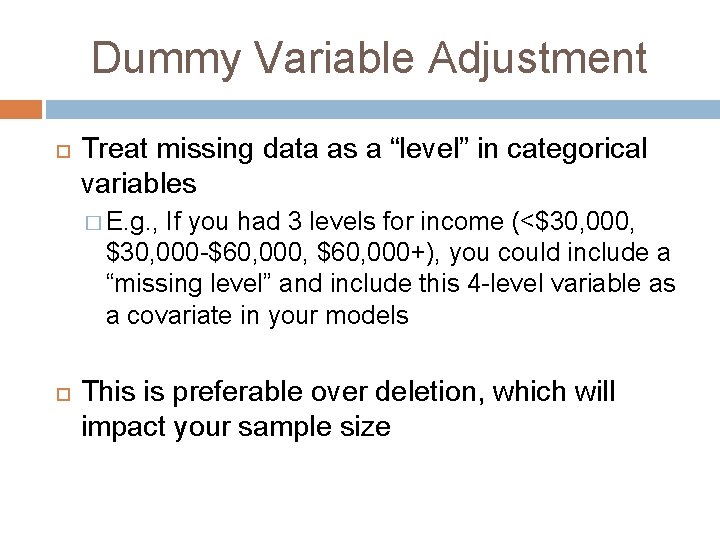
Dummy Variable Adjustment Treat missing data as a “level” in categorical variables � E. g. , If you had 3 levels for income (<$30, 000, $30, 000 -$60, 000, $60, 000+), you could include a “missing level” and include this 4 -level variable as a covariate in your models This is preferable over deletion, which will impact your sample size
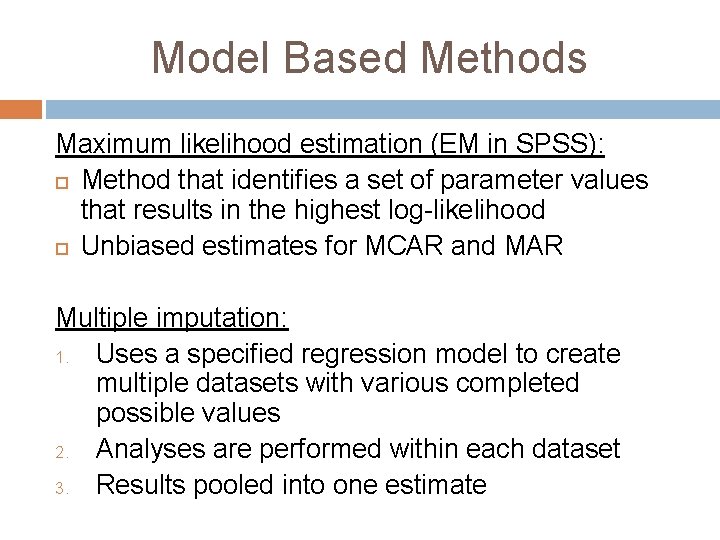
Model Based Methods Maximum likelihood estimation (EM in SPSS): Method that identifies a set of parameter values that results in the highest log-likelihood Unbiased estimates for MCAR and MAR Multiple imputation: 1. Uses a specified regression model to create multiple datasets with various completed possible values 2. Analyses are performed within each dataset 3. Results pooled into one estimate
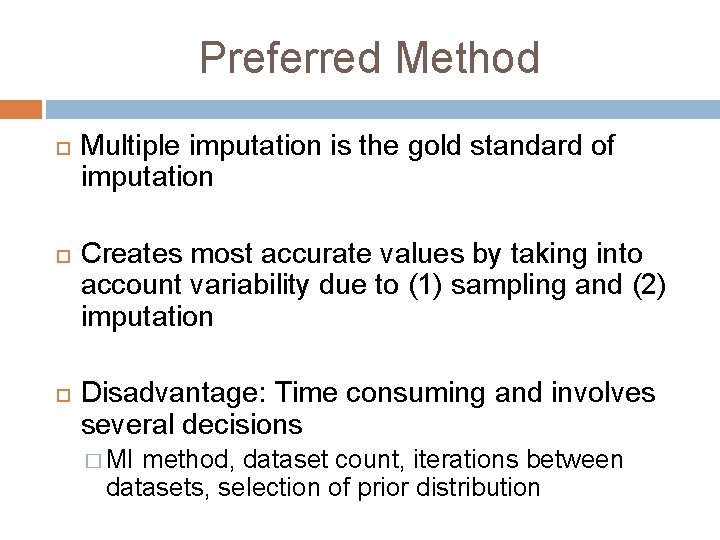
Preferred Method Multiple imputation is the gold standard of imputation Creates most accurate values by taking into account variability due to (1) sampling and (2) imputation Disadvantage: Time consuming and involves several decisions � MI method, dataset count, iterations between datasets, selection of prior distribution
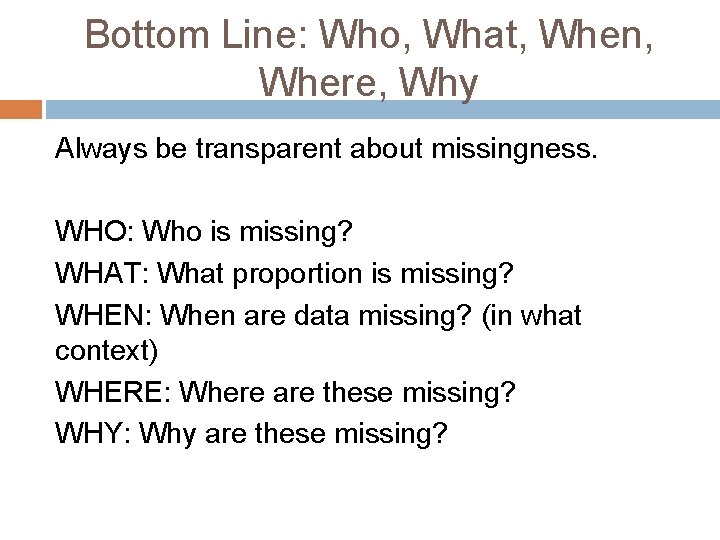
Bottom Line: Who, What, When, Where, Why Always be transparent about missingness. WHO: Who is missing? WHAT: What proportion is missing? WHEN: When are data missing? (in what context) WHERE: Where are these missing? WHY: Why are these missing?
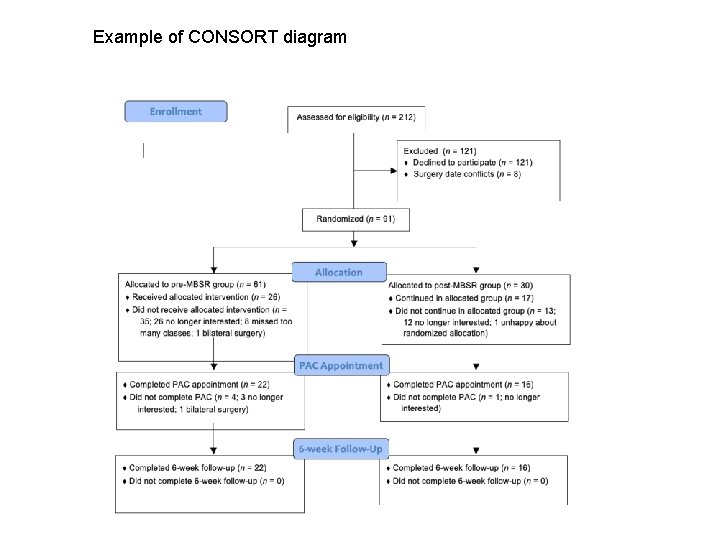
Example of CONSORT diagram

QUESTIONS
Part 2: Data analysis and interpretation
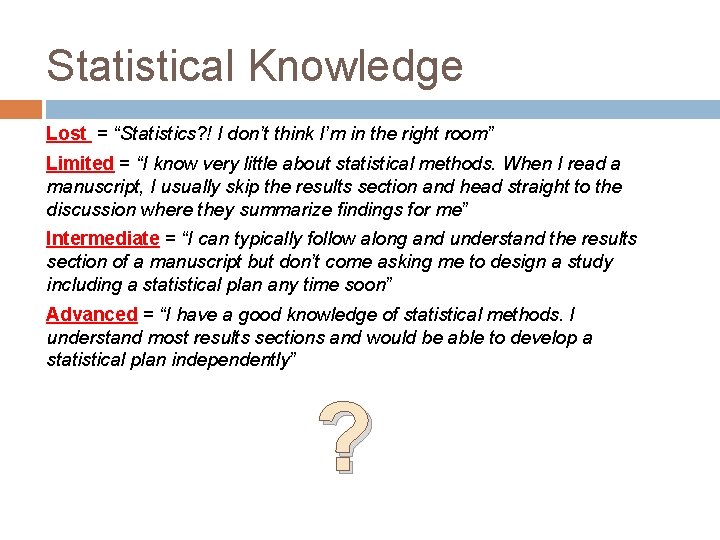
Statistical Knowledge Lost = “Statistics? ! I don’t think I’m in the right room” Limited = “I know very little about statistical methods. When I read a manuscript, I usually skip the results section and head straight to the discussion where they summarize findings for me” Intermediate = “I can typically follow along and understand the results section of a manuscript but don’t come asking me to design a study including a statistical plan any time soon” Advanced = “I have a good knowledge of statistical methods. I understand most results sections and would be able to develop a statistical plan independently” ?
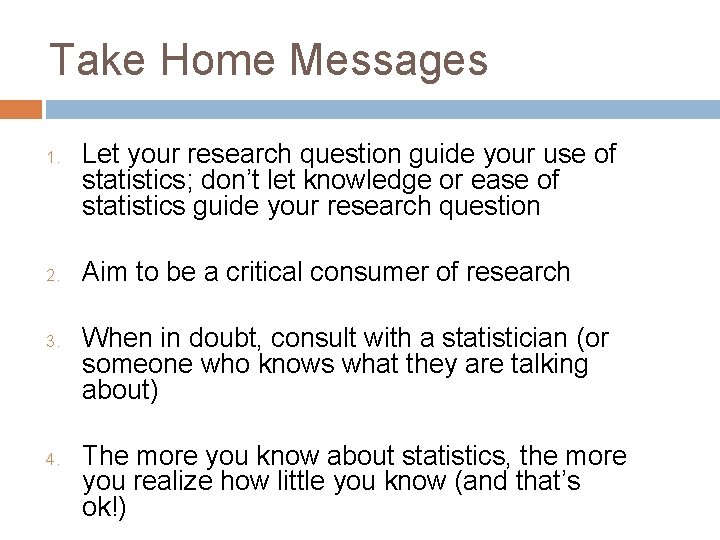
Take Home Messages 1. 2. 3. 4. Let your research question guide your use of statistics; don’t let knowledge or ease of statistics guide your research question Aim to be a critical consumer of research When in doubt, consult with a statistician (or someone who knows what they are talking about) The more you know about statistics, the more you realize how little you know (and that’s ok!)
Things I will not cover Statistical equations (that’s what SPSS/statistical programs are for) Statistical theory
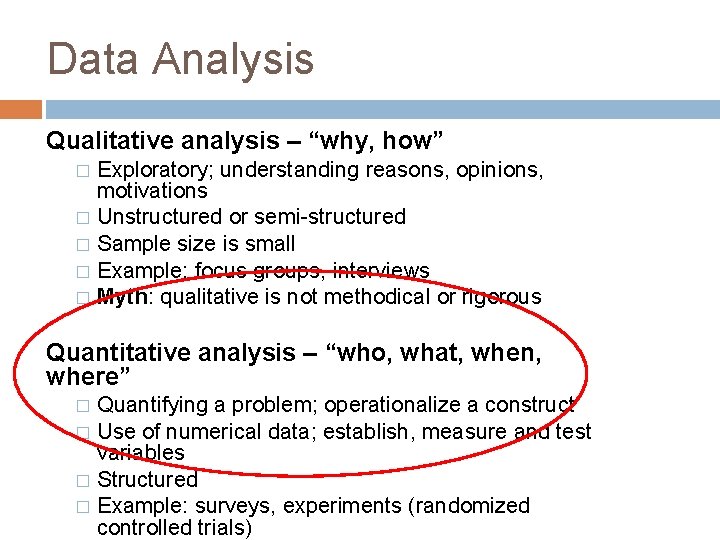
Data Analysis Qualitative analysis – “why, how” Exploratory; understanding reasons, opinions, motivations � Unstructured or semi-structured � Sample size is small � Example: focus groups, interviews � Myth: qualitative is not methodical or rigorous � Quantitative analysis – “who, what, when, where” Quantifying a problem; operationalize a construct � Use of numerical data; establish, measure and test variables � Structured � Example: surveys, experiments (randomized controlled trials) �
What to consider when selecting a statistical test What question do you want to answer? What type of sample are you working with? How are your variables measured? How are your data distributed?
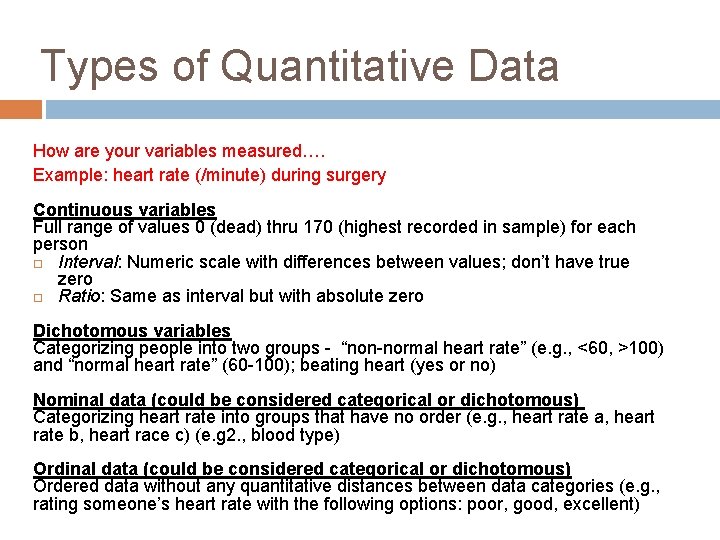
Types of Quantitative Data How are your variables measured…. Example: heart rate (/minute) during surgery Continuous variables Full range of values 0 (dead) thru 170 (highest recorded in sample) for each person Interval: Numeric scale with differences between values; don’t have true zero Ratio: Same as interval but with absolute zero Dichotomous variables Categorizing people into two groups - “non-normal heart rate” (e. g. , <60, >100) and “normal heart rate” (60 -100); beating heart (yes or no) Nominal data (could be considered categorical or dichotomous) Categorizing heart rate into groups that have no order (e. g. , heart rate a, heart rate b, heart race c) (e. g 2. , blood type) Ordinal data (could be considered categorical or dichotomous) Ordered data without any quantitative distances between data categories (e. g. , rating someone’s heart rate with the following options: poor, good, excellent)
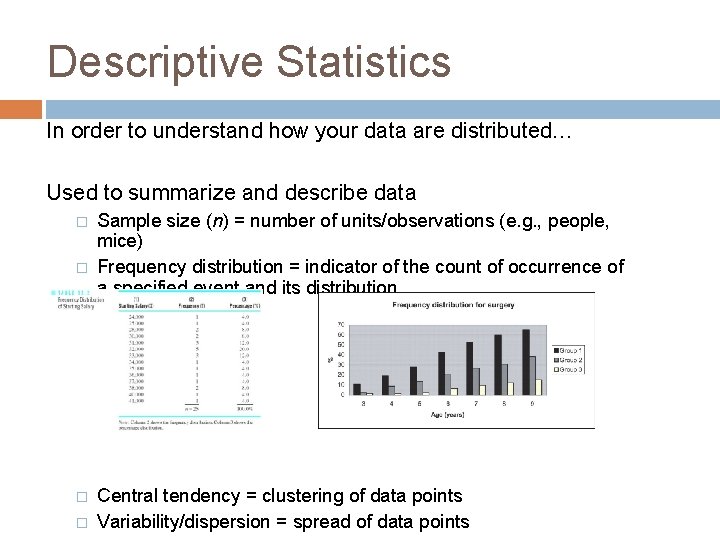
Descriptive Statistics In order to understand how your data are distributed… Used to summarize and describe data � � Sample size (n) = number of units/observations (e. g. , people, mice) Frequency distribution = indicator of the count of occurrence of a specified event and its distribution Central tendency = clustering of data points Variability/dispersion = spread of data points
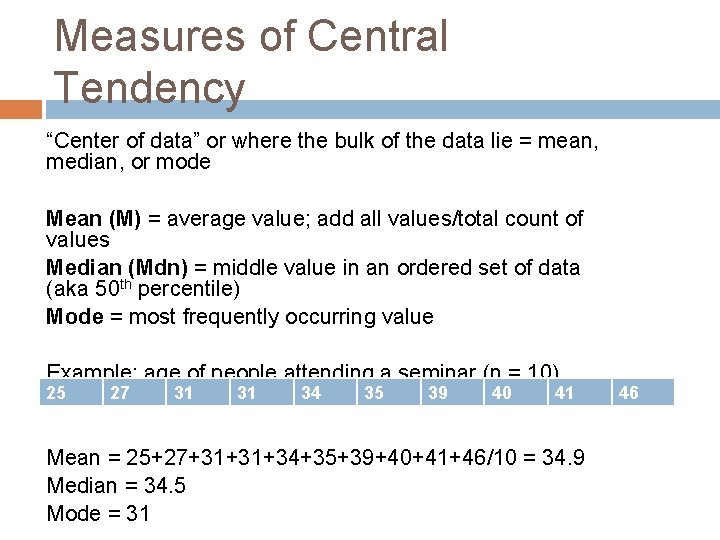
Measures of Central Tendency “Center of data” or where the bulk of the data lie = mean, median, or mode Mean (M) = average value; add all values/total count of values Median (Mdn) = middle value in an ordered set of data (aka 50 th percentile) Mode = most frequently occurring value Example: age of people attending a seminar (n = 10) 25 27 31 31 34 35 39 40 41 Mean = 25+27+31+31+34+35+39+40+41+46/10 = 34. 9 Median = 34. 5 Mode = 31 46
Measures of Dispersion (spread) Range = difference between lowest and highest values; pubs usually specify min and max values Interquartile range (IQR) = 25 th percentile-75 th percentile (middle 50% of data values) Variance = a term used (often loosely) to refer to general dispersion of data points (formal def: expectation of the squared deviation of a random variable from its mean) Standard deviation (SD) = average distance between each data point and the mean (a SD closer to 0 means very little spread whereas a high SD indicates lots of spread); technically square root of the variance…but I promised no equations
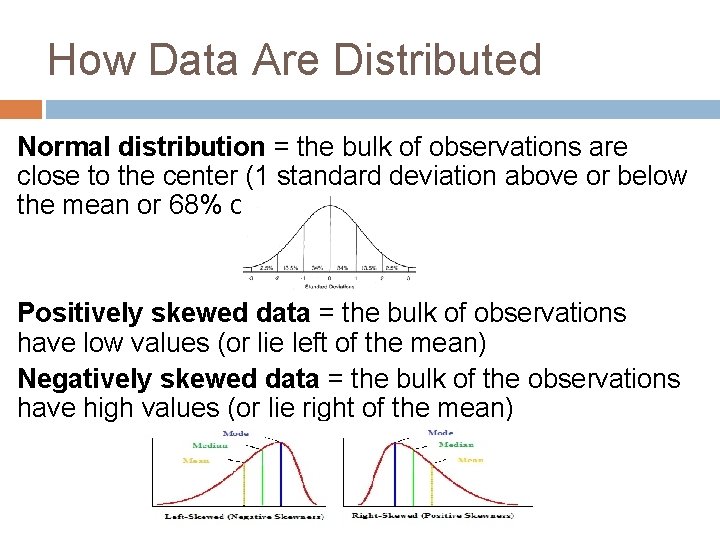
How Data Are Distributed Normal distribution = the bulk of observations are close to the center (1 standard deviation above or below the mean or 68% of the values) Positively skewed data = the bulk of observations have low values (or lie left of the mean) Negatively skewed data = the bulk of the observations have high values (or lie right of the mean)

Distribution and Statistics Does distribution really matter? YES, because it determines what type of statistical test we need to run OR if/how we need to transform our data. Type of statistical test? Normally distributed data (or close to) = parametric statistics � Interval and ratio data (e. g. , t-test, anova) Skewed data (not normally distributed) = nonparametric statistics � Nominal and ordinal data (e. g. , mann whitney u, Kruskal wallis test) How do you know the distribution of your data? (1) graph it, (2) perform skewness test in statistical program, (3) performal normality test (e. g. , z
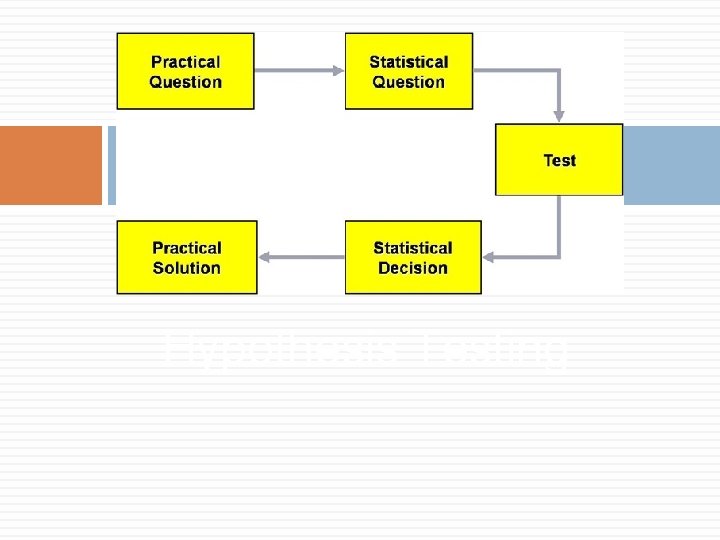
Hypothesis Testing
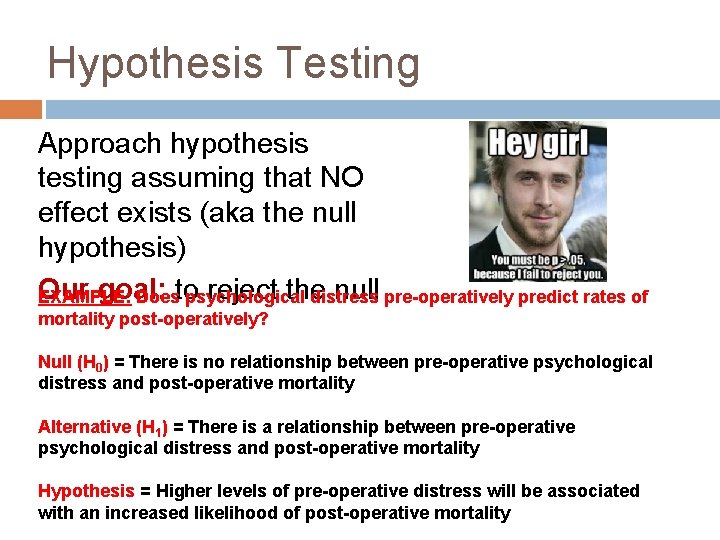
Hypothesis Testing Approach hypothesis testing assuming that NO effect exists (aka the null hypothesis) Our goal: reject the null pre-operatively predict rates of EXAMPLE: Doesto psychological distress mortality post-operatively? Null (H 0) = There is no relationship between pre-operative psychological distress and post-operative mortality Alternative (H 1) = There is a relationship between pre-operative psychological distress and post-operative mortality Hypothesis = Higher levels of pre-operative distress will be associated with an increased likelihood of post-operative mortality
Important Statistical Jargon Sampling = choosing subjects to measure; where do you get them? Independent and dependent variables = the independent variable is studied and manipulated in order to understand the effect on the dependent (outcome) variable Confounding variable = a variable (something) that is related to both the IV and DV. It can affect the relationship between the IV and the DV Mediating variable = a variable that explains the relationship between the IV and the DV in a causal sequence Moderating variable = A variable that can change the size or direction of the effect of the IV on the DV
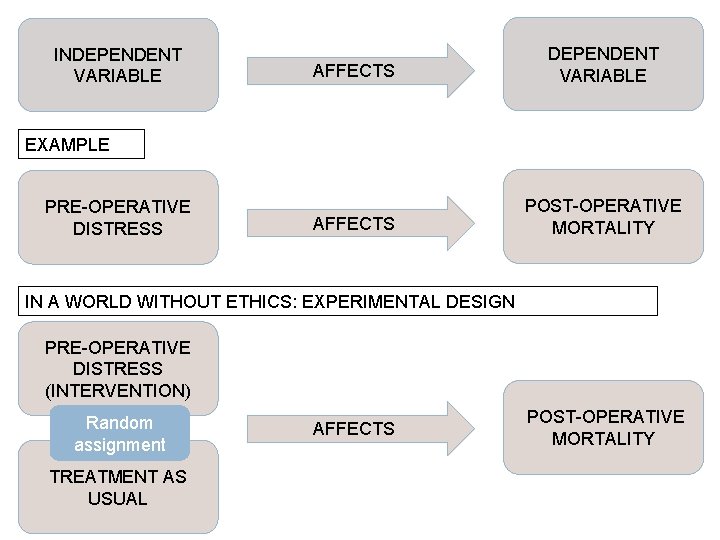
INDEPENDENT VARIABLE AFFECTS POST-OPERATIVE MORTALITY EXAMPLE PRE-OPERATIVE DISTRESS IN A WORLD WITHOUT ETHICS: EXPERIMENTAL DESIGN PRE-OPERATIVE DISTRESS (INTERVENTION) Random assignment TREATMENT AS USUAL AFFECTS POST-OPERATIVE MORTALITY
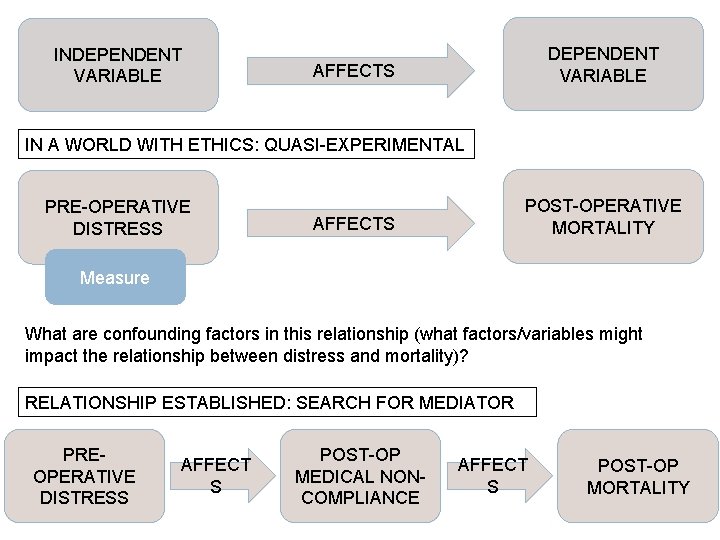
INDEPENDENT VARIABLE AFFECTS IN A WORLD WITH ETHICS: QUASI-EXPERIMENTAL PRE-OPERATIVE DISTRESS POST-OPERATIVE MORTALITY AFFECTS Measure What are confounding factors in this relationship (what factors/variables might impact the relationship between distress and mortality)? RELATIONSHIP ESTABLISHED: SEARCH FOR MEDIATOR PREOPERATIVE DISTRESS AFFECT S POST-OP MEDICAL NONCOMPLIANCE AFFECT S POST-OP MORTALITY
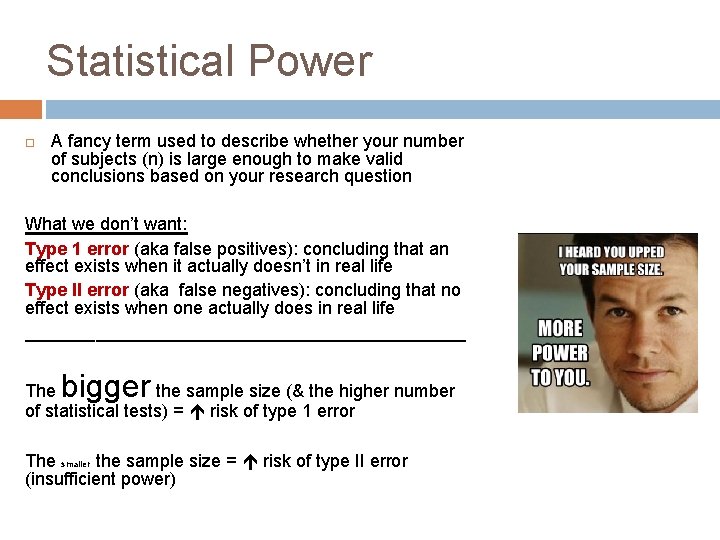
Statistical Power A fancy term used to describe whether your number of subjects (n) is large enough to make valid conclusions based on your research question What we don’t want: Type 1 error (aka false positives): concluding that an effect exists when it actually doesn’t in real life Type II error (aka false negatives): concluding that no effect exists when one actually does in real life ______________________ bigger The the sample size (& the higher number of statistical tests) = risk of type 1 error The smaller the sample size = risk of type II error (insufficient power)
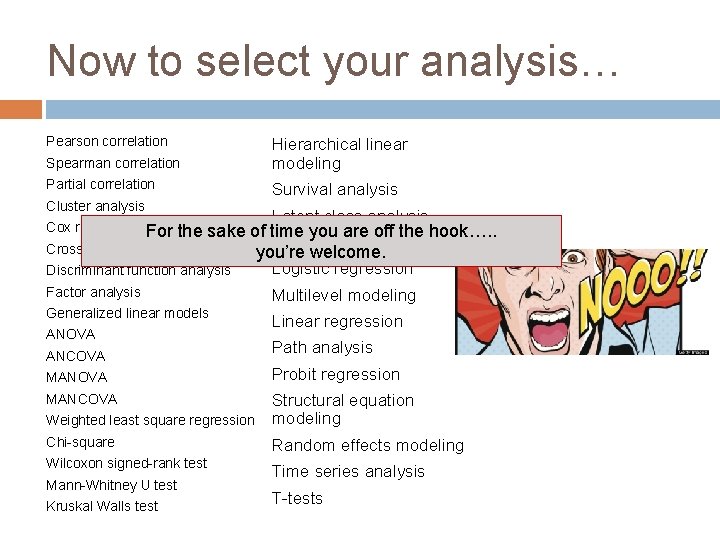
Now to select your analysis… Pearson correlation Spearman correlation Hierarchical linear modeling Partial correlation Survival analysis Cluster analysis Cox regression Latent class analysis For the sake of time you are off the hook…. . Linear mixed models Crosstabulation you’re welcome. Discriminant function analysis Logistic regression Factor analysis Multilevel modeling Generalized linear models Linear regression ANOVA ANCOVA Path analysis MANOVA Probit regression MANCOVA Weighted least square regression Structural equation modeling Chi-square Random effects modeling Wilcoxon signed-rank test Time series analysis Mann-Whitney U test Kruskal Walls test T-tests
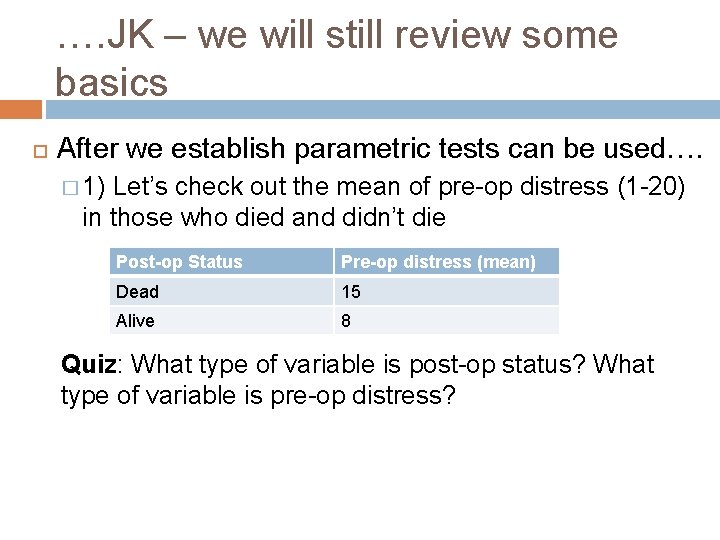
…. JK – we will still review some basics After we establish parametric tests can be used…. � 1) Let’s check out the mean of pre-op distress (1 -20) in those who died and didn’t die Post-op Status Pre-op distress (mean) Dead 15 Alive 8 Quiz: What type of variable is post-op status? What type of variable is pre-op distress?
Do the means differ? Is the mean distress score statistically different between those who are dead and alive? How would we test this? � T-tests will assess whethere is a significant difference in the means between two independent groups (on a normally distributed variable) What happens if we had more than 2 groups? (e. g. , in ICU) � ANOVA groups will allow you to compare means of 3 or more
Confounding variables In our study, what are potential confounding variables? � Type of surgery � Sex � Age � Pre-op morbidity How can we account for all these factors that likely play a role? � Include as covariates in a statistical model � Run a logistic regression (DV = death)
Interpreting Findings The holy grail of statistical decision making = Not so fast… PVALUES
So Now What? Health research is now emphasizing: 1) the importance of effect sizes 2) the importance of interval estimates Effect sizes: A standardized method to universally understand the strength of a relationship b/w variables Examples: odds ratios, cohen’s d, correlation coefficient (r) Interval estimates: Estimated range of possible values for an unknown population parameter Example: 95%CI (confidence interval) Meaning: 95% certainty that the true population value will lie between x and y
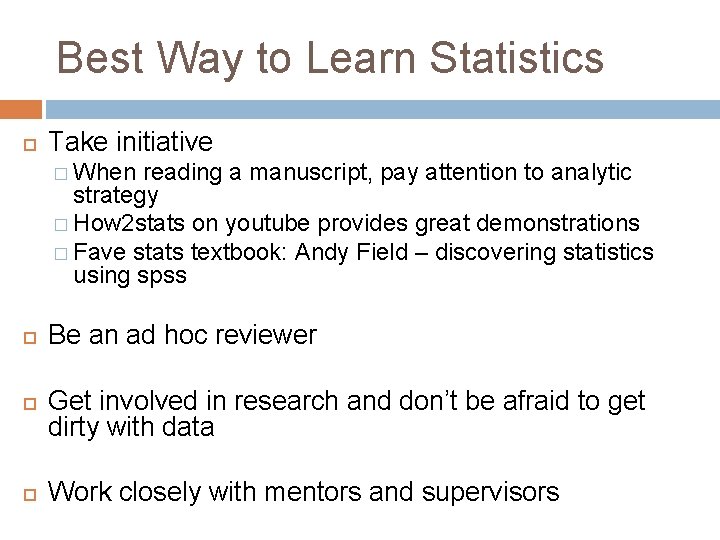
Best Way to Learn Statistics Take initiative � When reading a manuscript, pay attention to analytic strategy � How 2 stats on youtube provides great demonstrations � Fave stats textbook: Andy Field – discovering statistics using spss Be an ad hoc reviewer Get involved in research and don’t be afraid to get dirty with data Work closely with mentors and supervisors
Contact Where to find me: Research Office: AE 211, Harry Medovy House, 671 William Avenue Health, Anxiety, and Trauma Lab: AE 207, Harry Medovy House, 671 William Avenue Clinical Office: PZ-339 771 Bannatyne Avenue E-mail me: renee. el-gabalawy@umanitoba. ca Website: www. healthtraumalab. com Twitter: @UM_HATLab
Missing Data with SPSS Tips and Tricks
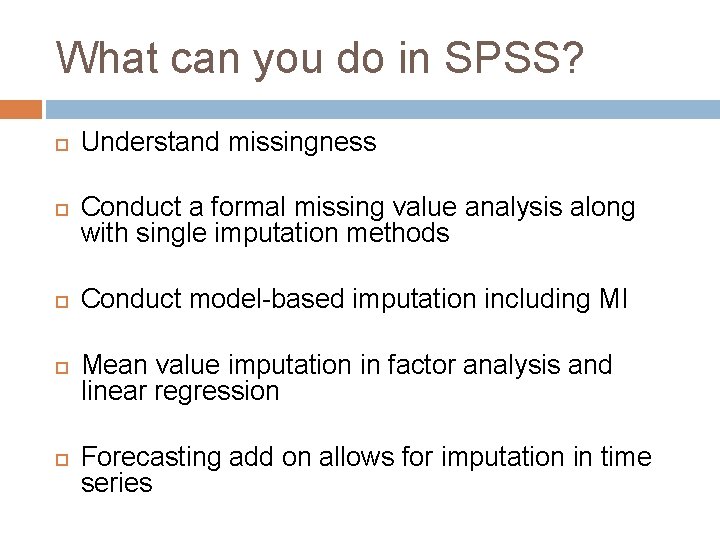
What can you do in SPSS? Understand missingness Conduct a formal missing value analysis along with single imputation methods Conduct model-based imputation including MI Mean value imputation in factor analysis and linear regression Forecasting add on allows for imputation in time series
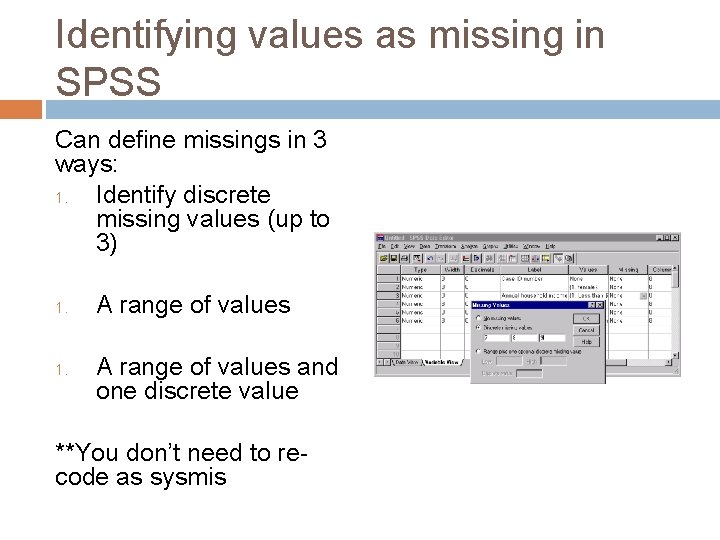
Identifying values as missing in SPSS Can define missings in 3 ways: 1. Identify discrete missing values (up to 3) 1. A range of values and one discrete value **You don’t need to recode as sysmis
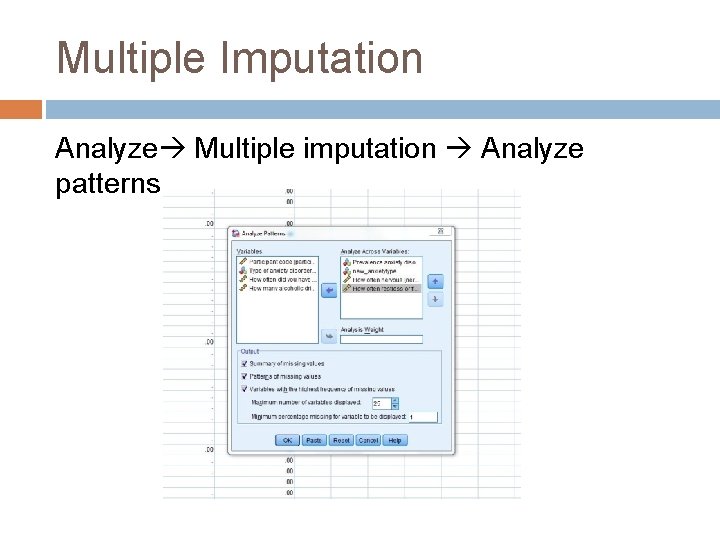
Understanding missings in SPSS Run frequencies on all primary variables to understand the n that is missing � Identify variables that have high missings: Based on your knowledge of the variable/data collection process/survey, is there a reason why there are more missings? Understand pattern of missingness and ignorability � Missing Value Analysis module or Multiple Imputation module or Index for Sensitivity to Nonignorability
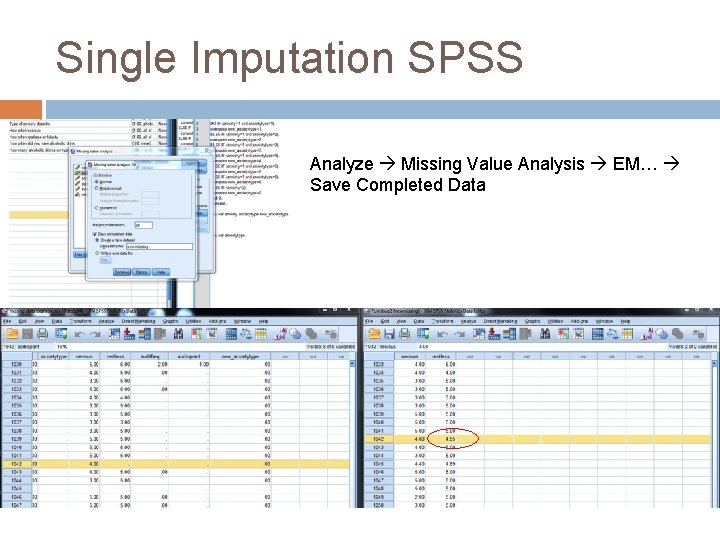
Missing Value Analysis Describes pattern of missing data: where they are located, how extensive they are, is missingness random, do pairs of variables tend to have missings � Little’s MCAR test Estimates means, SDs, correlations etc for missing value methods Conducts single imputation
Example SPSS dataset Primary Variables: 1) Anxiety (yes, no) 2) Anxiety type (phobia, ocd, gad, ptsd, panic, other) 3) How nervous are you (1 thru 5) 4) How restless are you (1 thru 5) 5) Frequency of alcohol use (never to 4 or more times per week) 6) Quantity of alcohol use (1 -2/day to 10+/day) Does anything stand out that may impact missingness?
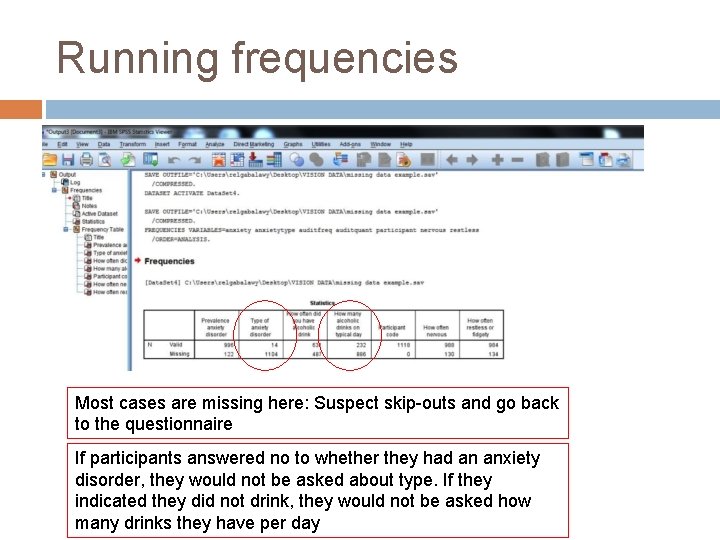
Running frequencies Most cases are missing here: Suspect skip-outs and go back to the questionnaire If participants answered no to whether they had an anxiety disorder, they would not be asked about type. If they indicated they did not drink, they would not be asked how many drinks they have per day
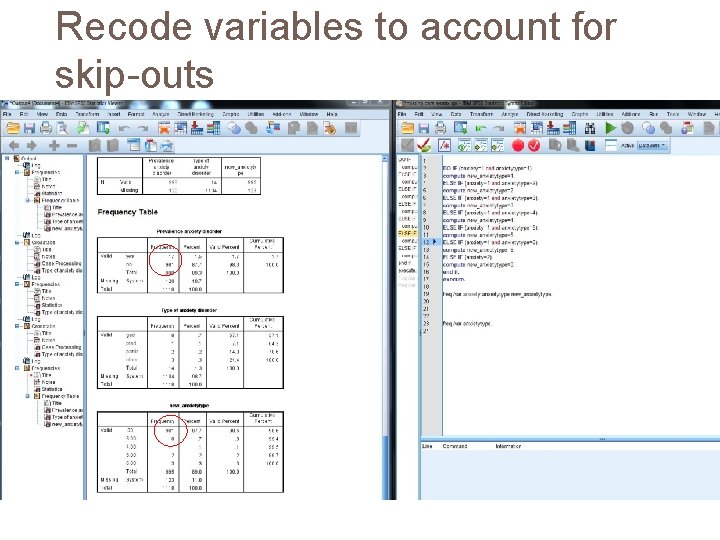
Recode variables to account for skip-outs
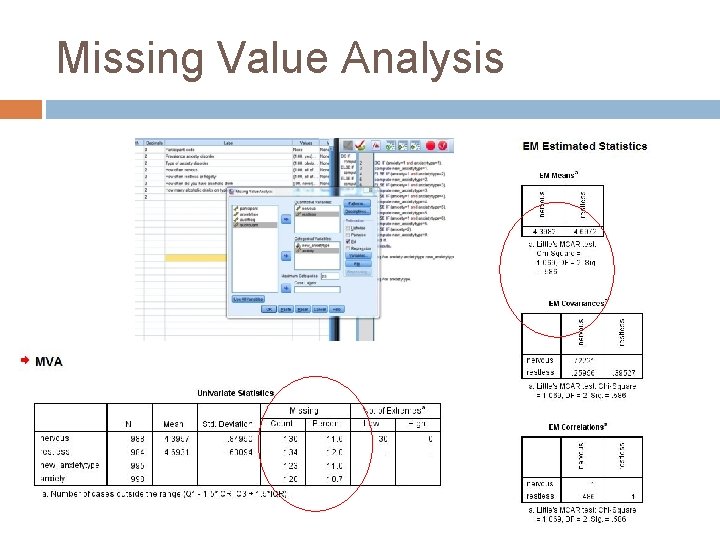
Missing Value Analysis
Missing Value Analysis The continuous measures of nervous and restless have a non-significant Little’s MCAR test � This is a good thing! Fail to reject the null, which means that data are missing in a random way Can proceed with single imputation (with continuous measures)
Replace missing values Expectation maximization approach Ensure that imputation is done on variables that are coded appropriately (e. g. reverse code) and complete by subscale (homogeneous items) Use multiple items to enhance accuracy
Single Imputation SPSS Analyze Missing Value Analysis EM… Save Completed Data
Multiple Imputation Analyze Multiple imputation Analyze patterns
Multiple Imputation: Missing Patterns 100% of the variables have at least some missing data 86. 85% have complete cases (rows complete) 88. 53% of cells have data Should not impute variables with >15% missing
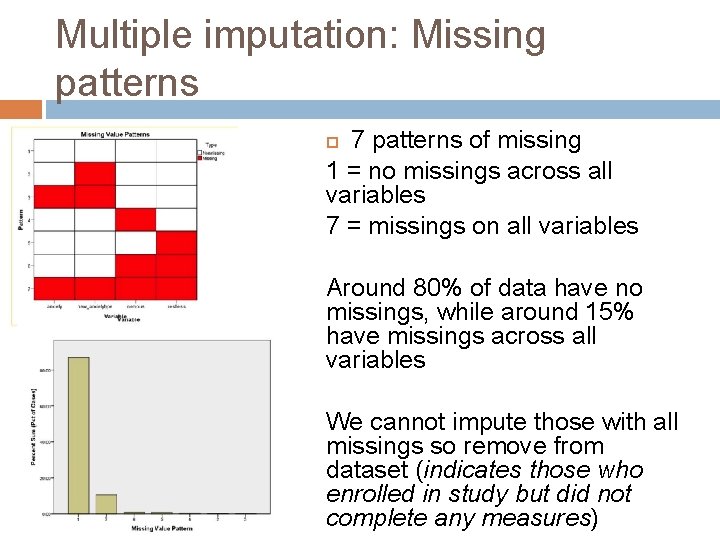
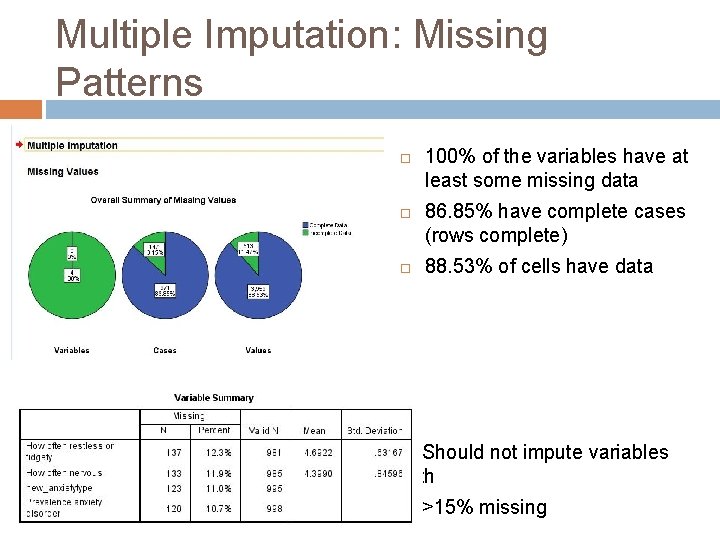
Multiple imputation: Missing patterns 7 patterns of missing 1 = no missings across all variables 7 = missings on all variables Around 80% of data have no missings, while around 15% have missings across all variables We cannot impute those with all missings so remove from dataset (indicates those who enrolled in study but did not complete any measures)
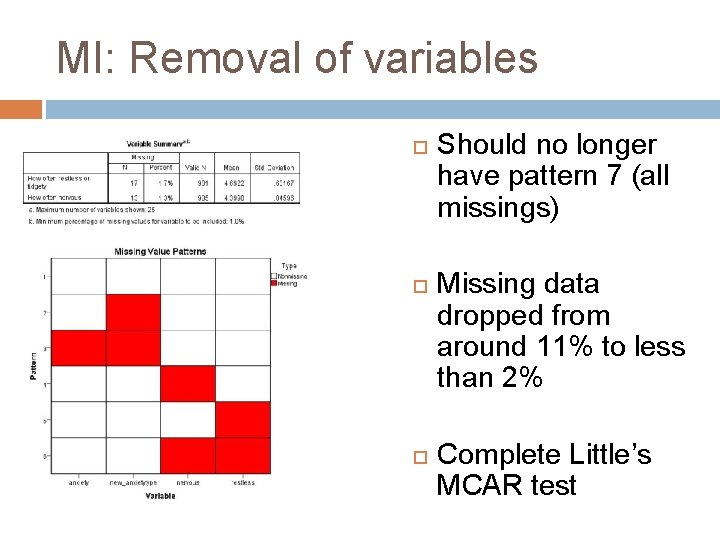
MI: Removal of variables Should no longer have pattern 7 (all missings) Missing data dropped from around 11% to less than 2% Complete Little’s MCAR test
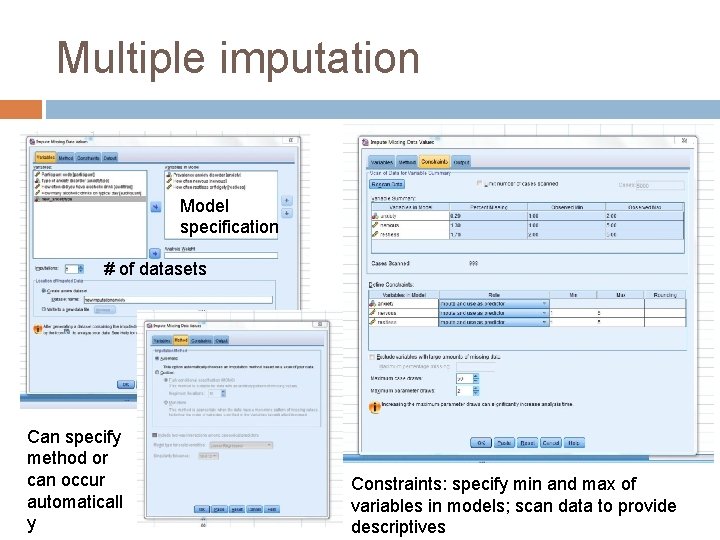
Multiple imputation Model specification # of datasets Can specify method or can occur automaticall y Constraints: specify min and max of variables in models; scan data to provide descriptives
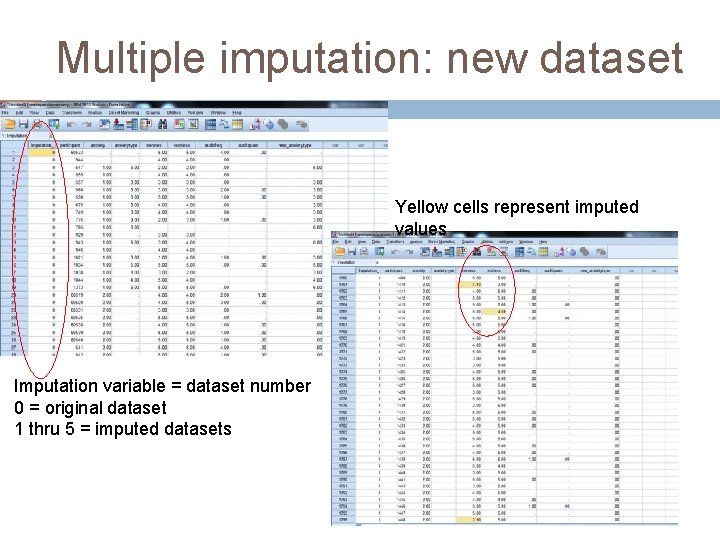
Multiple imputation: new dataset Yellow cells represent imputed values Imputation variable = dataset number 0 = original dataset 1 thru 5 = imputed datasets
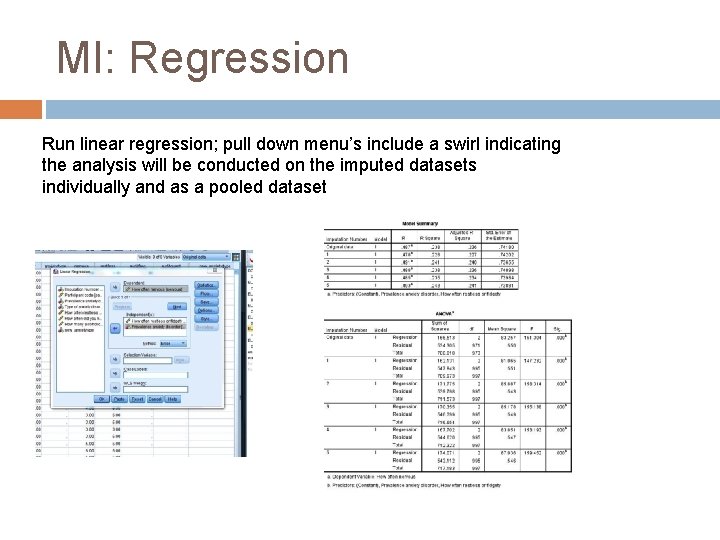
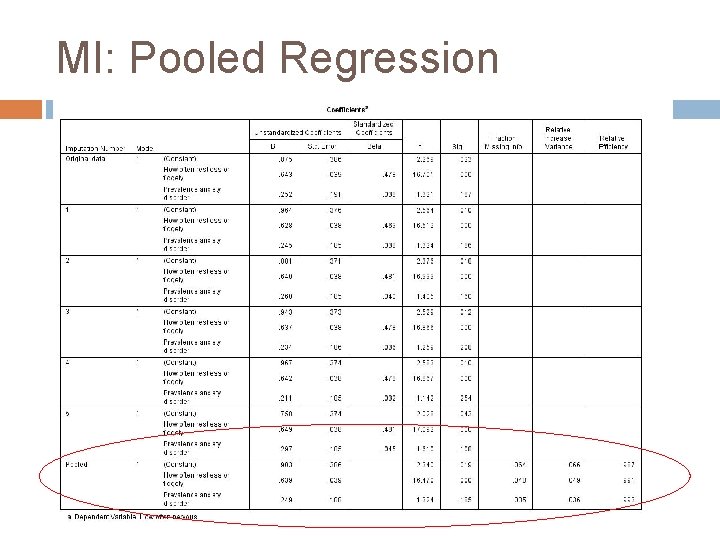
MI: Regression Run linear regression; pull down menu’s include a swirl indicating the analysis will be conducted on the imputed datasets individually and as a pooled dataset
MI: Pooled Regression
- Slides: 72