Session 11 Model Calibration Validation and Reasonableness Checks

Session 11: Model Calibration, Validation, and Reasonableness Checks Source: NHI course on Travel Demand Forecasting (152054 A)

Objectives: • Identify and interpret trends affecting travel demand • Explain difference between calibration and validation • Identify critical reasonableness checks – socioeconomic – travel survey – network – trip generation – mode split – trip assignment

Terminology • Model Calibration • Model Validation – Reasonableness checks – Sensitivity checks Is the model sensitive to policy options? • Special generators • Screen lines (some modelers do not think this is important)

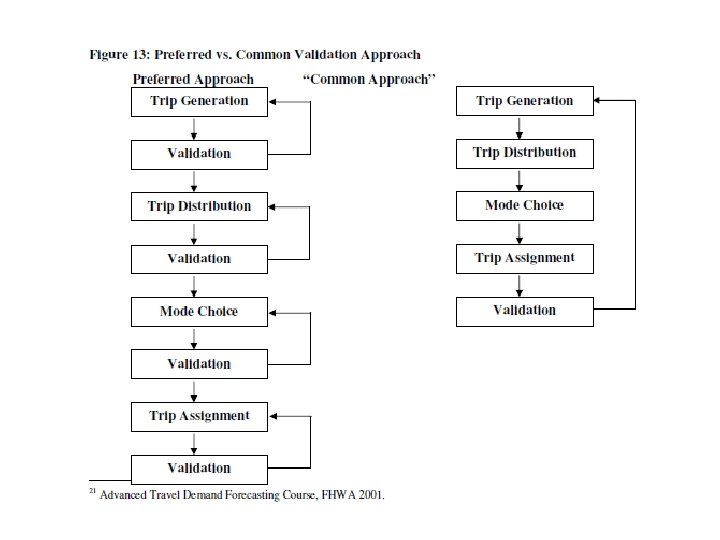
Key Concepts • Not enough attention on model evaluation and reasonableness checks • Checks performed after each step – reduces error propagation Errors can also “cancel”

Planner responsibilities • Actively involve all participants – – Modelers Planners Decision makers Public • Fairly present all alternatives – Timely – Unbiased • Identify (clearly) the decision making process – Who, when, and how – Allows input from all interested groups • You must rely on the TDM – Therefore, must be validated – Accurate and easy to understand (documented)

Trends Affecting Travel Demand • Planners should monitor the following trends: – – – – Demographics Composition of the labor force Immigration and emigration Regional economic development Modal shares Vehicle occupancy Average trip length Freight transport Must be aware of trends to ensure reasonable forecasts • Are trends consistent with assumptions made in the modeling process?

Information Requirements for Validation and Reasonableness • • • Demographics and employment Highway and transit networks Model specification Base year survey Base year traffic counts
")
Sources of Error • Coding • Sampling • Computation (if done by Improper hand) structure of • Specification model, e. g. , wrong variables • Data Transfer • Data aggregation

How do you judge a model/recommend improvement? Scrutinize these characteristics: • Data requirements • Hardware requirements • Logic of structure and conceptual appeal • Ease of calibration • Effectiveness of the model (accuracy, sensitivity) • Flexibility in application • Types of available outputs • Operational costs • Experience and successes to date • Public or private domain availability • Compatibility with other models and model types
 ►Network Data")
Evaluation and Reasonableness Checks Overview Complete? Level of Detail? Transportation system (supply) ►Network Data Number and location of households and employment (demand) ►Socioeconomic Data TDF ►Model Specification ►Model validation and calibration Sensitive? Documentation of calibration? Valid for base year? Transportation system performance Reasonable? Methodology? Source? Travel survey data Current? Reasonable?

Feedback Loop Model Calibration and Validation Model Calibration Model Validation Model Application

Model Validation • Validation of new model – Model applied to complete model chain – Base year model compared to observed travel – Judgment as to model suitability, return to calibration if not • Validation of a previously calibrated model – Compare to a new base year, with new … • • SE data Special gen. Network Counts “Transportation Conformity Guidelines” (Air Quality) require model validated < 10 years ago

Socioeconomic Data: Check Reasonableness • review. Source for estimates and forecasts • Population and household size trends (graph 1950 to present and check trend) • Household income trends (graph as far back as this goes … 1990? ) • Check dollar values used in forecast (use constant dollars) • If used, check trend of automotive availability (S curve? ) • Check distribution of employment by type (basic, retail, service) over time • Plot and check trend of employees per household and per capita … rate of increase is decreasing • Check future household and employment changes by zone

e v i it s n se ? t e o n ric l e lp v a ue r T f to http: //www. eia. doe. gov/oiaf/aeo/pdf/trend_4. pdf

Travel Survey Data Reasonableness Checks • Determine source of travel survey data – Types of survey conducted – Year of survey • If no survey (borrowed) – Check source of trip rates, lengths, TLFD – Is area similar • Geographic area? • pop/HH/empl. characteristics? • Urban density and trans system? • Compare to similar regions and to same region in earlier times: – Person trip rates by trip purpose – Mean trip lengths by trip purpose • HBW longest? HBO shortest? – TLFDs by trip purpose

Network Data Reasonableness Checks • Check Trees for 2 -3 major attractions • Check coded facility types – how used (BPR? )? • Verify speed and capacity look-up table (what LOS used for capacity? ) • Significant transportation projects – narrative included? Still viable? • Consistency with MTP • Plot (facility types, # lanes, speeds, area types) to detect coding errors

Trip Generation Reasonableness Checks • Examine trip production and attraction models – Form? – sensitivity? • Examine trip purposes used • External-through and external-local trips – how modeled? • Truck trips – how modeled? • Person trip or vehicle trip rates used? • P&A balance (0. 9 -1. 1 ok) • Special generators (check, and be consistent in future model)

Trip Generation Calibration Typical Values • • Person trips per household: 8. 5 to 10. 5 HBW person trips per household: 1. 7 to 2. 3 HBO person trips per household: 3. 5 to 4. 8 NHB person trips per household: 1. 7 to 2. 9 HBW trips: 18% to 27% of all trips HBO trips: 47% to 54% of all trips NHB trips: 22% to 31% of all trips

Trip Generation Calibration Note: each income class is a purpose! TRIP PURPOSES Scaling Factor HBW low income 0. 795 HBW low-middle income 0. 823 HBW middle income 0. 861 HBW upper middle income 0. 908 HBW high income 0. 936 HB elementary school 0. 733 HB high school 1. 991 HB university 0. 895 HB shopping 0. 698 HB social-recreation 0. 945 HB other 0. 875 NHB work-related 0. 858 NHB other 0. 820 Truck 0. 985 Internal-external 0. 591 Scale survey for participation (relative participation) Colorado Springs 1996 Travel Demand Model Calibration

Trip Generation Calibration Reasonableness checks – compare to other cities, check future trends • • • • Population Households Average Household Size Basic employment Retail employment Service employment Military employment Population per employee Person trips person Person trips per household HBW attractions per employee HBW productions per household HB shopping attractions per retail employee 503, 345 201, 116 2. 50 76, 795 (33%) 50, 465 (24%) 101, 697 (43%) 42, 800 1. 81 4. 26 10. 65 1. 44 1. 74 5. 99 Colorado Springs 1996 Travel Demand Model Calibration
")
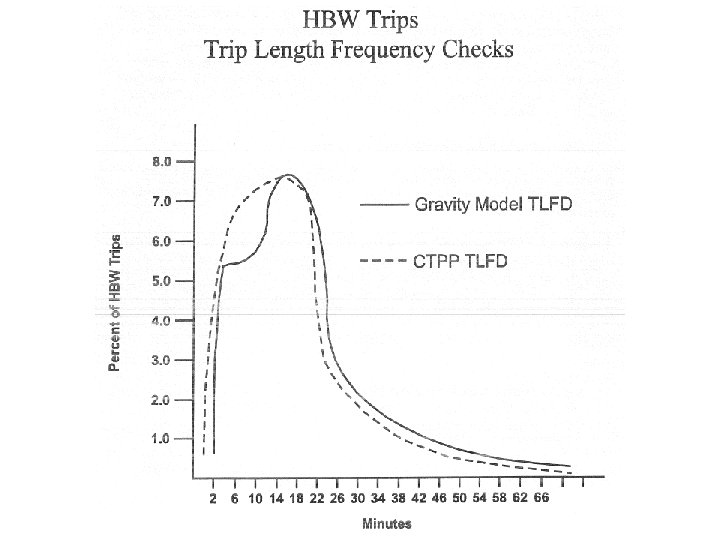
Trip Distribution Reasonableness Checks Examine … • Mean trip length (increasing or decreasing? ) • TLFDs • Treatment of friction factors (same? ) • Treatment of terminal times (logic? ) • Treatment of K factors • Comparison with JTW trip length • Comparison with JTW sector interchange volumes or percentages.

st 1 n o i at r e it Ca fr libr fa ictio ate ct or n s

Calibrating a Gravity Model Adjusting Friction Factors Travel Times Ranges from Skims Observed Trip Expanded from Surveys Input Friction Factors Gravity Model Trips Adjustment Factor Observed Gravity Model New Friction Factors Friction Adjustment Factor x Friction Factor 2. 5 7, 100 30. 0 8, 200 0. 87 25. 98 5. 0 14, 950 2. 50 16, 300 0. 92 2. 29 7. 5 17, 850 1. 80 19, 250 0. 93 1. 67 10. 0 16, 000 1. 50 19, 100 0. 84 1. 26 12. 5 15, 500 1. 20 17, 100 0. 91 1. 09 15. 0 15, 900 12, 300 1. 29 17. 5 16, 400 0. 95 18, 000 0. 91 0. 87 20. 0 15, 150 0. 90 14, 300 1. 06 0. 95 22. 5 13, 500 0. 85 11, 900 1. 13 0. 96 25. 0 11, 000 0. 80 9, 250 1. 19 0. 95 27. 5 9, 500 0. 75 8, 100 1. 17 0. 88 30. 0 9, 100 0. 70 6, 100 1. 49 1. 04 32. 5 5, 700 0. 65 4, 900 1. 16 0. 76 … … …

nd 2 r e it n o i at

Trip Distribution Calibration and Validation • Check modeled vs. household survey TLFD and mean trip lengths • Get HBW area-to-area flows from JTW HBW 1990 JTW TLFD and Area-to-Area Flows for Kansas City Commute Length in Minutes Percent < 15 27. 87 Central-Central County 31. 49 15 -29 41. 63 Central-Suburban County 7. 48 30 -39 17. 04 Suburban-Central County 15. 13 40 -59 7. 70 Within Suburban County 32. 98 >60 3. 00 To Other Suburban County 10. 81 Work out of area 2. 11 Mean 21. 44 Journey-to-Work Flows Percent

Mode Split Reasonableness Checks • Automobile occupancy factors by trip purpose used? • Basis? • Constant? • Mode split model? • Form? • Variables included in the utility functions? • Coefficients logical? • Value of time assumptions • Parking cost assumptions • How do mode shares change over time? • Mode share comparisons with other cities

Mode Split Calibration and Validation • Experienced planning consultant required … – – – Form of LOGIT model Variables included in utility functions Calibration of coefficients for utility function variables Testing for IIA properties Analysis of household survey data Analysis of on-board transit survey data • Calibration tasks we can do: • Compare highway and transit trips • Total • By purpose • Compare Ridership by route • CBD cordon line survey (if bus service is downtown only)

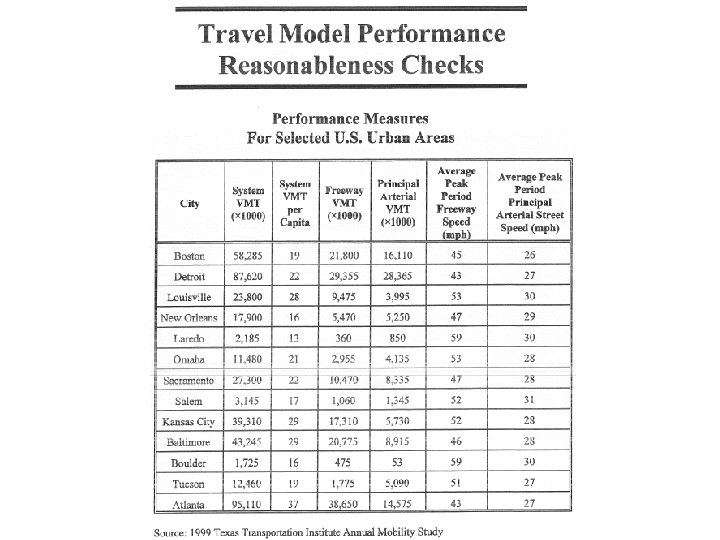
Trip Assignment Reasonableness Checks • All-or-nothing assignment • study effect of increasing capacity • Compare to Equilibrium assignment • Check volume delay equation (BPR parameters) • Compare • screen line volumes • Cut line volumes • Time-of-day assignments? • Source of factors • Peak spreading used for future? • If not, conversion factors source? (peak hour to 24 -hour) • Local VMT (% assigned to intrazonals and centroid connectors l Equi m ibriu r lo g Al hin t No

Trip Assignment Calibration and Validation As ca signm l pe ibra ent rfo tio rm n ed las t Overall VMT or VHT check • 40 to 60 miles per day per HH in large metro areas • 30 to 40 miles per day per HH in medium metro • +/- 10% OK on screen lines • Sign is important

Compute by … - volume group - facility type - transit assignments - time of day
 • Can be implied in")
Other Factors Impacting Forecasted Travel Demand (use your noodle) • Can be implied in travel surveys (but not explicit) – Telecommuting – Flexible work hours – HB business • How to account for … – – Aging population Internet shopping Roadway congestion (will it affect generation in the future) New modes
- Slides: 34