Sequence of Accounts Balancing Item CURRENT ACCOUNTS I


Sequence of Accounts Balancing Item CURRENT ACCOUNTS I Production Account Value Added/GDP Счет производства СДО/ВВП II Income Accounts Distribution and Use of Income Accounts Generation of Income Account Operating Surplus and Mixed Income Allocation of Primary Income Account Balance of Primary Incomes National Income Secondary Distribution of Income Account Disposable Income/ National Disposable Income Redistribution of income in kind Account Adjusted Disposable Income Use of Disposable Income Account Saving Use of Adjusted Disposable Income Account Saving

Sequence of Accounts III ACCUMULATION ACCOUNTS Capital Account Financial Account Other Changes in Volume of Assets Account Revaluation Account Balancing Item Net Lending/Net Borrowing Changes in Net Worth due to Other Changes in Assets Changes in Net Worth due to Nominal Holding Gains or Losses IV BALANCE SHEETS In addition: 0 The Goods and Services Account The Rest of the World Account July 27, 2009 PFTAC NAS/L-3: 6

• Goods and Services Account Resource s Output: 45891. 3 Imports of goods and services 5679. 1 Taxes on products 4069. 4 less subsidies 156. 1 on products Total supply 55483. 7 Use s Intermediate consumption 23023. 5 Final consumption expenditure 17742. 6 Gross savings 4795. 6+620. 2 Exports of goods and services 9069. 1 Statistical discrepancy 232. 7 Total use 55483. 7

The Production Account Uses Resources Intermediate consumption 23023. 5 Output 45891. 3 Market output Output for own final use Other non-market output Taxes 4069. 4 less subsidies 156. 1 on products Gross domestic product 26781. 1 Consumption of fixed capital Net domestic product

Generation Of Income Account Uses Resources Compensation of employees 11816. 1 Gross domestic product 26781. 1 Taxes 5521. 1 less subsidies 163. 0 on production and imports Operating Surplus/Mixed Income Total 9606. 9 26781. 1 Total 26781. 1

Generation Of Income Account The balancing item is Operating Surplus/Mixed Income ·Operating Surplus – income obtained from the unit's own use of production facilities ·Mixed Income – unincorporated enterprises of the household sector (contains an element corresponding to remuneration for work carried out by the owner) ·However, own account production services by owneroccupied households – Operating Surplus because there is no labor input July 27, 2009 PFTAC NAS/L-3: 11

Generation Of Income Account The balancing item is Operating Surplus/Mixed Income ·Operating Surplus – income obtained from the unit's own use of production facilities ·Mixed Income – unincorporated enterprises of the household sector (contains an element corresponding to remuneration for work carried out by the owner) ·However, own account production services by owneroccupied households – Operating Surplus because there is no labor input July 27, 2009 PFTAC NAS/L-3: 11

Allocation of Primary Income Account Uses Resources Property income paid to nonresidents 1326. 1 Operating Surplus/Mixed Income 9606. 9 Compensation of employees 11816. 1 -118. 7 Taxes 5521. 1 less subsidies 163. 0 on production and imports Property income received from nonresidents 673. 4 Gross National Income Total 26009. 7 27335. 8 Total 27335. 8

Allocation of Primary Income Account · Concerns the resident units/ institutional sectors as recipients rather than producers · It can be calculated only for institutional sectors not for activities · Primary income – the income which resident units receive by virtue of their direct participation in the production process July 27, 2009 PFTAC NAS/L-3: 12

Primary Distribution Of Income Account GDP minus Compensation of employees paid to nonresident employees plus Compensation of employees received from nonresident producers minus Property income paid to nonresidents plus Property income received from nonresidents = Gross National Income GNI

Secondary Distribution Of Income Account Uses Current transfers to nonresidents Resources 214. 5 Gross National Income 26009. 7 Current transfers from abroad 1 79. 4 Gross National Disposable Income Total 25974. 6 26189. 1 Total 26189. 1

Secondary Distribution Of Income Account · Shows how balance of primary income is allocated by redistribution- current taxes on income, social contributions and benefits, other current transfers · Balancing item – disposable income (excludes capital transfers, real holding gains/losses) July 27, 2009 PFTAC NAS/L-3: 14
")
Secondary Distribution of Income Account GNI plus Taxes on income and wealth (net, receivable) from abroad plus Social contributions and benefits and other current transfers (net, receivable) from = abroad Gross National Disposable Income GNDI · · Note recording of social contributions: on the Uses side of households on the Resources side of government, financial, and NPISH sectors July 27, 2009 PFTAC NAS/L-3: 15

Redistribution of Income in Kind Account · Includes the social transfers in kind · Social transfers in kind are recorded as Resources for Households and as Uses for GG and NPISHs · By convention, there are no social transfers in kind with the ROW · The Balancing item is Adjusted Disposable Income (equal to Disposable Income for the total economy) July 27, 2009 PFTAC NAS/L-3: 16

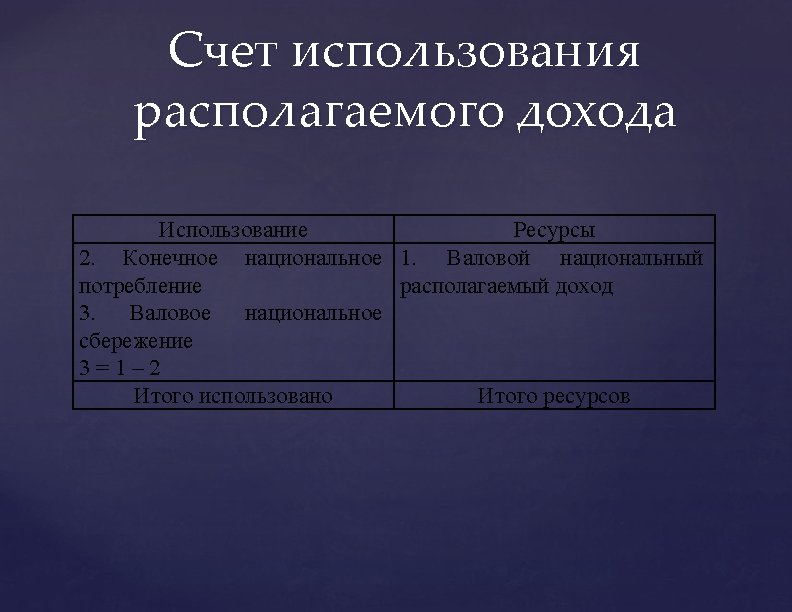
Use of Income Account · Shows how disposable income is divided between final consumption and savings · Only GG, NPISH and Households have Final Consumption · Saving is the balancing item for both versions of the Use of Income Account · Saving can be positive or negative July 27, 2009 PFTAC NAS/L-3: 17

Use of Income Account Uses Resources Final consumption 17742. 6 Gross National Disposable Income 25974. 6 Gross National Savings 8232. 0 Total 25974. 6

Use of Income Account GNDI less = July 27, 2009 Final Consumption Expenditure Saving, gross PFTAC NAS/L-3: 18

Accumulation Accounts · The Production and Income Accounts are the current accounts of the system and record transactions in income and expenses. · The Capital, Financial, and Other Changes In Assets Accounts are the accumulation accounts of the system and record flows in assets and liabilities July 27, 2009 PFTAC NAS/L-3: 19

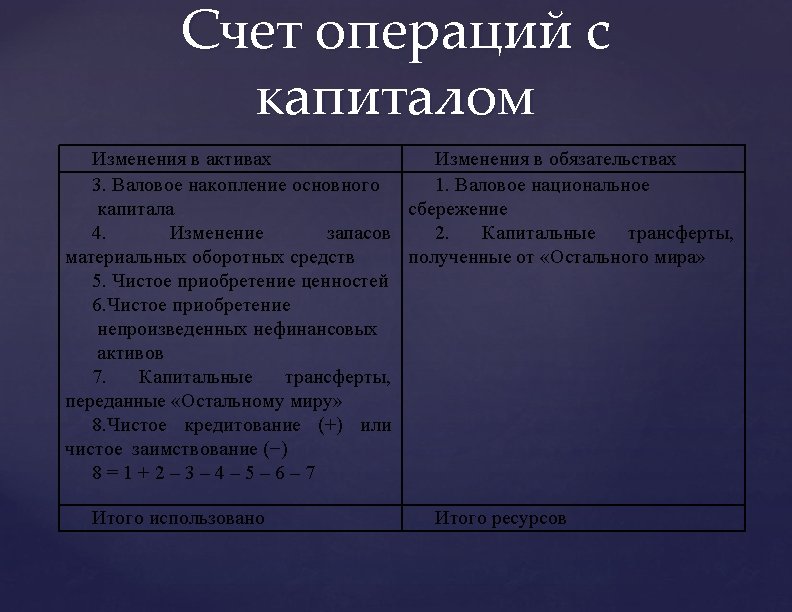
Capital Account Records acquisitions and disposals of non-financial assets as a result of transactions with other units or internal bookkeeping transactions linked to production (own account capital formation, changes in inventories and consumption of fixed capital) Shows how saving is used to finance capital formation. If capital formation exceeds saving then funds need to be borrowed (or financial assets used), whereas the converse provides funds for net lending. July 27, 2009 PFTAC NAS/L-3: 20

The Capital Account Changes in assets Gross fixed capital formation 17742. 6 Net acquisition of nonproduced non-financial assets 620. 2 Changes in liabilities and net worth Gross National Savings 8232. 0 Capital transfers from the rest of the world (+) 19. 9 Capital transfers to the rest of the world (-) 17. 6 Net lending (+)/borrowing (-) 2818. 5 Total 8234. 3
 minus Gross capital formation (gross")
Capital Account Saving, gross plus Capital transfers (net, receivable) minus Gross capital formation (gross fixed capital formation + changes in inventories + net acquisition of valuables) plus Net acquisition of non-produced nonfinancial assets = Net lending (+)/borrowing (-) July 27, 2009 PFTAC NAS/L-3: 21

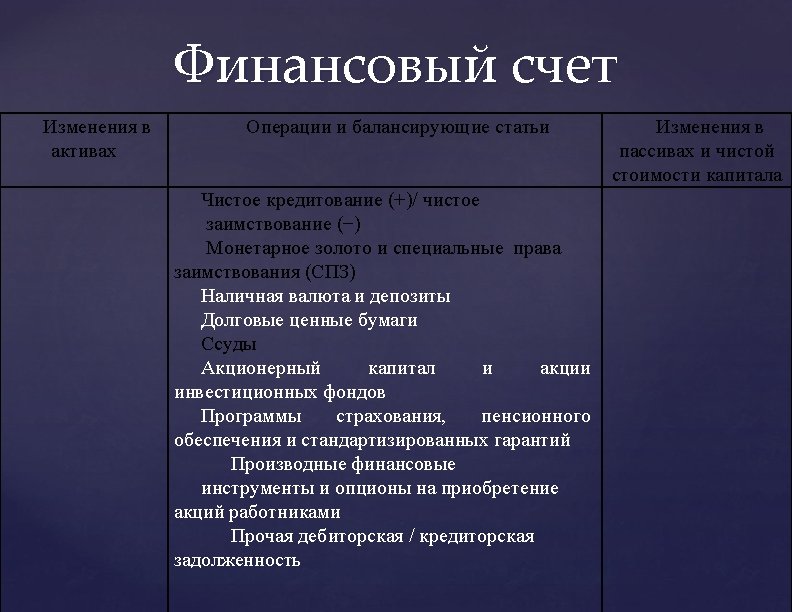
The Financial Account Changes in assets Net acquisition of financial liabilities Monetary gold and SDRs Currency and deposits Debt securities Loans Equity and investment fund shares Insurance, pension and standardized guarantee schemes Financial derivatives and employee stock options Other accounts receivable/payable Changes in liabilities and net worth Net lending (+) / net borrowing (–) Net acquisition of financial liabilities Monetary gold and SDRs Currency and deposits Debt securities Loans Equity and investment fund shares Insurance, pension and standardized guarantee schemes Financial derivatives and employee stock options Other accounts receivable/payable

Financial Account Records the acquisition and disposal of financial assets and liabilities, and shows how net lending from the capital account is reflected in transactions in these financial instruments. Net lending/borrowing = net acquisition of financial assets minus net incurrence of liabilities July 27, 2009 PFTAC NAS/L-3: 29

Other Changes in Assets Accounts · These two accounts provide information on changes in the value of assets and liabilities as a result of factors other than transactions. · Other Changes in Volume of Assets Account: Records volume changes such as destruction of fixed assets by natural disasters. · Revaluation Account: Records revaluations due to price changes (including exchange rates) July 27, 2009 PFTAC NAS/L-3: 30

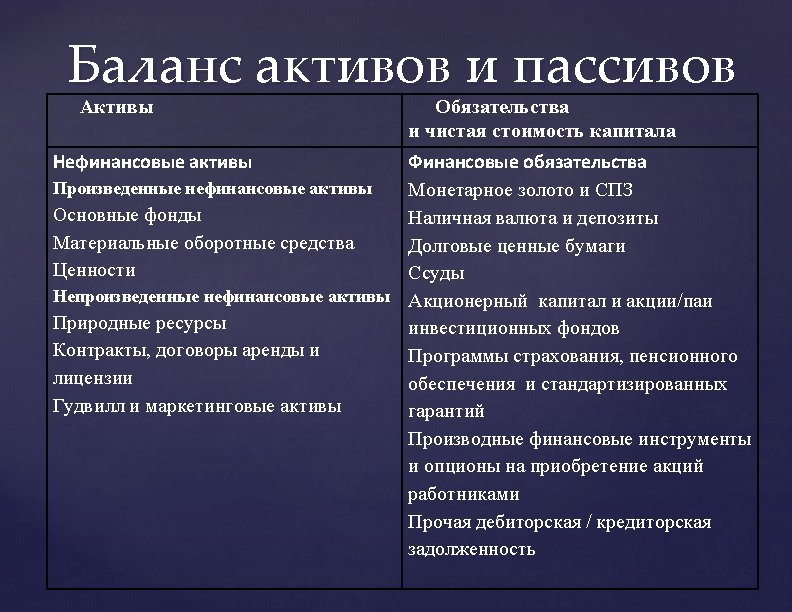
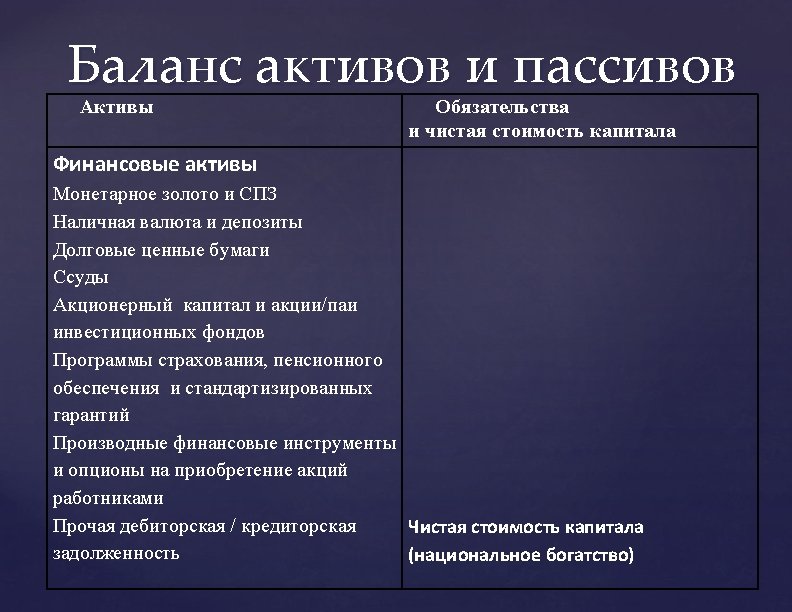
Balance Sheets Show the market value of the stock of assets and liabilities at the beginning and end of an accounting period The difference between the values in opening and closing balance sheets is accounted for by the accumulation accounts, either as transactions or as other changes July 27, 2009 PFTAC NAS/L-3: 31

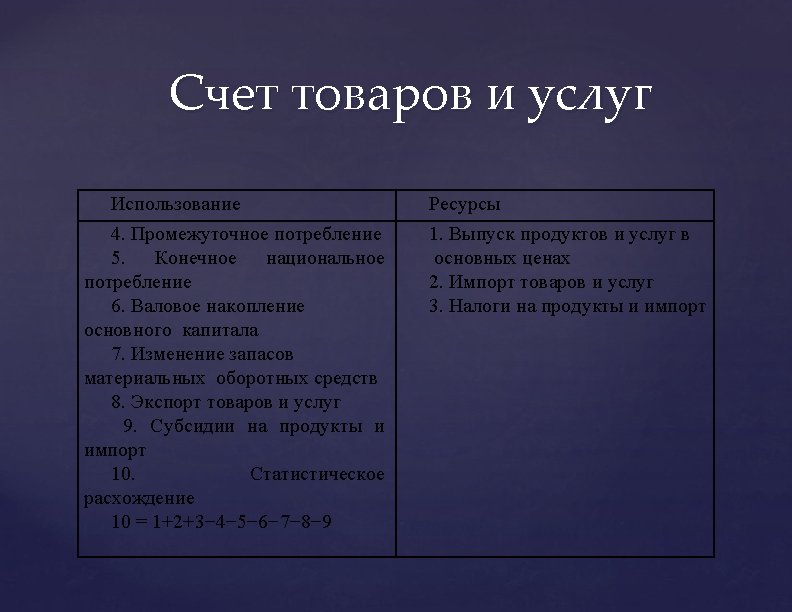
Goods and Services Account Total supply of goods and services = Total use of the same goods and services M + DP + TP = IC + FC + CF + X July 27, 2009 PFTAC NAS/L-3: 33

Goods and Services Account Resources Uses Output Intermediate consumption Imports of goods and services HH and NPISHs consumption expenditure Taxes less subsidies on products GG consumption Gross fixed capital formation Changes in inventories Acquisitions less deposals of valuables Exports of goods and services July 27, 2009 PFTAC NAS/L-3: 34

Rest of the World Account · Records transactions between resident and non resident units · Same presentation as an institutional sector account - current accounts, accumulation accounts, balance sheets · Accounts are drawn up from the point of the rest of the world · ROW does not constitute an institutional sector, but plays a similar role July 27, 2009 PFTAC NAS/L-3: 35

Integrated Economic Accounts · Bring into one table the accounts of all institutional sectors, the total economy, and the ROW · Uses, assets, changes in assets are recorded on the left side · Resources, liabilities, and changes in liabilities and net worth are recorded on the right side · Columns – institutional sectors, total economy, ROW · Rows – transactions, assets, liabilities, balancing items, and aggregates July 27, 2009 PFTAC NAS/L-3: 36

Macroeconomic Indicators Gross Domestic Product calculated by Production method: GDP=Output in basic prices + Inputs on products and imports – Subsidies on products and imports – Intermediate Consumption = 45891. 3 + (4069. 4 – 156. 1) – 23023. 5 = 26781. 1

Macroeconomic Indicators Operating Surplus/Mixed Income = Gross Domestic Product calculated by Production method - Compensation of employees paid by residents - Inputs on products and imports + Subsidies on products and imports = 26781. 1 – 11816. 1 – (5521. 1 – 163. 0) = 9606. 9

Macroeconomic Indicators Gross Domestic Product calculated by Distribution method: GDP= Operating Surplus/Mixed Income + Compensation of employees paid by residents + Inputs on products and imports – Subsidies on products and imports = 9606. 9 + 11816. 1 + (5521. 1 – 163. 0) = 26781. 1

Macroeconomic Indicators Gross Domestic Product calculated by Final Consumption method: GDP= Final Consumption + Gross Savings + Exports – Imports = 17742. 6 + 4795. 6 + 620. 2 + 9069. 1 – 5679. 1 = 26548. 4

Macroeconomic Indicators Statistical discrepancy is the difference between the GDP calculated by Production method and GDP calculated by Final Consumption method: 26781. 1 – 26548. 4 = 232. 7

Macroeconomic Indicators Gross National Income: GDP + Net Compensation of Employees by non-residents for the employment of residents and by residents for the employment of non-residents + Net property income: 26781. 1 – 118. 7+ 673. 4 – 1326. 1 = 26009. 7

Macroeconomic Indicators Gross National Disposable Income: GNDI = GNI + Current Transfers received by residents from the Rest of the World – Current Transfers paid by residents to the Rest of the World: GNDI = 26009. 7 + 179. 4 – 214. 5 = 25974. 6

Macroeconomic Indicators Gross National Savings: GNS = GNDI – Final Consumption: GNS = 25974. 6 – 17742. 6 = 8232. 0
 GS")
Macroeconomic Indicators Gross Savings: Gross Fixed Capital Formation + Increase in Stocks (Inventories) GS = 4795. 6 + 620. 2 = 5415. 8

Macroeconomic Indicators Net lending/borrowing: Gross National Savings + Net capital transfers – Gross Savings: GNS = 8232. 0 + 19. 9 – 17. 6 – 4795. 6 – 620. 2 = 2818. 5

2. The Production Account and its links to The Goods and Services Account

Concept of Production • • Production is: an activity in which an enterprise uses inputs to produce outputs a “physical” process, carried out under the responsibility, control and management of an institutional unit • • labor and assets are used to transform inputs of goods and services into outputs of other goods and services does NOT cover purely natural processes without any human involvement or direction. Production account describes this transformation and the additional value created through the production process
 Example Basic Data Producer 1. A farmer Output: Wheat Input:")
Description of Production a) Example Basic Data Producer 1. A farmer Output: Wheat Input: Value added 1, 000 Imported seed 600 400 Producer 2. A baker Output: Bread Input: Wheat Value added 1, 800 1, 000 800

Example continued: Production Accounts The Farmer Uses Intermediate consumption Gross value added Output 600 Resources 1, 000 400 The Baker Uses Intermediate consumption Gross value added Resources 1, 000 800 Output 1, 800 The total economy Uses Intermediate consumption Gross value added Resources 1, 600 1, 200 Output 2, 800

Example continued: Goods and Services Account Resources Uses Output Wheat Bread Intermediate consumption Seed 600 Wheat 1, 000 1, 800 Imports of goods and services Seed 600 Household consumption expenditure Bread 1, 000 Export of goods and services Bread 800 Total supply 3, 400 Total use 3, 400

Or Resources Uses Household consumption expenditure 1, 000 Value added/GDP Farmer 400 Baker 800 Exports - Imports Total supply 1, 200 Total use 800 600 1, 200
 SNA Presentation Production Account For Industries and Institutional Sectors Uses Resources Intermediate")
(b) SNA Presentation Production Account For Industries and Institutional Sectors Uses Resources Intermediate consumption Output Market output Output for own final use Other non-market output Gross value added Consumption of fixed capital Net value added

For the Total Economy Uses Resources Intermediate consumption Output Market output Output for own final use Other non-market output Taxes less subsidies on products Gross domestic product Consumption of fixed capital Net domestic product

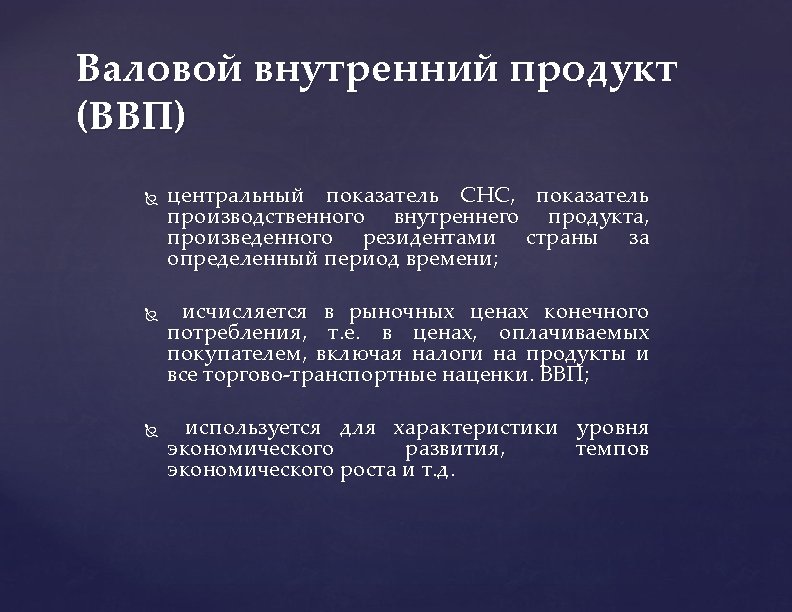
Gross Domestic Product A nation’s economic activity is usually measured with Gross Domestic Product GDP at market prices. GDP is the best known and most widely used final product of national accounts. The concept of GDP is a flow measure that denotes the value of the goods and services produced during a period as a result of the production activity of resident producer units. GDP includes in its production boundary goods and services that have markets (or which could have markets) and products which are produced by general government and non-profit institutions

Net Domestic Product Nonetheless, GDP does not take into account the decrease in the value of fixed assets (e. g. computers, buildings, transport equipment, machinery, etc. ) used in the production process. From this perspective, a better measure of production is Net Domestic Product NDP at market prices that deduces the consumption of fixed capital from GDP, especially since there has been recent evidence that GDP and NDP have been diverging due to a changing composition of the capital stocks into more short lived high-technology ICT capital goods that depreciate more rapidly

Net Domestic Product. However, as consumption of fixed capital is one of the most difficult national accounts concepts to measure the gross concept is for pragmatic reasons usually used. Due to this fact, for example NDP for EU 27 is not yet available

Goods and Services Account Resources Uses Output Market output Output for own final use Other non-market output Imports of goods and services Intermediate consumption Households’ final consumption expenditure General government’s final consumption expenditure NPISHs’ final consumption expenditure Fixed capital formation Changes in inventories Acquisition less disposal of valuables Exports of goods and services Taxes less subsidies on products Total supply Total use

Abbreviation: NPISH - Non-profit institution serving households

3. Production Boundaries · What constitutes production? , and what generates value? · SNA and the environment · Pollution, depletion · GDP a welfare measure? · What generates value? · SNA vs. NPS “non-productive services” · Legal versus illegal activities

3. Production Boundaries · Restrictive approach Core concept: monetary transactions · Broadest approach All factors or activities that affect the quality of life · Production boundary problems: · Household services · Non-market output Nature · Production versus other flows

Production Boundary in the SNA Includes: · · Production of all goods whether produced for the market or for own-use or consumption Production of services if Sold on the market Supplied to units other than producers Produced by paid labor · Production of own-account housing services BUT Excludes various housework, social activities, cultural activities, and voluntary services

Production also includes: · · · · · Types of goods or services that are not paid for separately in the market at economically significant prices Government services and output of other nonprofit institutions Banking services not explicitly charged for Services of pension funds Services by life and casualty insurance companies Own account production of capital goods (including research & development in 2008 SNA) * Other goods (but not services) for own final consumption Imputed services of owner-occupied dwellings * Output used as payments in kind, e. g. as compensation of employees * - valuation should include return to capital – 2008 SNA Illegal and concealed production and the underground economy are included. Note: theft is not production

Household Activities included/ excluded in the Production Boundary Household activities included in the production boundary 1. Services provided by paid domestic staff 2. Housing services of owner-occupied dwellings 3. Major do-it-yourself repair and maintenance of durable goods used in production (fixed capital) and dwellings (own account capital formation) 4. Agricultural products, storage and processing 5. Other processing e. g. cloth, footwear 6. Production of salt, supply of water, etc 7. Illegal production activities 8. Concealed production activities Household activities excluded from the production boundary 1. Domestic services consumed by households and produced by themselves without paying domestic staff 2. Minor do-it-yourself repair and maintenance of durable goods and dwellings
 Production vs. Creation by Nature I. Natural Growth: Concept: Human involvement makes")
(a) Production vs. Creation by Nature I. Natural Growth: Concept: Human involvement makes it production Case studies (fish, forest) Natural growth or cultivated? II. Use of natural resources: Concept of depletion: using up a nonrenewable resource. Not an issue in SNA, but in satellite accounts and experimental work. Case studies (mineral deposits, fuel reserves)
 Resident Production vs. Non-Resident Production Concept: Residence follows the production unit’s center of")
(b) Resident Production vs. Non-Resident Production Concept: Residence follows the production unit’s center of economic interest (NOT the owner’s or employee’s) “NOT NECESSARILY the place where the production occurs” GNP/GNI: A measure of the total primary income earned by domestically owned factors of production, i. e. , for GNP/GNI the residency of the owners of the means of production is important (GNP a 1953 SNA concept, not in the 1968 SNA)
 Production vs. Holding Gains Concept of Holding Gains: An increase in value that")
(c) Production vs. Holding Gains Concept of Holding Gains: An increase in value that does not arise from the production process. Problem: Businesses often not concerned with distinction (as both accrue to owners). Case studies (gains on inventories, gains on other assets, foreign exchange gains and losses)

Holding Gains: an Example · · · · A baker produces 5, 000 breads at 2. 00 a piece. Total output is 10, 000 His sole intermediate use is flour. Of this he uses also 5, 000 units, all from inventories. At the time these inventories were purchased, the price per unit was: 0. 90 Now the price per unit is: 1. 00 Intermediate consumption at replacement costs 5, 000 * 1. 00 = 5, 000 Value added 10, 000 - 5, 000 = 5, 000 Intermediate consumption at historic prices 5, 000 * 0. 90 = 4, 500 Value added 10, 000 - 4, 500 = 5, 500 Difference 500 · Holding gains on inventories · · 5, 000 * (1. 00 -0. 90) = 500
 Production vs. Property Income Concept of property income: incomes received by the owner")
(d) Production vs. Property Income Concept of property income: incomes received by the owner of a financial or a tangible non-produced asset for providing funds or putting the tangible non-produced asset at the disposal of another institutional unit Case studies (land rent, building rent, dividends, interest, fishing rights, royalties)

4. Producers and Types of Output · Institutional units and establishments Production account is compiled for both establishments (industries; as in 1968 SNA) and institutional units (sectors; new in the 1993 SNA). Numerical consistency of production accounts for industries and sectors · Three types of output: Market output Output for own final use Other non-market output .
 Measurement of Output of Market Products Market output consists of : 1. Total")
a) Measurement of Output of Market Products Market output consists of : 1. Total value of goods and services sold (at economically significant prices) or otherwise disposed of on the market 2. Total value of goods and services bartered 3. Total value of goods and services used for payment in kind, including compensation in kind
 Measurement of Output of Market Products 4. Total value of goods and services")
a) Measurement of Output of Market Products 4. Total value of goods and services supplied by one establishment to another belonging to the same market enterprise to be used as intermediate inputs 5. Total current value of products produced and added to the inventories of finished goods and work-inprogress intended for one or the other of the above uses
 Measurement of Output for Own Final Use Consists of: ·Production of capital goods")
(c) Measurement of Output for Own Final Use Consists of: ·Production of capital goods for own gross fixed capital formation ·Production by households of consumer products e. g. : - Agricultural products - Housing services produced by owner-occupiers - Domestic services produced by employing paid staff Valuation: Preferably: at the market prices of similar products Alternatively: as the sum of production costs (including a markup for normal profits, except when produced by government or NPISHs)
 Measurement of Output of Other Non-Market Products · Residually, as value of total")
(c) Measurement of Output of Other Non-Market Products · Residually, as value of total output by the non-market establishment less the value of any secondary market output. · Total output by a non-market establishment is equal to the sum of production costs: · Intermediate consumption · Compensation of employees · Consumption of fixed capital · Other taxes on production

Output of Particular Industries · Agriculture, forestry and fishing · Machinery, equipment and construction · Transportation and storage · Wholesale and retail · Operating leasing · Central banks · Financial intermediation services indirectly measured · Insurance · Research and development · Production of originals and copies

Output of Particular Industries - 2 · Wholesale and Retail Distribution · Output is measured as the margin on goods purchased for resale · Sales less cost of goods sold COGS · COGS = purchases less increase in trading goods inventories · Should exclude holding gains on inventories

5. What is Intermediate Consumption, and how to Measure and Value it ? Definition, time of recording, and valuation. · Includes · Rentals paid on use of fixed assets, · Goods and services supplied by other establishments of same • · · · · enterprise, Goods and services used as inputs into the ancillary activity. Excludes Value of consumption of fixed capital used Goods and services produced and used as inputs within same establishment Expenditures on valuables Bad debt provisions/write-offs, taxes, fines, donations, dividends, amortization of goodwill, exchange rate losses, land rent, loss on sale of assets, interest (other than allocated FISIM) Boundary issues

Boundary between Intermediate Consumption and Compensation of Employees Intermediate consumption Compensation of employees Employees are obliged to use goods Goods and services are used by and services in order to enable them employees in their own time and at their carry out work own discretion 1. 2. 5. 6. Tools or equipment used at work Specialized clothing used mainly at work Accommodation services at the place of work 1. Durable goods used extensively away from work Uniforms which employees choose to wear extensively away from work Transportation and hotel services provided for business 3. Ordinary housing services provided to employees and their dependents. Medical facilities provided because of the nature of work Meals or drinks provided to workers on active duty 4. Services of vehicles used away from work and transportation allowances Ordinary medical facilities provided to employees and their dependents 5.

Boundary between Intermediate Consumption and Gross Fixed Capital Formation Intermediate consumption 1. 2. 3. Recurrent expenditure on small durable producer goods, like hand tools, that are a small share of total expenditure on machinery and equipment Regular maintenance, repair of fixed assets and replacement of parts that is required to keep fixed assets in working order Research and development, staff training, market research are recorded as intermediate inputs though they may bring future benefits Weapons of destruction Weapons, armored vehicles, etc. to be used primarily to wage war Gross fixed capital formation 3. 4. 5. Expenditure on hand tools if it is large compared to total expenditure on machinery and equipment Major renovation that is not dictated by the condition of the asset and enhances the efficiency or capacity of fixed assets Mineral exploration, computer software Expenditure on items that provide defense services, i. e. buildings, roads, airfields Weapons, armored vehicles, etc. used for providing security services

6. Consumption of Fixed Capital · Is a cost of production · Can be measured as decline in the current value of the stock of fixed assets as a result of physical deterioration, normal obsolescence or normal accidental damage · Is valued using actual or estimated prices of fixed assets prevailing at the time the production takes place, not the prices at the time the fixed asset was originally acquired · May be calculated as by-product of Production and Inventory Management PIM
 · Gross and net recording of aggregates ·")
Consumption of Fixed Capital (contd. ) · Gross and net recording of aggregates · Consumption of fixed capital should be included in the valuation of non-market output · Coverage of CFC consistent with GFCF · · · “Normal” fixed assets, plus Military assets – new in 2008 SNA Research & Development – new in 2008 SNA Mineral Exploration & Evaluation Cost of ownership transfer Excludes depletion of natural assets

Consumption of Fixed Capital in Practice · Business accounts – depreciation. Historic cost? Based on tax allowances (= >bias from investment incentives? )? · Government accounts – balance sheets? · Perpetual Inventory Method · Recommended approach · Very complex and data hungry · Requires very long time series of GFCF and price indexes · Requires detailed knowledge of asset lives and changes in asset efficiency over time

Gross and Net Domestic Product Valuation of Goods and Services · · Domestic Product can be “gross” or “net” Gross, GDP, is before deducting CFC Net, NDP, is after deducting CFC is difficult to estimate, so most countries compile GDP · If Net DP is compiled, the balancing items in the sequence of accounts are “net” rather than gross (operating surplus/mixed income, disposable income, etc. )

Valuation of Goods and Services · Basic price: is the amount receivable by the producer from the purchaser for a unit of a good or service produced less any tax payable, plus any subsidy receivable · Producer's price (net of all Value Added Taxes VAT): is the amount receivable by the producer from the purchaser for a unit of a good or service produced less any VAT invoiced to the purchaser. · Purchaser's price (net of deductible VAT): is the amount paid by the purchaser, excluding any deductible VAT (or similar deductible tax). ________ Producer and basic prices are actual transaction prices. They are all market prices. Basic prices are preferred for output valuation
 less subsidies on products")
Relationship between Prices Basic prices Plus: Taxes (other than VAT) less subsidies on products payable/receivable by their producers Equals Producer's prices (net of all VAT) Plus: Gross trade and transport margins (including taxes other than invoiced VAT on product payable/receivable by wholesalers and retailers) Plus: Non-deductible VAT Equals Purchaser's prices (excluding deductible VAT) Gross trade and transport margins Less: taxes (other than invoiced VAT) on product payable/ receivable by wholesalers and retailers Equals Net trade and transport margins (or trade and transport margins at basic prices)

Example 1 Valuation of Goods and Services 10 percent excise tax levied on production of bread Tax Bakery => 1000 => 100 => Retail store => 2000 => Households Output of bread at basic prices + taxes less subsidies on products = Output of bread at producers’ prices + Trade margin = Purchasers’ prices 1, 00 0 100 1, 10 0 2, 000 900

Production Accounts The Farmer Uses Resources Intermediate consumption 600 Output 1, 000 Gross value added 400 The Baker Uses Intermediate consumption Gross value added Resources 1, 000 Output 800 1, 800

The Retail Store Uses Resources Intermediate consumption Gross value added 0 Output 900 The Total Economy Uses Intermediate consumption Resources 1, 600 Output 3, 700 Taxes on products Gross domestic product 2, 200 100

• Goods and Services Account Resource s Output: Wheat 1, 000 Bread 1, 800 Trade 900 Imports of goods and services Seed Taxes on products Total supply Use s Intermediate consumption Seed 600 Wheat 1, 000 Trade 0 600 100 4, 400 Household consumption expenditure Bread 2, 000 Exports of goods and services Bread 800 Total use 4, 400

• Goods and Services Account Resources Uses Household consumption expenditure 2, 000 Value added Farmer Value added Baker Value added Store 400 800 900 Taxes on products 100 Total supply/GDP 2, 200 Exports 800 - Imports 600 Total use 2, 200

Valuation of Goods and Services Example 2 No VAT 5 percent sales tax on bread Tax Bakery => 1, 000 => Retail store 1, 900 => 95 => 1, 995 => Households

Output of bread at basic prices = Output of bread at producer's prices 1, 000 + Trade margins, gross 995 = Trade margins net + taxes less subsidies on products = Purchaser's prices 900 95 1, 995

Example 3 20 percent Value Added Tax VAT Bakery=>1, 000 + 200=> Retail 1, 900 + 380 = 2, 280 =>Housestore holds Passing over of VAT to the government The bakery 200 The retail store 380 - 200 = Total VAT accrued on bread: 180 380

Output of bread at basic prices + taxes less subsidies on products = Output of bread at producer's prices excl. VAT 1, 000 0 1, 000 + Trade margin 900 + Non-deductible VAT 380 = Purchaser's prices 2, 280

7. Summary: Definition and Measurement of Value Added and Associated Aggregates Value added · Is the balancing item in production account (difference between the value of outputs and the value of intermediate inputs) · Measures the increased or newly created value by production process · Can be measured gross GVA or net of consumption of fixed capital NVA; gross concept is preferred. · Aggregates associated with Value added: · Value added at basic prices · Value added at producers' prices · Gross domestic product GDP · Value added at factor cost

Gross Domestic Product GDP · Represents the final result of the production activity of all resident producer/institutional units. · Commonly looked upon as an aggregated or net output concept. · But basically a value added concept. · Three Approaches to measuring GDP: Expenditure, Production, Income · Defined from the expenditures side as total final expenditures at purchasers’ prices less total imports valued at f. o. b. · Equal to total final use of domestically produced goods and services less inputs of imported goods and services. · An income concept. Total gross income generated in the domestic economy by resident producer/institutional units Net Domestic Product NDP GDP less consumption of fixed capital. An income concept

Approaches to Measuring GDP Three methods of measuring GDP: · GDP= O –IC + TPs · GDP= FC+ CI + GFCF + (E –I) · GDP = CE + OS/MI + TPn+ CFC Different in respect of quality estimates and types of analysis. In various instances the sources for the three methods coincide

Gross Value Added GVA at basic prices plus: Taxes less subsidies on products equals Gross Domestic Product GDP income less: Compensation of employees and property paid to non-residents plus Compensation of employees and property income received from non-residents equals Gross National Income GNI (formerly called GNP) Gross national product GNP and GNI are INCOME, not production
- Slides: 147