Sequence Diagrams A sequence diagram that duplicates most


 the")


 screen.")


- Slides: 18
Sequence Diagrams
�A sequence diagram that duplicates most of the semantics of the communication diagram shown. The advantage of using a sequence diagram is that it is easier to read the passing of messages in relative order. Sequence diagrams are often better than object diagrams for capturing the semantics of scenarios early in the development lifecycle, before the protocols of individual classes have been identified. Early sequence diagrams tend to focus on events as opposed to operations because events help to define the boundaries of a system under development. The advantage of using an object diagram is that it scales well to many objects with complex invocations. Each diagram has compelling benefits.
�A sequence diagram shows interactions between objects. Communication diagrams also show interactions between objects, but in a way that emphasizes links rather than sequence. Sequence diagrams are used during subsystem design, but they’re equally applicable to dynamic modeling during analysis, system design and even requirements capture. �A sequence diagram describes the sequence of operations during one scenario of a system use case and determines which object carries out each operation. The UML categorizes it as an interaction diagram—a diagram that highlights how objects interact with each other.
� Some business analysts use sequence diagrams as an alternative to activity diagrams with partitions (swimlanes). Instead of drawing one complex activity diagram to cover all scenarios, the BA draws one simple sequence diagram for each scenario. Each diagram is simple, since it describes only one scenario. The disadvantage of sequence diagrams for this purpose is that they require the BA to work out not only which object performs each action but also which object requests the action. This is often difficult to determine in a business context. In addition, BAs tend to have more difficulty using this diagram than its counterpart, the activity diagram with partitions. For these reasons, sequence diagrams are not advised for BA use. On the other hand, sequence diagrams are an excellent way to design the distribution of operations among classes for programming purposes.
� Using modeling tools (such as those in the Rational suite of products) the operations identified during the drawing of the sequence diagram can be automatically added to the classes involved, making the design process easier.
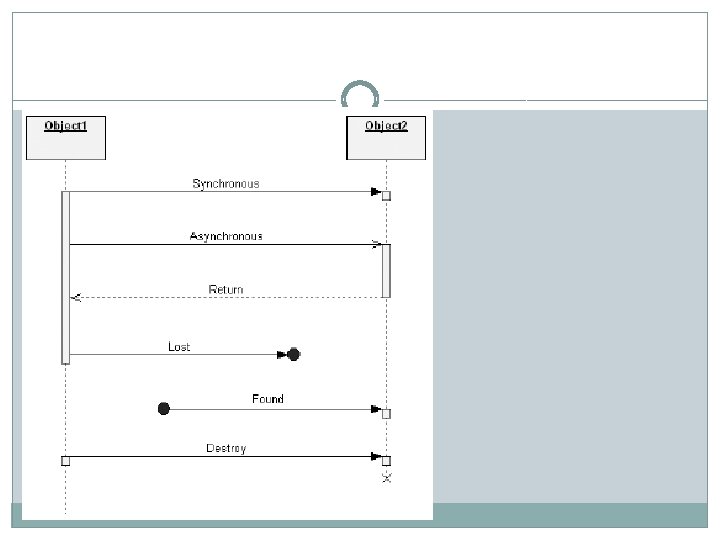
Essentials: Lifelines and Messages �In sequence diagrams, the entities of interest (which are the same as for object diagrams) are written horizontally across the top of the diagram. A dashed vertical line, called the lifeline, is drawn below each object. These indicate the existence of the object. �Messages (which may denote events or the invocation of operations) are shown horizontally. The endpoints of the message icons connect with the vertical lines that connect with the entities at the top of the diagram. Messages are drawn from the sender to the receiver. Ordering is indicated by vertical position, with the first message shown at the top of the diagram, and the last message shown at the bottom. As a result, sequence numbers aren’t needed.
Advanced Concepts: Destruction Events �A destruction event indicates when an object is destroyed. It is shown as an X at the end of a lifeline. If this object is involved in a composition, the other involved objects may also be destroyed. �Sequence diagrams are conceptually very simple; however, you can add other elements to make them more expressive in the presence of certain complicated patterns of interaction.
Advanced Concepts: Execution Specification � Simple sequence diagrams may not indicate the focus of control as messages are passed. For example, if object A sends messages X and Y to other objects, it may not be clear whether X and Y are independent messages from A or whether they have been invoked as part of the same enclosing message Z. to clarify such situations, we may adorn the vertical lines descending from each object in a sequence diagram with a box representing the relative time that the flow of control is focused in that object.
Advanced Concepts: Interaction Use � UML 2. 0 has various constructs available to simplify complex sequence diagrams. The first we will discuss is the interaction use. An interaction use is merely a way to indicate on a sequence diagram that we want to reuse an interaction that is defined elsewhere.
Advanced Concepts: Control Constructs � Just as we saw fragments being used to simplify sequence diagrams, they can similarly be used to indicate flow control constructs on sequence diagrams.
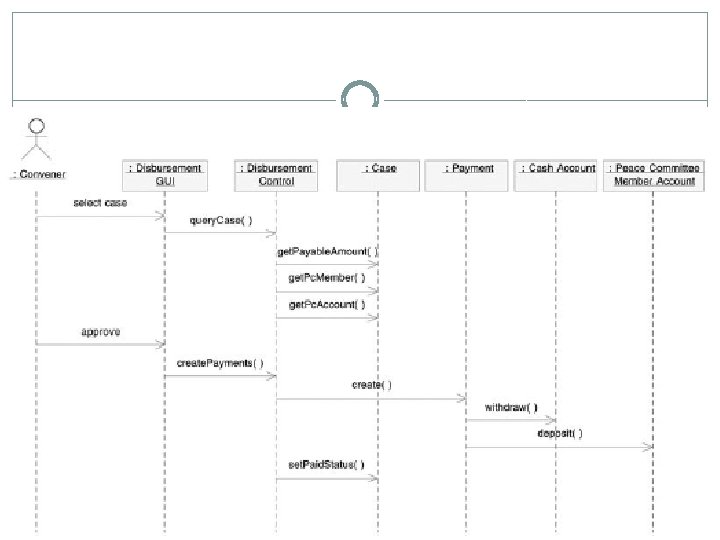
� The convener selects a case on the Disbursement GUI (graphical user interface) screen. � The Disbursement GUI sends the message Query. Case() to the Disbursement Control object, requesting it to query payment-related details about the case. � The Disbursement Control object services this request by passing a number of messages to the Case object. These include Get. Payment. Amount(), Get. Pc. Member(), and Get. Pc. Account(). These are requests to retrieve payment and Peace Committee member information relevant to the case. (To keep the diagram simple, only one Peace Committee member account is shown, though more are involved. ) � The convener approves the disbursement for the case. � The GUI responds to the approval by sending the message Create. Payments() to the Disbursement Control object. � The Disbursement Control object responds by sending a Create() message to each required Payment object. (The diagram only shows one of these. ) Though not shown on this draft of the diagram, payment details such as the destination and amount of the payment are passed at this time as arguments. � The Payment object sends a Withdraw() message to the cash account and a Deposit() message to the Peace Committee member account. � The Disbursement Control object finishes the process by sending the message Set. Paid. Status() to the Case object to indicate that payments have been made.
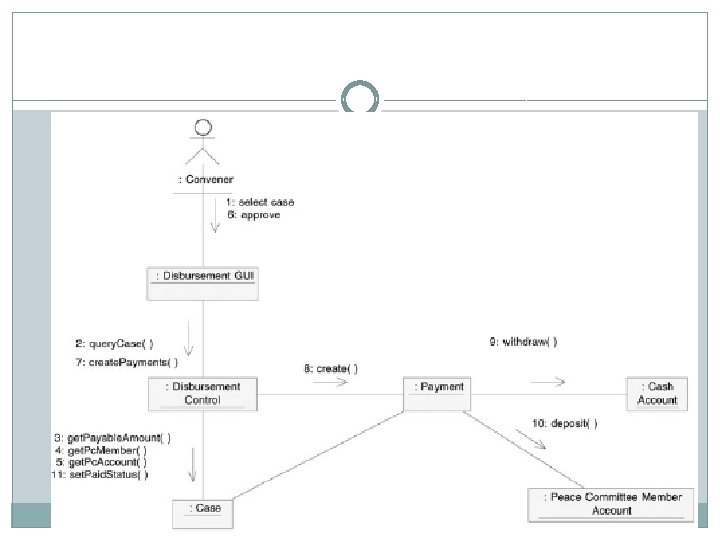
The Communications Diagrams �Like the sequence diagram, the communication diagram is categorized in the UML as an interaction diagram. Both diagrams can show the sequencing of operations for a scenario and indicate which object does which operation. However, each highlights a different aspect of the collaboration: The communication diagram highlights structure—the ways in which objects are linked to each other—while the sequence diagram highlights timing —the order in which messages are sent between objects. In a communication diagram, objects are connected by solid lines (links). The messages are indicated as labeled arrows above the links. Each message is numbered to indicate sequencing.
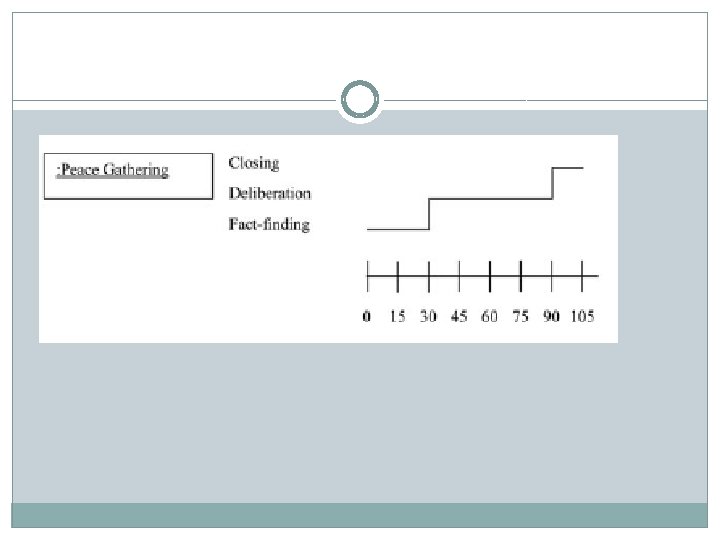
Timing diagrams �The timing diagram is a new UML 2 feature. It can be used to show the length of time that an object stays in each state. For example, suppose that rules dictated that a Peace Gathering had to spend 30 minutes in a factfinding state, 60 minutes in deliberation, and 15 minutes in closing. �“Timing Diagrams are used to show interactions when a primary purpose of the diagram is to reason about time. Timing diagrams focus on conditions changing within and among Lifelines along a linear time axis. Timing diagrams describe behavior of both individual classifiers and interactions of classifiers, focusing attention on time of occurrence of events causing changes in the modeled conditions of the Lifelines.