Sequence Comparison Intragenic self to self find internal


 GATC -")


![Scoring Alignments Ø Quality Score: Ø Quality = [10(match)]](https://slidetodoc.com/presentation_image_h/98562ec739deb8a2bb78074de99f152a/image-48.jpg "Scoring Alignments Ø Quality Score: Ø Quality = [10(match)]")
![Scoring Alignments Ø Quality Score: Ø Quality = [10(match)] + [-1(mismatch)]](https://slidetodoc.com/presentation_image_h/98562ec739deb8a2bb78074de99f152a/image-49.jpg "Scoring Alignments Ø Quality Score: Ø Quality = [10(match)] + [-1(mismatch)]")
![Scoring Alignments Ø Quality Score: Ø Quality = [10(match)] + [-1(mismatch)] [(Gap Creation Penalty)(#of](https://slidetodoc.com/presentation_image_h/98562ec739deb8a2bb78074de99f152a/image-50.jpg "Scoring Alignments Ø Quality Score: Ø Quality = [10(match)] + [-1(mismatch)] [(Gap Creation Penalty)(#of")
![Scoring Alignments Ø Quality Score: Ø Quality = [10(match)] + [-1(mismatch)] [(Gap Creation Penalty)(#of](https://slidetodoc.com/presentation_image_h/98562ec739deb8a2bb78074de99f152a/image-51.jpg "Scoring Alignments Ø Quality Score: Ø Quality = [10(match)] + [-1(mismatch)] [(Gap Creation Penalty)(#of")
 Ø Z = (Scorealignment - Average Scorerandom) Standard Deviationrandom")
.")


 value: value number of hits")
 and Local (Bestfit) tools will (almost) always give a match.")
 and Local (Bestfit) tools will (almost) always give a match.")
 and Local (Bestfit) tools will (almost) always give a match.")
 and Local (Bestfit) tools will (almost) always give a match.")
 and Local (Bestfit) tools will (almost) always give a match.")
- Slides: 68
Sequence Comparison Intragenic - self to self. -find internal repeating units. Intergenic -compare two different sequences. Dotplot - visual alignment of two sequences Multiple Sequence Alignment -Two or more sequences
Overview Why compare sequences Ø Homology vs. identity/similarity Ø Dot. Plots Ø Scoring Ø l l l Match Mismatch Gap penality Global vs. local alignment Ø Do the results make biological sense? Ø
Why Align Sequences Ø Identify conserved sequences
Why Align Sequences Ø Identify conserved sequences l Identify elements that repeat in a single sequence.
Why Align Sequences Ø Identify conserved sequences l l Identify elements that repeat in a single sequence. Identify elements conserved between genes.
Why Align Sequences Ø Identify conserved sequences l l l Identify elements that repeat in a single sequence. Identify elements conserved between genes. Identify elements conserved between species.
Why Align Sequences Ø Identify conserved sequences l l l Identify elements that repeat in a single sequence. Identify elements conserved between genes. Identify elements conserved between species. • Regulatory elements
Why Align Sequences Ø Identify conserved sequences l l l Identify elements that repeat in a single sequence. Identify elements conserved between genes. Identify elements conserved between species. • Regulatory elements • Functional elements
Underlying Hypothesis?
Underlying Hypothesis? EVOLUTION
Underlying Hypothesis? EVOLUTION Based upon conservation of sequence during evolution we can infer function.
Basic terms: Ø Similarity - measurable quantity. l l l Similarity- applied to proteins using concept of conservative substitutions Identity percentage Ø Homology-specific term indicating relationship by evolution
Basic terms: Ø Orthologs: homologous sequences found in two or more species, that have the same function (i. e. alpha- hemoglobin).
Basic terms: Ø Orthologs: homologous sequences found it two or more species, that have the same function (i. e. alpha- hemoglobin). Ø Paralogs: homologous sequences found in the same species that arose by gene duplication. ( alpha and beta hemoglobin).
Pairwise comparison Ø Dotplot l All against all comparison. • Every position is compared with every other position.
Pairwise comparison Ø Dotplot l All against all comparison. • Every position is compared with every other position. • Nucleic acids and proteins have polarity.
Pairwise comparison Ø Dotplot l All against all comparison. • Every position is compared with every other position. • Nucleic acids and proteins have polarity. • Typically one direction makes biological sense.
Pairwise comparison Ø Dotplot l All against all comparison. • Every position is compared with every other position. • Nucleic acids and proteins have polarity. • Typically one direction makes biological sense. l 5’ to 3’ or amino terminus to carboxyl terminus.
Dot. Plot Ø Dotplot- matrix, with one sequence across top, other down side. Put a dot, or 1, where ever there is identity.
Dot. Plot Ø Dotplot- matrix, with one sequence across top, other down side. Put a dot, or 1, where ever there is identity. G A T C T
Dot. Plot Ø Dotplot- matrix, with one sequence across top, other down side. Put a dot, or 1, where ever there is identity. . G A T C T
Dot. Plot Ø Dotplot- matrix, with one sequence across top, other down side. Put a dot, or 1, where ever there is identity. . . G A T C T
Dot. Plot Ø Dotplot- matrix, with one sequence across top, other down side. Put a dot, or 1, where ever there is identity. . . G A T C T . .
Dot. Plot Ø Dotplot- matrix, with one sequence across top, other down side. Put a dot, or 1, where ever there is identity. . . G A T C T . . .
Dot. Plot Ø Dotplot- matrix, with one sequence across top, other down side. Put a dot, or 1, where ever there is identity. . . G A T C T . . .
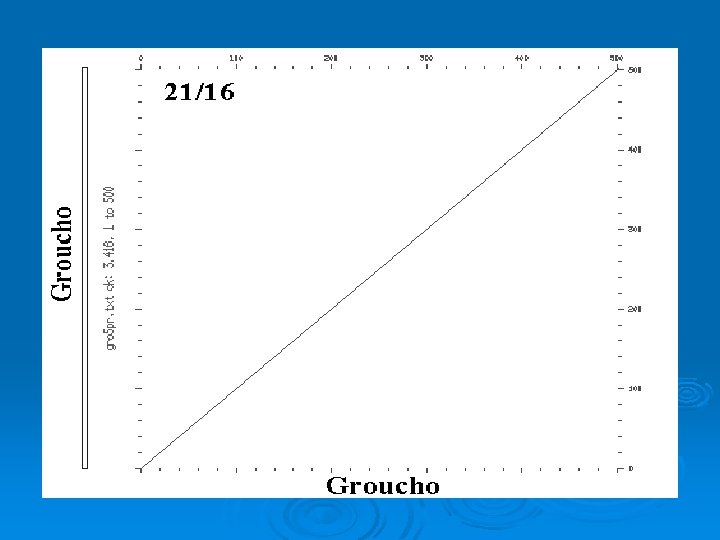
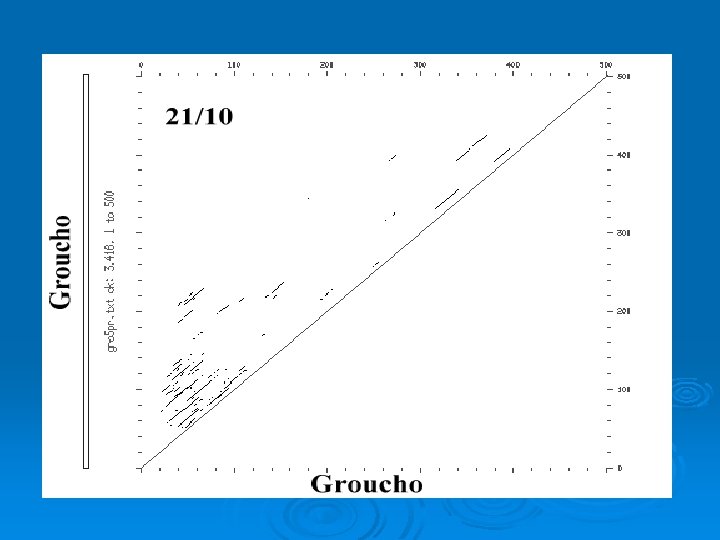
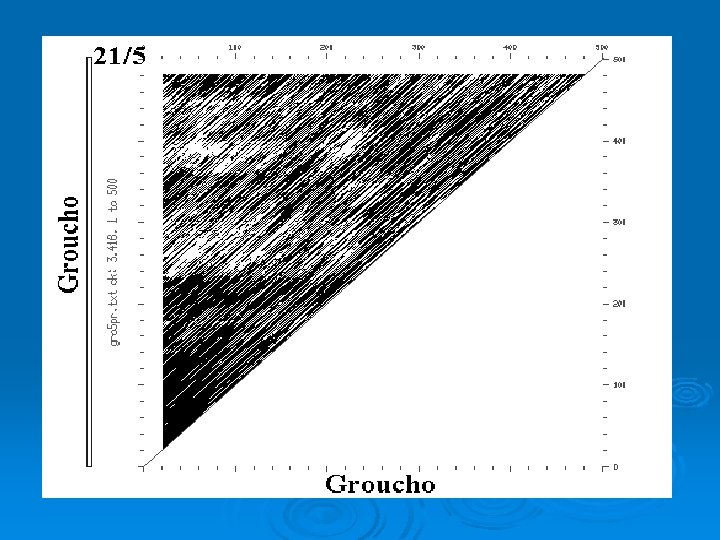
Simple plot Ø Window: size of sequence block used for comparison. In previous example: l window = 1 Ø Stringency = Number of matches required to score positive. In previous example: l stringency = 1 (required exact match)
Dot Plot Ø Compare two sequences in every register. Ø Vary size of window and stringency depending upon sequences being compared. Ø For nucleotide sequences typically start with window = 21; stringency = 14
Dot. Plot WINDOW = 4; STRINGENCY = 2 GATCGTACCATGGAATCGTCCAGATCA GATC + (4/4) GATC - (0/4) GATC + (2/4)
This “match” from G and C out of the four
Top 3 Rows
Intragenic Comparison Ø Rat Groucho Gene
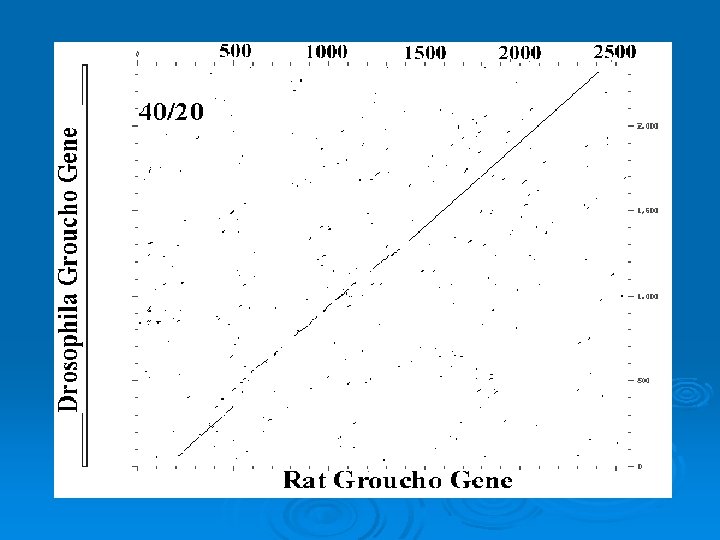
Intergenic Comparison Ø Rat and Drosophila Groucho Gene
Intergenic comparison Ø Nucleotide sequence contains three domains.
Intergenic comparison Ø Nucleotide sequence contains three domains. Ø 50 - 350 - Strong conservation • Indel places comparison out of register
Intergenic comparison Ø Nucleotide sequence contains three domains. 50 - 350 - Strong conservation • Indel places comparison out of register Ø 450 - 1300 - Slightly weaker conservation Ø
Intergenic comparison Ø Nucleotide sequence contains three domains. 50 - 350 - Strong conservation • Indel places comparison out of register Ø 450 - 1300 - Slightly weaker conservation Ø 1300 - 2400 - Strong conservation Ø
Groucho Ø These three coding regions correspond to apparent functional domains of the encoded protein
Scoring Alignments Ø Quality Score: l Score x for match, -y for mismatch;
Scoring Alignments Ø Quality Score: l Score x for match, -y for mismatch; • Penalty for: l l Creating Gap Extending a gap
Scoring Alignments Ø Quality Score: Ø Quality = [10(match)]
Scoring Alignments Ø Quality Score: Ø Quality = [10(match)] + [-1(mismatch)]
Scoring Alignments Ø Quality Score: Ø Quality = [10(match)] + [-1(mismatch)] [(Gap Creation Penalty)(#of Gaps)
Scoring Alignments Ø Quality Score: Ø Quality = [10(match)] + [-1(mismatch)] [(Gap Creation Penalty)(#of Gaps) +(Gap Ext. Pen. )(Total length of Gaps)]
Z Score (standardized score) Ø Z = (Scorealignment - Average Scorerandom) Standard Deviationrandom
Quality Score: Randomization • Program takes sequence and randomizes it X times (user select). • Determines average quality score and standard deviation with randomized sequences • Compare randomized scores with Quality score to help determine if alignment is potentially significant.
Randomization Ø It has become clear that l Sequences appear to evolve in a “word” like fashion. • 26 letters of the alphabet--combined to make words. • Words actually communicate information. l Randomization should actually occur at the level of strings of nucleotides (2 -4).
Global Alignment Ø Global - Compares all possible alignments of two sequences and presents the one with the greatest number of matches and the fewest gaps.
Global Alignment Ø Global - Compares all possible alignments of two sequences and presents the one with the greatest number of matches and the fewest gaps. Ø Alignment will “run” from one end of the longest sequence, to the other end.
Global Alignment Ø Global - Compares all possible alignments of two sequences and presents the one with the greatest number of matches and the fewest gaps. Ø Alignment will “run” from one end of the longest sequence, to the other end. Ø Best for closely related sequences.
Global Alignment Global - Compares all possible alignments of two sequences and presents the one with the greatest number of matches and the fewest gaps. Ø Alignment will “run” from one end of the longest sequence, to the other end. Ø Best for closely related sequences. Ø Can miss short regions of strongly conserved sequence. Ø
Local Alignment Ø Identifies segments of alignment with the highest possible score.
Local Alignment Identifies segments of alignment with the highest possible score. Ø Align sequences, extends aligned regions in both directions until score falls to zero. Ø
Local Alignment Identifies segments of alignment with the highest possible score. Ø Align sequences, extends aligned regions in both directions until score falls to zero. Ø Best for comparing sequences whose relationship is unknown. Ø
Global Alignment: Local Alignment:
Blast 2 Basic Local Alignment Search Tool E (expect) value: value number of hits expected by random chance in a database of same size. Larger numerical value = lower significance HIV sequence
Ø Both Global (Gap) and Local (Bestfit) tools will (almost) always give a match.
Ø Both Global (Gap) and Local (Bestfit) tools will (almost) always give a match. Ø It is important to determine if the match is biologically relevant.
Ø Both Global (Gap) and Local (Bestfit) tools will (almost) always give a match. Ø It is important to determine if the match is biologically relevant. Ø Not necessarily relevant: Low complexity regions. l Sequence repeats (glutamine runs)
Ø Both Global (Gap) and Local (Bestfit) tools will (almost) always give a match. Ø It is important to determine if the match is biologically relevant. Ø Not necessarily relevant: Low complexity regions. l l Sequence repeats (glutamine runs) Transmembrane regions (high in hydrophobes)
Ø Both Global (Gap) and Local (Bestfit) tools will (almost) always give a match. Ø It is important to determine if the match is biologically relevant. Ø Not necessarily relevant: Low complexity regions. l l Sequence repeats (glutamine runs) Transmembrane regions (high in hydrophobes) Ø If working with coding regions, you are typically better off comparing protein sequences. Greater information content.