Sequence alignment Substitution matrices By Thomas Nordahl Morten

Sequence alignment & Substitution matrices By Thomas Nordahl & Morten Nielsen

Sequence alignment 1. Sequence alignment is the most important technique used in bioinformatics 2. Infer properties from one protein to another 1. Homologous sequences often have similar biological functions 3. Most information can be deduced from a sequence if the 3 D-structure is known 4. 3 D-structure determination is very time consuming (X-ray, NMR) 1. Several mg of pure protein is required (> 100 mg) 2. Make crystal, solve structure, 1 -3 years 3. Large facilities are needed to produce X-ray 1. Rotating anode or synchrotron 5. Determining primary sequence is fast, cheap 6. Structure more conserved than sequence
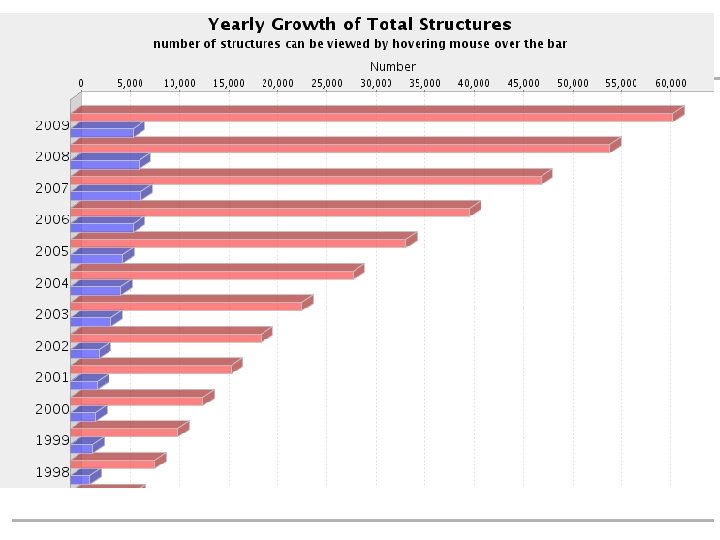
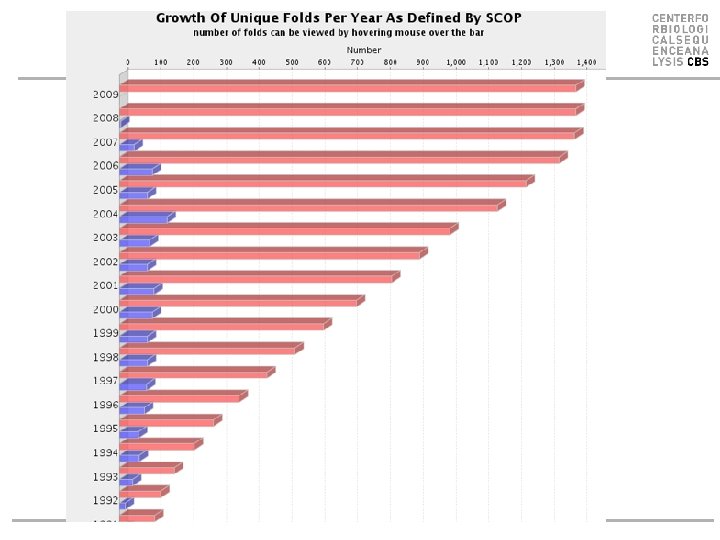

Protein class & folds

What can we learn from sequence alignment • Find similar sequence from another organism • Information from the known sequence can be inherited • Layers of conserved information: • Structure > function > sequence where, ‘>’ means more conserved than • Structure (3 D) is the most conserved feature • Proteins with different function may still share the same structure • Proteins with different may still share the same function • Often same function if 40 -50% sequence identity • Often same protein fold if above 30% seqience identity

Sequence alignment MVSTA MLTSA Antal identiske aa, % id ? Alignment score using identity matrix? M V S T A M 1 0 0 V 0 1 0 0 0 Similar aa can be substituted therefore other types of substitution matrices are used. S 0 0 1 0 0 T 0 0 0 1 0 A 0 0 1

Blosum & PAM matrices • Blosum matrices are the most commonly used substitution matrices – Blosum 50, Blosum 62, blosum 80 • PAM - Percent Accepted Mutations – PAM-0 is the identity matrix – PAM-1 diagonal small deviations from 1, off-diag has small deviations from 0 – The PAM 1 matrix estimates what rate of substitution would be expected if 1% of the amino acids had changed – PAM-250 is PAM-1 multiplied by itself 250 times

Blocks Database ��

Blocks Database ��
 • The log-odd")
Log-odds scores • Log-odds scores are given by • Log( Observation/Expected) • The log-odd score of matching amino acid j with amino acid i in an alignment is • where Pij is the frequency of observation i aligned with j, and Qi, Qj are the frequency if amino acids i and j in the data set. • The log-odd score is (in bit units) – Where, Log 2(x)=logn(x)/logn(2) – S has been normalized to half bits, therefore the factor 2

Example of a scoring matrix BLOSUM 80 A R N D C Q E G H I L K M F P S T W Y V A 7 -3 -3 -3 -1 -2 -2 0 -3 -3 -3 -1 -2 -4 -1 2 0 -5 -4 -1 R -3 9 -1 -3 -6 1 -1 -4 0 -5 -4 3 -3 -5 -3 -2 -2 -5 -4 -4 N -3 -1 9 2 -5 0 -1 -1 1 -6 -6 0 -4 -6 -4 1 0 -7 -4 -5 D -3 -3 2 10 -7 -1 2 -3 -2 -7 -7 -2 -6 -6 -3 -1 -2 -8 -6 -6 C -1 -6 -5 -7 13 -5 -7 -6 -7 -2 -3 -6 -3 -4 -6 -2 -2 -5 -5 -2 Q -2 1 0 -1 -5 9 3 -4 1 -5 -4 2 -1 -5 -3 -1 -1 -4 -3 -4 E -2 -1 -1 2 -7 3 8 -4 0 -6 -6 1 -4 -6 -2 -1 -2 -6 -5 -4 G 0 -4 -1 -3 -6 -4 -4 9 -4 -7 -7 -3 -5 -6 -5 -1 -3 -6 -6 -6 H -3 0 1 -2 -7 1 0 -4 12 -6 -5 -1 -4 -2 -3 -4 3 -5 I -3 -5 -6 -7 -2 -5 -6 -7 -6 7 2 -5 2 -1 -5 -4 -2 -5 -3 4 L -3 -4 -6 -7 -5 2 6 -4 3 0 -5 -4 -3 -4 -2 1 K -1 3 0 -2 -6 2 1 -3 -1 -5 -4 8 -3 -5 -2 -1 -1 -6 -4 -4 M -2 -3 -4 -6 -3 -1 -4 -5 -4 2 3 -3 9 0 -4 -3 -1 -3 -3 1 F -4 -5 -6 -6 -2 -1 0 -5 0 10 -6 -4 -4 0 4 -2 P -1 -3 -4 -3 -6 -3 -2 -5 -4 -5 -5 -2 -4 -6 12 -2 -3 -7 -6 -4 S 2 -2 1 -1 -2 -1 -1 -1 -2 -4 -4 -1 -3 -4 -2 7 2 -6 -3 -3 T 0 -2 -2 -1 -2 -3 -3 -2 -3 -1 -1 -4 -3 2 8 -5 -3 0 W -5 -5 -7 -8 -5 -4 -6 -6 -4 -5 -4 -6 -3 0 -7 -6 -5 16 3 -5 Y -4 -4 -4 -6 -5 -3 -5 -6 3 -3 -2 -4 -3 4 -6 -3 -3 3 11 -3 V -1 -4 -5 -6 -2 -4 -4 -6 -5 4 1 -2 -4 -3 0 -5 -3 7

An example NAA NAD NAV NDA NDD NDV NVA NVD NVV = = = = = 14 5 5 5 8 2 5 2 2 PAA PAD PAV PDA PDD PDV PVA PVD PVV = = = = = 14/48 5/48 8/48 2/48 5/48 2/48 1: 2: 3: 4: VVAD AAAD DVAD DAAA QA = 8/16 QD = 5/16 QV = 3/16 MSA

Example continued PAA PAD PAV PDA PDD PDV PVA PVD PVV = = = = = 0. 29 0. 10 0. 17 0. 04 0. 10 0. 04 Q AQ A Q AQ D Q AQ V Q DQ A Q DQ D Q DQ V Q VQ A Q VQ D Q VQ V = = = = = 0. 25 0. 16 0. 09 0. 16 0. 10 0. 06 0. 09 0. 06 0. 03 1: 2: 3: 4: VVAD AAAD DVAD DAAA QA=0. 50 QD=0. 31 QV=0. 19 MSA

So what does this mean? PAA PAD PAV PDA PDD PDV PVA PVD PVV = = = = = 0. 29 0. 10 0. 17 0. 04 0. 10 0. 04 Q AQ A Q AQ D Q AQ V Q DQ A Q DQ D Q DQ V Q VQ A Q VQ D Q VQ V = = = = = 0. 25 0. 16 0. 09 0. 16 0. 10 0. 06 0. 09 0. 06 0. 03 SAA SAD SAV SDA SDD SDV SVA SVD SVV = 0. 44 =-1. 17 = 0. 30 =-1. 17 = 1. 54 =-0. 98 = 0. 30 =-0. 98 = 0. 49 • BLOSUM is a log-likelihood matrix: Sij = 2 log 2(Pij/(Qi. Qj))

The Scoring matrix A D V A 0. 44 -1. 17 D -1. 17 1. 54 -0. 98 V 0. 30 -0. 98 0. 30 0. 49 1: 2: 3: 4: VVAD AAAD DVAD DAAA MSA

And what does the BLOSUMXX mean? • High Blosum values mean high similarity between clusters – Conserved substitution allowed • Low Blosum values mean low similarity between clusters – Less conserved substitutions allowed

BLOSUM 80 A R N D C Q E G H I L K M F P S T W Y V A 7 -3 -3 -3 -1 -2 -2 0 -3 -3 -3 -1 -2 -4 -1 2 0 -5 -4 -1 R -3 9 -1 -3 -6 1 -1 -4 0 -5 -4 3 -3 -5 -3 -2 -2 -5 -4 -4 N -3 -1 9 2 -5 0 -1 -1 1 -6 -6 0 -4 -6 -4 1 0 -7 -4 -5 D -3 -3 2 10 -7 -1 2 -3 -2 -7 -7 -2 -6 -6 -3 -1 -2 -8 -6 -6 C -1 -6 -5 -7 13 -5 -7 -6 -7 -2 -3 -6 -3 -4 -6 -2 -2 -5 -5 -2 Q -2 1 0 -1 -5 9 3 -4 1 -5 -4 2 -1 -5 -3 -1 -1 -4 -3 -4 E -2 -1 -1 2 -7 3 8 -4 0 -6 -6 1 -4 -6 -2 -1 -2 -6 -5 -4 G 0 -4 -1 -3 -6 -4 -4 9 -4 -7 -7 -3 -5 -6 -5 -1 -3 -6 -6 -6 H -3 0 1 -2 -7 1 0 -4 12 -6 -5 -1 -4 -2 -3 -4 3 -5 I -3 -5 -6 -7 -2 -5 -6 -7 -6 7 2 -5 2 -1 -5 -4 -2 -5 -3 4 L -3 -4 -6 -7 -5 2 6 -4 3 0 -5 -4 -3 -4 -2 1 K -1 3 0 -2 -6 2 1 -3 -1 -5 -4 8 -3 -5 -2 -1 -1 -6 -4 -4 M -2 -3 -4 -6 -3 -1 -4 -5 -4 2 3 -3 9 0 -4 -3 -1 -3 -3 1 F -4 -5 -6 -6 -2 -1 0 -5 0 10 -6 -4 -4 0 4 -2 P -1 -3 -4 -3 -6 -3 -2 -5 -4 -5 -5 -2 -4 -6 12 -2 -3 -7 -6 -4 S 2 -2 1 -1 -2 -1 -1 -1 -2 -4 -4 -1 -3 -4 -2 7 2 -6 -3 -3 T 0 -2 -2 -1 -2 -3 -3 -2 -3 -1 -1 -4 -3 2 8 -5 -3 0 W -5 -5 -7 -8 -5 -4 -6 -6 -4 -5 -4 -6 -3 0 -7 -6 -5 16 3 -5 Y -4 -4 -4 -6 -5 -3 -5 -6 3 -3 -2 -4 -3 4 -6 -3 -3 3 11 -3 V -1 -4 -5 -6 -2 -4 -4 -6 -5 4 1 -2 -4 -3 0 -5 -3 7 <Sii> = 9. 4 <Sij> = -2. 9

BLOSUM 30 A R N D C Q E G H I L K M F P S T W Y V A 4 -1 0 0 -3 1 0 0 -2 0 -1 0 1 -2 -1 1 1 -5 -4 1 R -1 8 -2 -1 -2 3 -1 -2 -1 -3 -2 1 0 -1 -1 -1 -3 0 0 -1 N 0 -2 8 1 -1 -1 -1 0 -2 0 0 -1 -3 0 1 -7 -4 -2 D 0 -1 1 9 -3 -1 1 -1 -2 -4 -1 0 -3 -5 -1 0 -1 -4 -1 -2 C -3 -2 -1 -3 17 -2 1 -4 -5 -2 0 -3 -2 -3 -3 -2 -2 -2 -6 -2 Q 1 3 -1 -1 -2 8 2 -2 0 -1 -3 0 -1 -1 -3 E 0 -1 -1 1 1 2 6 -2 0 -3 -1 2 -1 -4 1 0 -2 -1 -2 -3 G 0 -2 0 -1 -4 -2 -2 8 -3 -1 -2 -3 -1 0 -2 1 -3 -3 H -2 -1 -1 -2 -5 0 0 -3 14 -2 -1 -2 2 -3 1 -1 -2 -5 0 -3 I 0 -3 0 -4 -2 -2 -3 -1 -2 6 2 -2 1 0 -3 -1 4 L -1 -2 -2 -1 0 -2 -1 2 4 -2 2 2 -3 -2 0 -2 3 1 K 0 1 0 0 -3 0 2 -1 -2 -2 -2 4 2 -1 1 0 -1 -2 M 1 0 0 -3 -2 -1 -1 -2 2 1 2 2 6 -2 -4 -2 0 -3 -1 0 F -2 -1 -1 -5 -3 -3 -4 -3 -3 0 2 -1 -2 10 -4 -1 -2 1 3 1 P -1 -1 -3 0 1 -1 1 -3 -3 1 -4 -4 11 -1 0 -3 -2 -4 S 1 -1 0 0 -2 -1 0 0 -1 -1 -2 0 -2 -1 -1 4 2 -3 -2 -1 T 1 -3 1 -1 -2 0 -2 -2 -2 0 0 -1 0 -2 0 2 5 -5 -1 1 W -5 0 -7 -4 -2 -1 -1 1 -5 -3 -2 -2 -3 1 -3 -3 -5 20 5 -3 Y -4 0 -4 -1 -6 -1 -2 -3 0 -1 3 -1 -1 3 -2 -2 -1 5 9 1 V 1 -1 -2 -2 -2 -3 -3 4 1 -2 0 1 -4 -1 1 -3 1 5 <Sii> = 8. 3 <Sij> = -1. 16
- Slides: 20