Sensory Processes First Hour How does perception depend

")

 Ganglion cell Photoreceptor layer Bipolar cell Light entering Amacrine cell")
 40º 30º 20º 10º fovea light 10º 20º 40º 30º")


- Slides: 10
Sensory Processes First Hour - How does perception depend on sensory processing? Transduction of sensory information The visual system as the “prototype” • The duplex theory of vision – Rods and cones and visual acuity • The visual cycle • The stabilized image procedure • Dark adaptation An exploration of the 6 th sense – A test for ESP
Sense Vision Stimulus Light waves Audition Sound waves Receptors Light-sensitive cells (rods and cones) in retina Pressure-sensitive hair cells in cochlea of inner ear Touch Pressure on skin Sensitive ends of “touch” neurons in skin Pain Variety of potentially or actually harmful stimuli Molecules dissolved in fluid on tongue Sensitive ends of “pain” neurons in skin and other tissue Taste Smell Chemical-sensitive cells on tongue Molecules dissolved Sensitive ends of olfactory neurons in mucous membrane in fluid on mucous membranes in nose
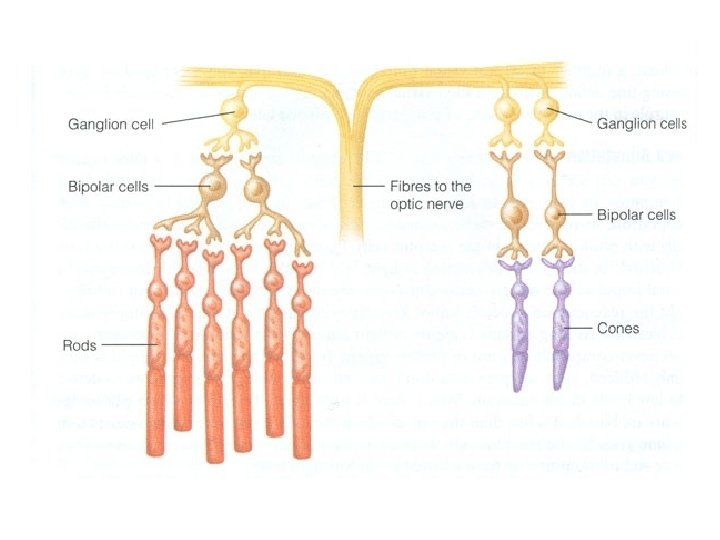
Duplex Theory of Vision: Two types of receptors Scotopic vision: rods • Not very accurate • Highly sensitive • Monochromatic vision • 120, 000 rods Photopic vision: cones • Responsible for visual acuity • Not as sensitive as rods • Colour vision • 7, 000 cones
Retina (p 185 Gleitman) Ganglion cell Photoreceptor layer Bipolar cell Light entering Amacrine cell Horizontal cell Rod Cone To brain via optic nerve
(See Gleitman p. 185) 40º 30º 20º 10º fovea light 10º 20º 40º 30º blind spot
Geographical Distribution of Retinal Cells Rods vs. Cones Number of cells / sq. mm. 180000 160000 Rods 140000 Cones 120000 100000 80000 60000 40000 20000 0 periphery (rods) light -60 -40 -20 0 periphery (rods) 40 60 Distance from fovea (degrees) fovea (cones) blind spot 20 Fovea Blind spot
What the eye sees: By daylight, only the central fovea sees clearly and in colour. On a dark night, only the periphery sees, but only in black and white and with poor resolution. The fovea is “blind. ”
The Visual Cycle • Iodopsin • Rhodopsin The stabilized image procedure
Dark-adaptation curves Minimum intensity of light required to see More Less Cone adaptation Rod adaptation 10 9 8 “Rod-cone break” at about 7 minutes 7 6 5 4 3 2 1 0 0 5 10 15 20 25 Minutes in the dark 30