Sensor Based N Management in the Yaqui Valley

Sensor Based N Management in the Yaqui Valley CIMMYT Oklahoma State University

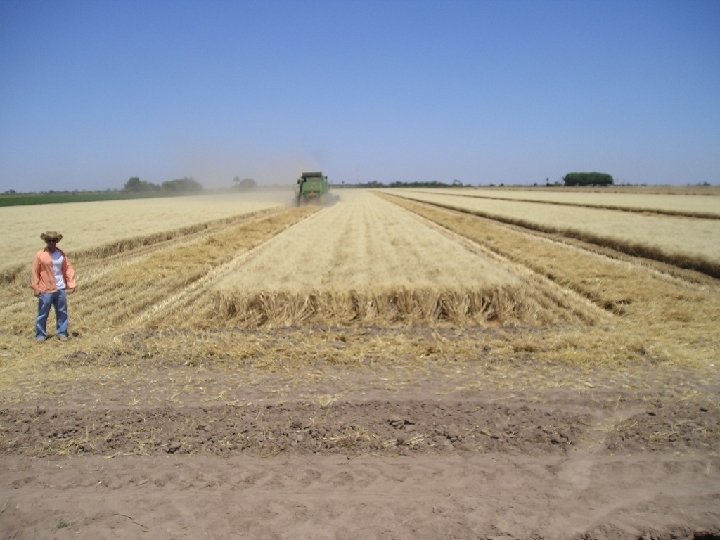
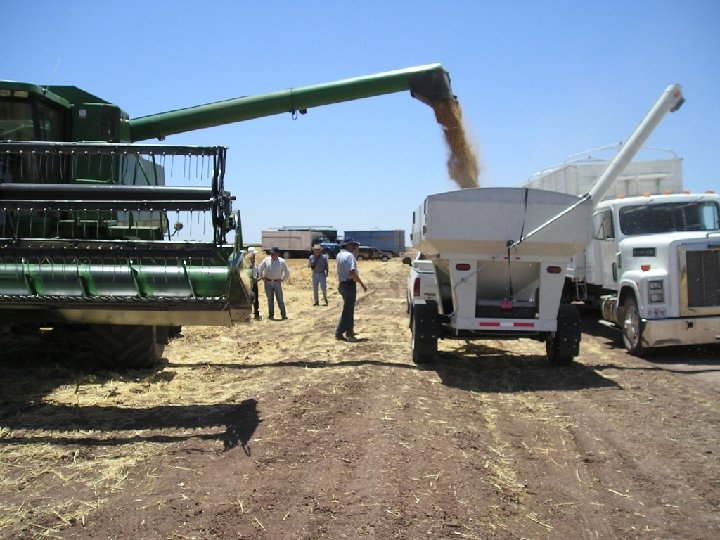
Yaqui Valley
 Recovery")
Percentage Nitrogen Recovery in Wheat in the Yaqui Valley (average of 30 fields) Recovery by the plant Losses

Losses to the environment NH 3 NOx N 2 O N 2 Urea NH 4+ NO 3 - Organic Matter NH 4+ NO 3 - Nitrification Denitrification

Beman et al. 2005 Nature

Costs of Production Wheat Cycle 2009 -2010 Soil preparation $1, 470 11% Planting $1, 267 9% Fertilization $3, 654 26% Irrigation and Drainage $1, 753 13% Pest control $3, 612 26% Harvesting $1, 370 10% Other $720 5% Total $13, 846 100% *Does not include interest Exchange rate 1 USD= 12. 5 Mex peso Source: AOASS 2009

Nitrogen Management in Wheat in the Yaqui Valley
")
Yaqui Valley Ten Year Average Wheat Yield 6. 0 t/ha (~90 bushels/acre)

Cumulative nitrogen absorption curve in wheat 250 kg. N/ha 75% 0% 25% Farmer’s management

Urea or NH 3 180 kg N /ha Pre-plant

NH 3 70 kg N /ha First post-plant irrigation 45 -55 days after planting NH 3 Total 250 kg. N/ha

Soil residual nitrogen in Farmers’ Fields in the Yaqui Valley Crop cycle 96 -98 soil Farmers’ Fields

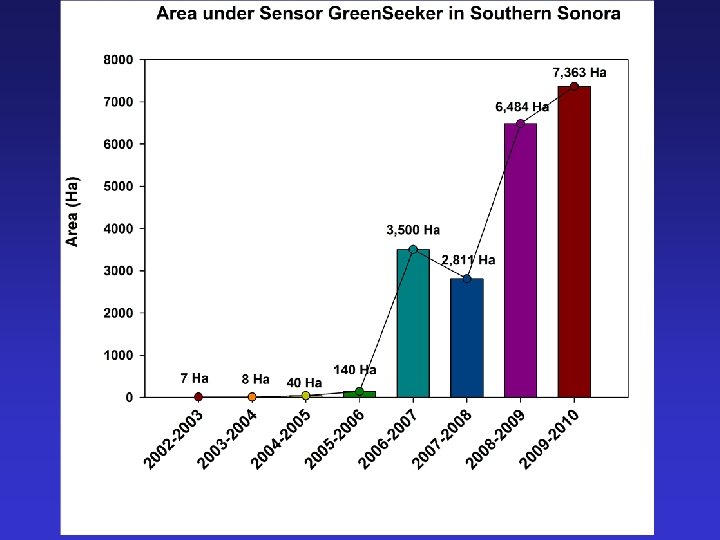
Sensor Technology Green. Seeker Diagnostic tool that allows you to identify the optimum N rate for each individual farmer’s field

Technology Components 1. Establishment of an N rich strip 2. NDVI reading in the N rich strip and farmer’s field that will be diagnosed 3. Use of a crop algorithm to derive N recommendations

20 has N Rich Strip 10 meters Apply pre-plant or at planting

2. NDVI reading in the N rich strip and the farmer’s field that will be diagnosed Measurement: As close as possible to the first post plant irrigation but 40 days after planting.

3. Use of the Crop Algorithm to derive a N recommendation

RESULTS 2009 -2010

TECHNOLOGY TRANSFER IN SONORA • • • CIMMYT Oklahoma State University AOASS PIEAES FUNDACION PRODUCE SONORA / COFUPRO FIRA SAGARPA CONACYT Uniones de Agricultores
 UCAC Ing. Emilio")
TECHNICAL TEAM COOPERATIVE FARM ADVISERS AOASS Ing. Arturo Muñoz Cañez (coordinador) UCAC Ing. Emilio Acosta M. Ing. Julio Galaz Gil UCAY Ing. Ramón Gil Cota. UCAH Ing. Julio C. Espinoza. AAVYAC Ing. Carlos Remy M. UCAYVISA Ing. Raúl Salinas G. USPRUSS Ing. Carlos Rodríguez P Ing. Manuel Ferra M. Ing. Carlos Quiñones. UCAMAYO Ing. Manuel H. Alcántar APRONSA Ing. Ignacio Miranda I. CIMMYT Dr. Ivan Ortiz-Monasterio Ing. Maria Elena Cardenas

N Rich Strip Sensor Management 107 fields

PROGRAM 2009 -2010 • 7363 hectares 38% tested • 105 participating farmers • 316 field with an N rich strip

107 Fields Difference 85 kg N/ha 64 kg. N/ha

60 -68 kg. N 86 60 101 107 fields
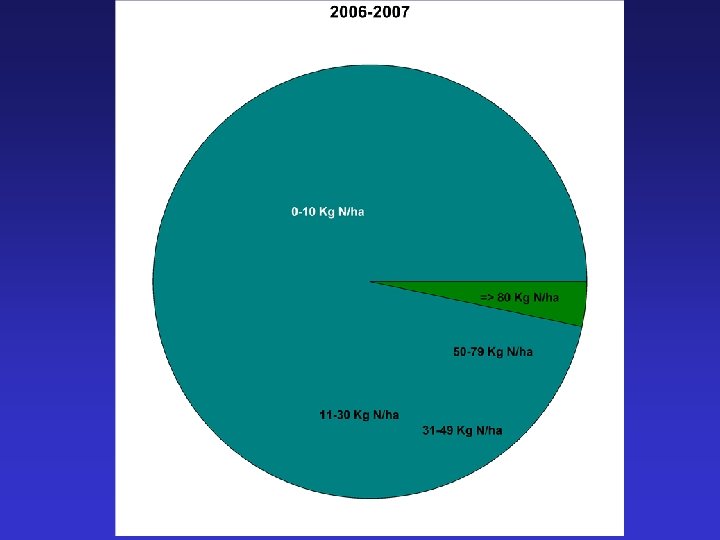
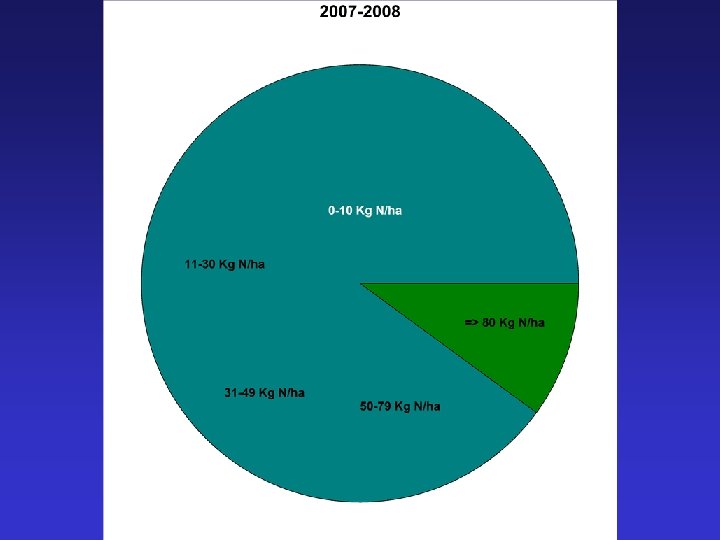
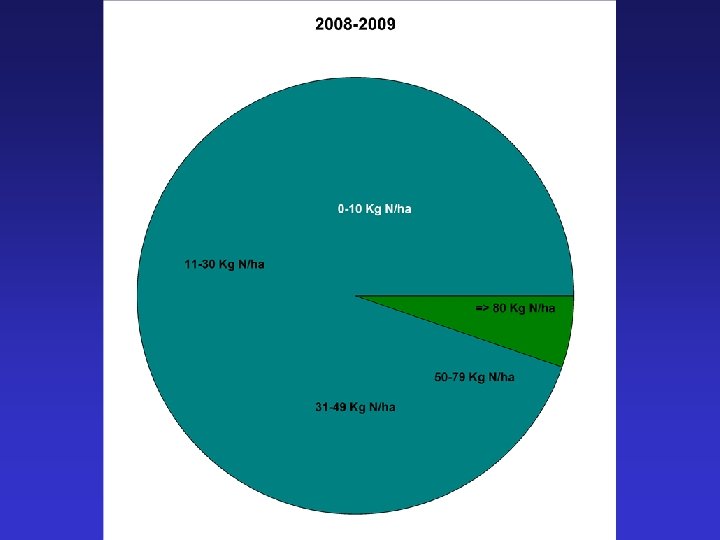
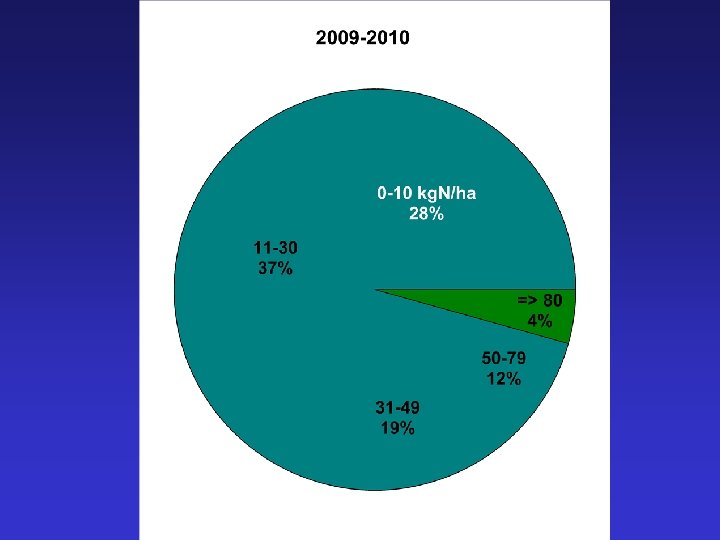

N Saving Using the Green. Seeker 2007 -2008 60 kg. N/ha 1. 00 USD/kg. N = 60 USD/ha 2008 -2009 68 kg. N/ha 1. 30 USD/kg. N = 88 USD/ha 2009 -2010 64 kg N/ha 1. 00 USD/kg. N = 64 USD/ha

NATIONAL SENSOR PROGRAM

Calibration Experiments

CALIBRATION

WHEAT 1 2 3 5 4 7 6 8 9 1: B. C. 2: Sonora 3: Sinaloa 4: Jalisco 5: Guanajuato 6: Edo. México 7: Querétaro 8: Tlaxcala 9: Puebla

MAIZE 1 3 2 5 1: Sonora 2: Sinaloa 3: Chihuahua 4: Jalisco 5: Zacatecas 6: Edo. México 7: Hidalgo 8: D. F. 9: Tlaxcala 10: Puebla 11: Oaxaca 12: Chiapas 13: Tabasco 14: Yucatán 15: Quintana Roo 14 7 4 6 8 15 9 10 13 11 12

Green. Seeker in Maize
 Starter N (kg/ha) Sidedress")
Ten nitrogen experiments over four years Treatment Preplant N (kg/ha) Starter N (kg/ha) Sidedress N (kg/ha) V 6 1 0 2 200 0 3 0 40 0 4 0 40 30 5 0 40 60 6 0 40 90 7 0 40 120 8 0 40 150 9 0 40 180

V 7 -V 8 16000 R 2 = 0. 4736 12000 10000 8000 6000 4000 2000 0 0. 0002 0. 0004 0. 0006 0. 0008 INSEY 0. 0012 0. 0014 0. 0016 INSEY Data from seven Experiments V 10 -V 12 16000 14000 YIELD (Kg/Ha) ]ield (Kg/Ha) 14000 R 2 = 0. 6155 12000 10000 8000 6000 4000 2000 0 0. 0002 0. 0004 0. 0006 0. 0008 INSEY 0. 0012 0. 0014

Sensor Work in Asia

China Pakistan India Source: D. Hodson
 6000 5000")
Spring wheat INSEY Yaqui vs Pakistan 10000 9000 8000 7000 Yield (Kg/ha) 6000 5000 Pakistan Obregon 4000 3000 2000 1000 0 0 0. 002 0. 004 0. 006 0. 008 Pakistani data: Dr. Imtiaz Husain 0. 01 INSEY 0. 012 0. 014 0. 016 0. 018 0. 02

Spring wheat INSEY Yaqui vs India Chart Title 10000. 0 9000. 0 8000. 0 7000. 0 Yield (Kg/ha) 6000. 0 India 40 -45 dds 5000. 0 Obregon India 49 -54 dds 4000. 0 India 59 -61 dds 3000. 0 2000. 0 1000. 0 0 0. 002 0. 004 0. 006 0. 008 0. 01 INSEY Indian data: Dr. Ramesh K. Sharma 0. 012 0. 014 0. 016 0. 018 0. 02

Thank you

Spring wheat INSEY Yaqui vs Mexicali Data: Dr. Jesus Santillano
- Slides: 46