
Sensitivity analyses in metaanalytic reviews Sven Kepes Michael



- Slides: 33
Sensitivity analyses in metaanalytic reviews Sven Kepes & Michael A. Mc. Daniel April 29, 2017
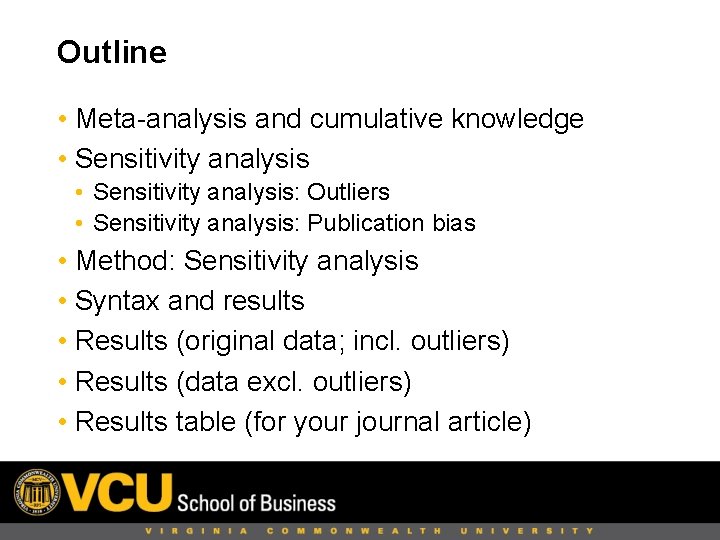
Outline • Meta-analysis and cumulative knowledge • Sensitivity analysis: Outliers • Sensitivity analysis: Publication bias • Method: Sensitivity analysis • Syntax and results • Results (original data; incl. outliers) • Results (data excl. outliers) • Results table (for your journal article)
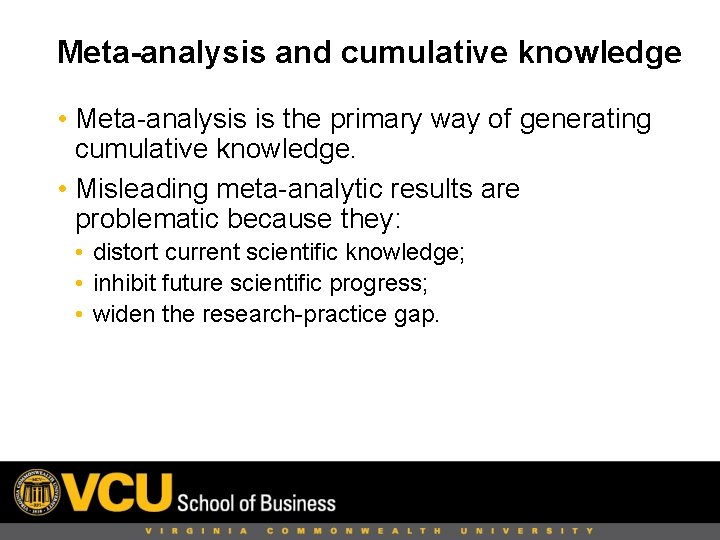
Meta-analysis and cumulative knowledge • Meta-analysis is the primary way of generating cumulative knowledge. • Misleading meta-analytic results are problematic because they: • distort current scientific knowledge; • inhibit future scientific progress; • widen the research-practice gap.
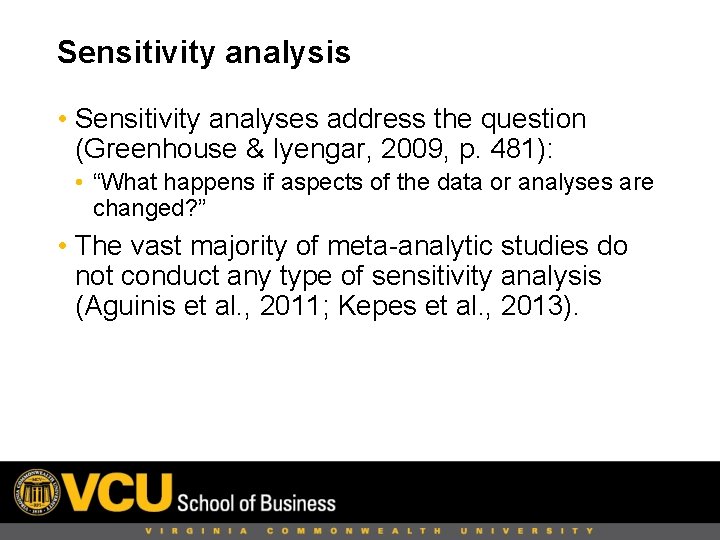
Sensitivity analysis • Sensitivity analyses address the question (Greenhouse & Iyengar, 2009, p. 481): • “What happens if aspects of the data or analyses are changed? ” • The vast majority of meta-analytic studies do not conduct any type of sensitivity analysis (Aguinis et al. , 2011; Kepes et al. , 2013).
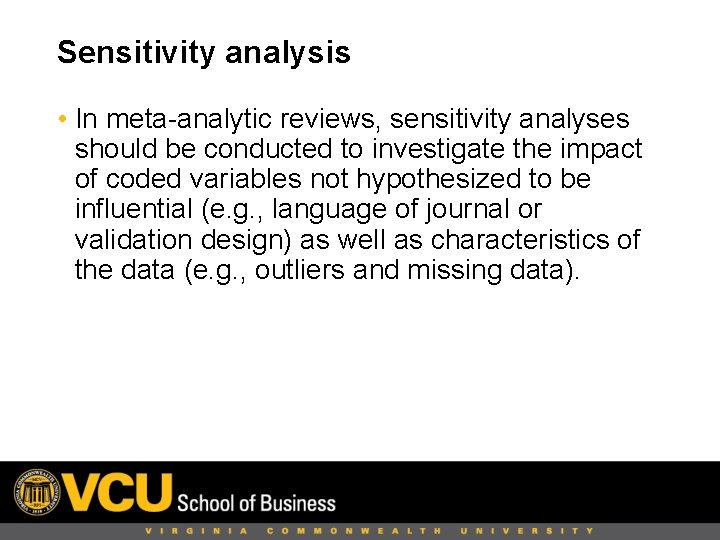
Sensitivity analysis • In meta-analytic reviews, sensitivity analyses should be conducted to investigate the impact of coded variables not hypothesized to be influential (e. g. , language of journal or validation design) as well as characteristics of the data (e. g. , outliers and missing data).
Sensitivity analysis: Outliers • Outliers are observations that “deviate markedly from other members of the sample in which it occurs” (Grubbs, 1969, p. 1) • They are quite common in any type of dataset. • Outliers tend to inflate the amount of residual heterogeneity, typically leading to upwardly biased mean estimates (Viechtbauer & Cheung, 2010). • Only around 3% of meta-analytic studies conduct outlier analyses (Aguinis et al. , 2011).
Sensitivity analysis: Publication bias • Publication bias (PB) occurs to the extent that research findings on a particular relation that are available are not representative of all research findings on that relation of interest (Kepes et al. , 2012). • PB is quite common in our published research (Ferguson & Brannick, 2012). • PB tends to lead to inflated mean estimates (Kepes et al. , 2012). • Only around 4% of meta-analytic studies conduct PB analyses (Banks et al. , 2012).
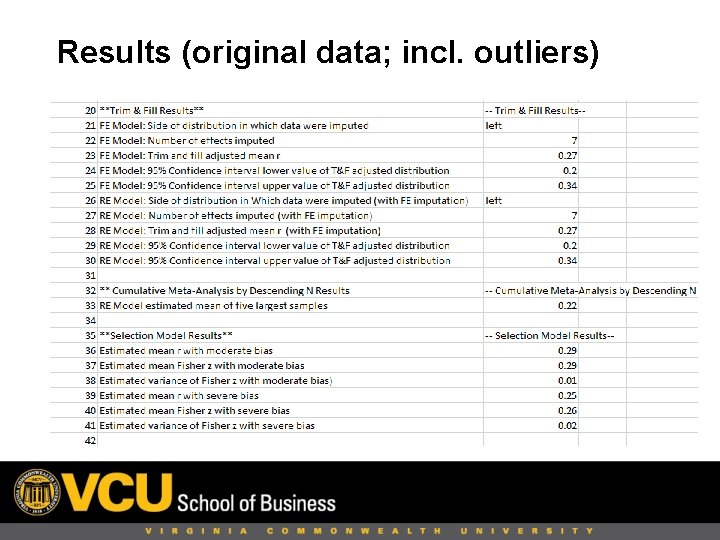
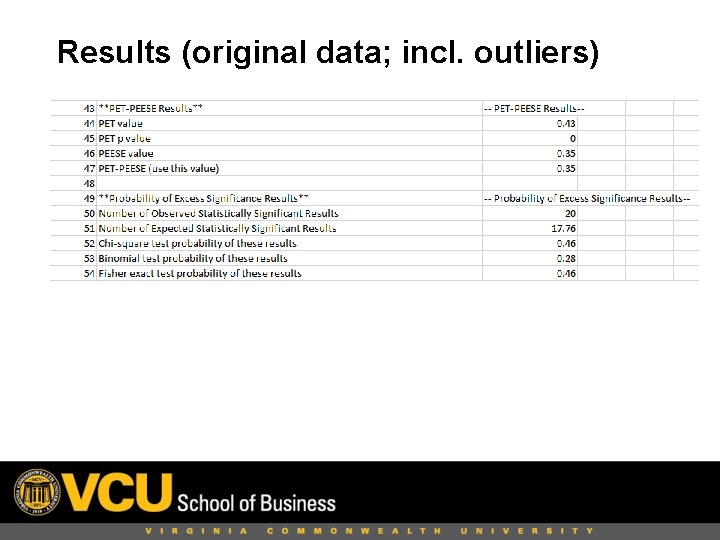
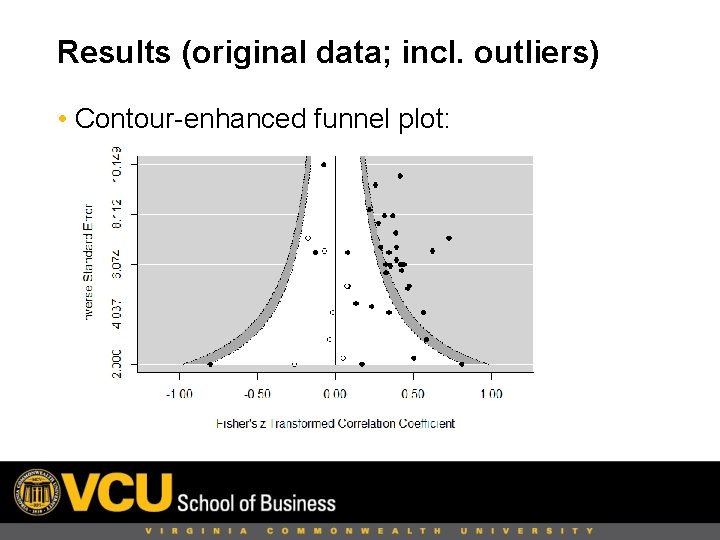
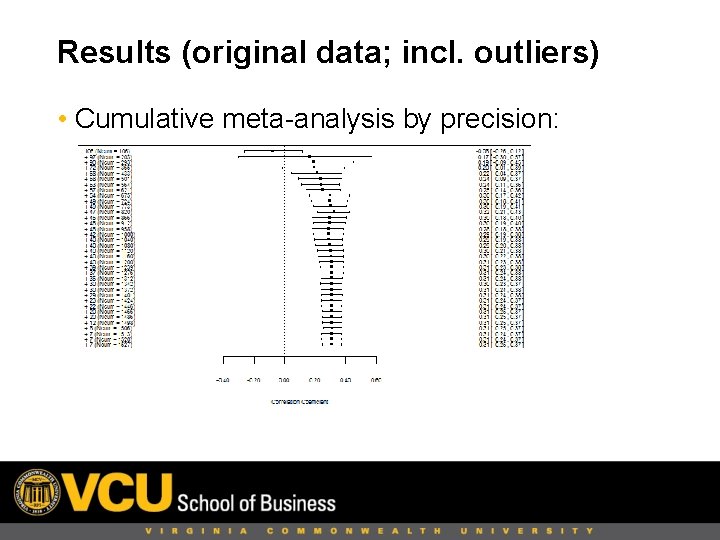
Method: Sensitivity analysis • Naïve random-effects (RE) meta-analysis. • Publication bias analyses (Kepes et al. , 2012): • • Trim and fill (Duval, 2005). Contour-enhanced funnel plot (Peters et al. , 2008). A priory selection models (Vevea & Woods, 2005). Cumulative meta-analysis by precision (Kepes et al. , 2012). • PET-PEESE (precision-effect test, precision effect estimate with standard error; Stanley and Doucouliagos, 2014). • Tests of excess significance (P-TES; Francis, 2014; Ioannidis & Trikalinos, 2007).
Method: Sensitivity analysis • Outlier analyses: • One-sample removed analysis (aka “leave one out” [LOO] analysis; Borenstein et al. , 2009). • Viechtbauer and Cheung’s (2010; see also Viechtbauer, 2015) multifaceted, multivariate outlier detection battery.
Syntax and results • Meta-analysis of brain volume and intelligence: ### Read in data from an Excel file (data are from Mc. Daniel, 2005). Big. Brain <- read_excel("Illustrative data. xls", sheet = "r", col_names = TRUE, col_types = NULL, na = "", skip = 0) ### Look at the data str(Big. Brain) nrow(Big. Brain) ncol(Big. Brain) ### Look at the top 6 cases head(Big. Brain)
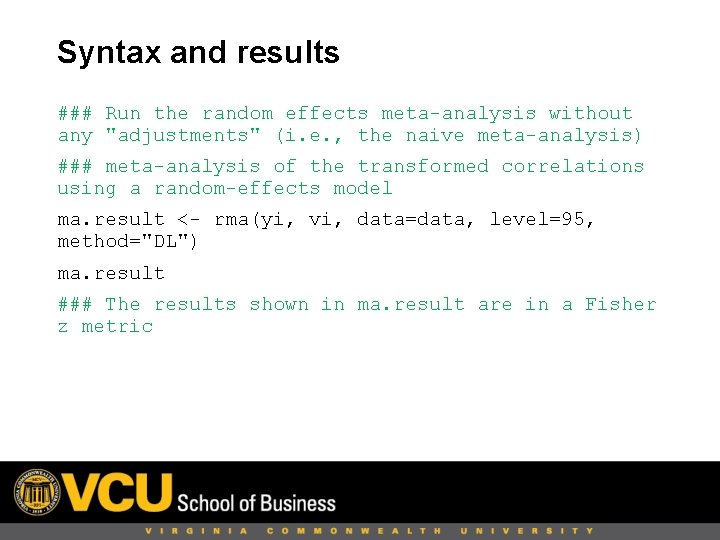
Syntax and results ### Run the random effects meta-analysis without any "adjustments" (i. e. , the naive meta-analysis) ### meta-analysis of the transformed correlations using a random-effects model ma. result <- rma(yi, vi, data=data, level=95, method="DL") ma. result ### The results shown in ma. result are in a Fisher z metric
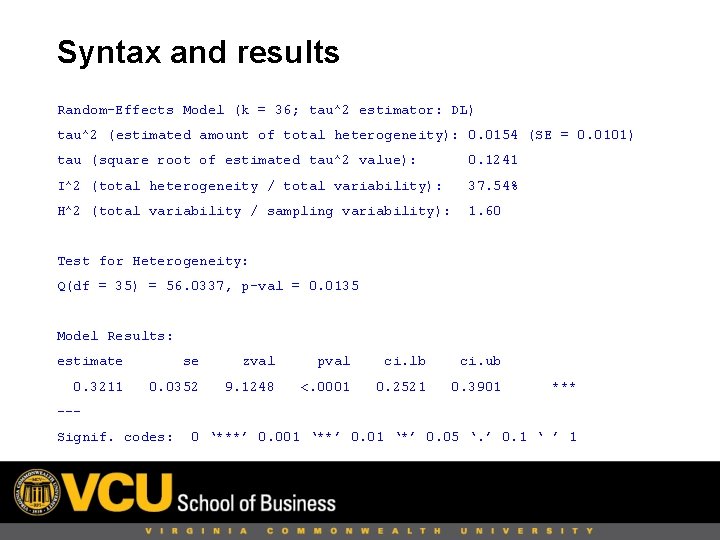
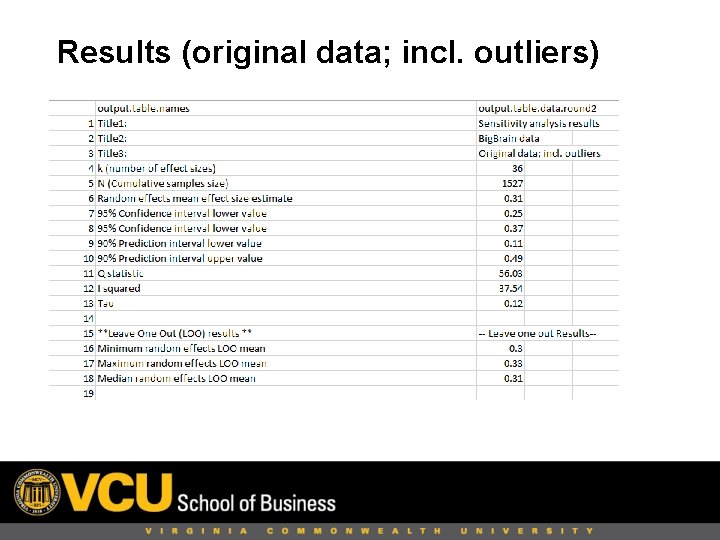
Syntax and results Random-Effects Model (k = 36; tau^2 estimator: DL) tau^2 (estimated amount of total heterogeneity): 0. 0154 (SE = 0. 0101) tau (square root of estimated tau^2 value): 0. 1241 I^2 (total heterogeneity / total variability): 37. 54% H^2 (total variability / sampling variability): 1. 60 Test for Heterogeneity: Q(df = 35) = 56. 0337, p-val = 0. 0135 Model Results: estimate se zval pval ci. lb ci. ub 0. 3211 0. 0352 9. 1248 <. 0001 0. 2521 0. 3901 *** --Signif. codes: 0 ‘***’ 0. 001 ‘**’ 0. 01 ‘*’ 0. 05 ‘. ’ 0. 1 ‘ ’ 1
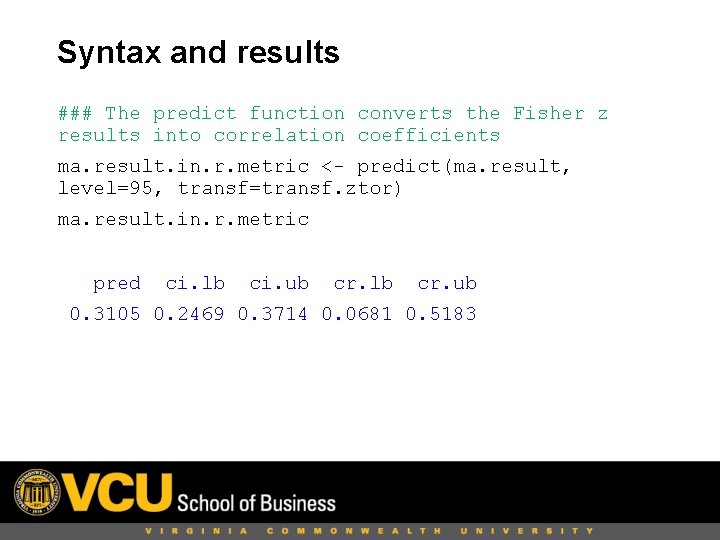
Syntax and results ### The predict function converts the Fisher z results into correlation coefficients ma. result. in. r. metric <- predict(ma. result, level=95, transf=transf. ztor) ma. result. in. r. metric pred ci. lb ci. ub cr. lb cr. ub 0. 3105 0. 2469 0. 3714 0. 0681 0. 5183
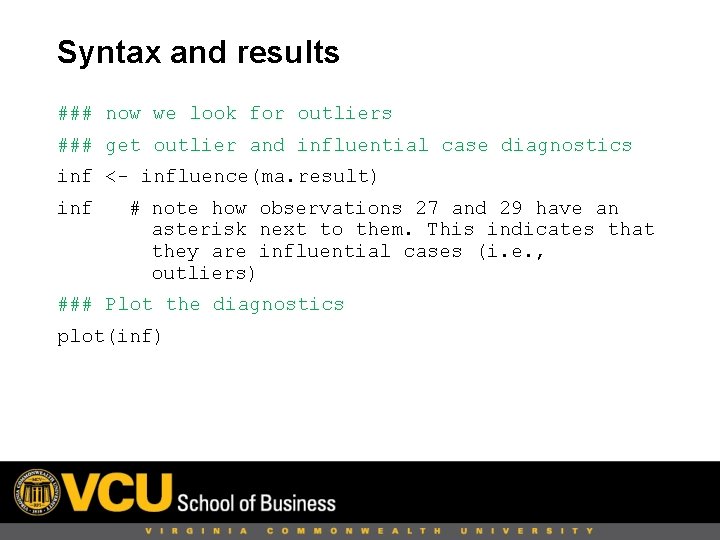
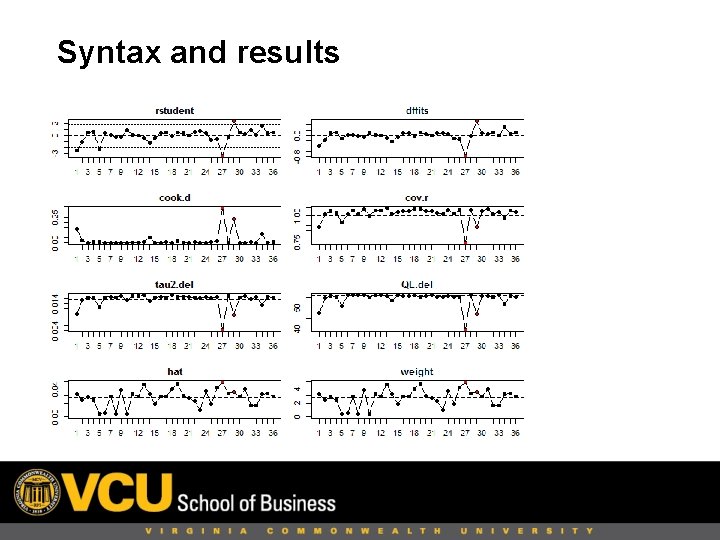
Syntax and results ### now we look for outliers ### get outlier and influential case diagnostics inf <- influence(ma. result) inf # note how observations 27 and 29 have an asterisk next to them. This indicates that they are influential cases (i. e. , outliers) ### Plot the diagnostics plot(inf)
Syntax and results
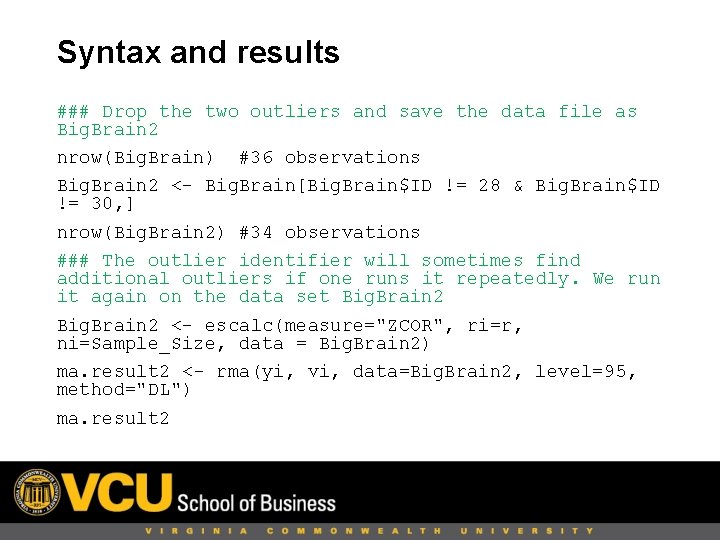
Syntax and results ### Drop the two outliers and save the data file as Big. Brain 2 nrow(Big. Brain) #36 observations Big. Brain 2 <- Big. Brain[Big. Brain$ID != 28 & Big. Brain$ID != 30, ] nrow(Big. Brain 2) #34 observations ### The outlier identifier will sometimes find additional outliers if one runs it repeatedly. We run it again on the data set Big. Brain 2 <- escalc(measure="ZCOR", ri=r, ni=Sample_Size, data = Big. Brain 2) ma. result 2 <- rma(yi, vi, data=Big. Brain 2, level=95, method="DL") ma. result 2
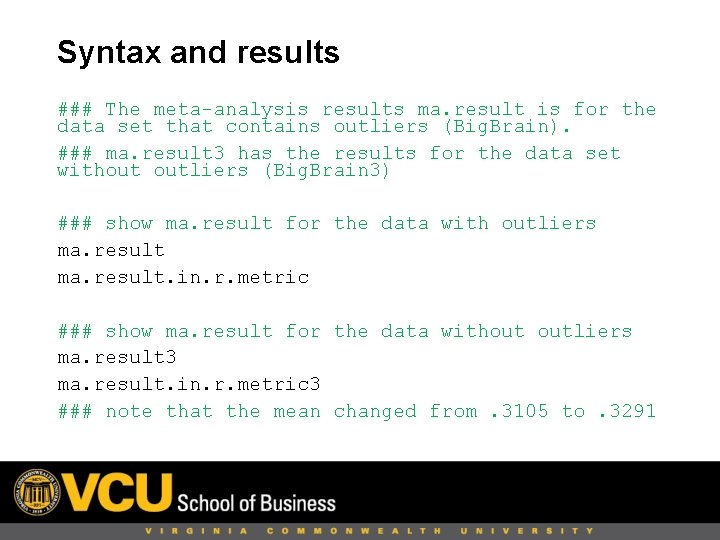
Syntax and results ### The meta-analysis results ma. result is for the data set that contains outliers (Big. Brain). ### ma. result 3 has the results for the data set without outliers (Big. Brain 3) ### show ma. result for the data with outliers ma. result. in. r. metric ### show ma. result for the data without outliers ma. result 3 ma. result. in. r. metric 3 ### note that the mean changed from. 3105 to. 3291
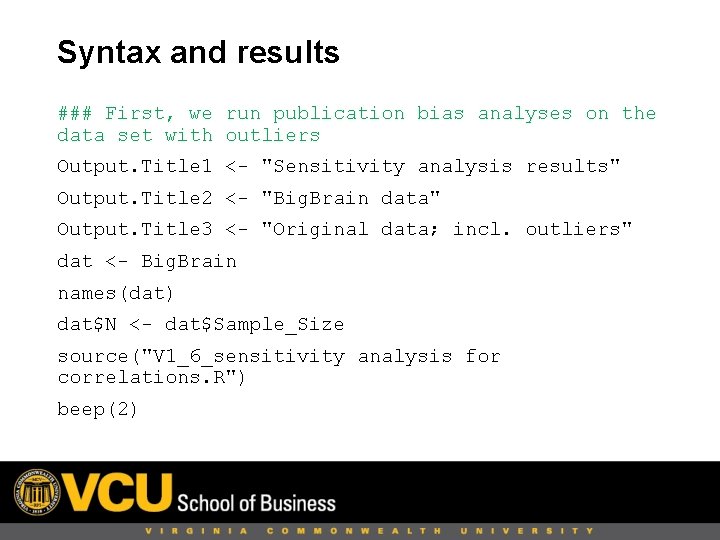
Syntax and results ### First, we run publication bias analyses on the data set with outliers Output. Title 1 <- "Sensitivity analysis results" Output. Title 2 <- "Big. Brain data" Output. Title 3 <- "Original data; incl. outliers" dat <- Big. Brain names(dat) dat$N <- dat$Sample_Size source("V 1_6_sensitivity analysis for correlations. R") beep(2)
Results (original data; incl. outliers)
Results (original data; incl. outliers)
Results (original data; incl. outliers)
Results (original data; incl. outliers) • Contour-enhanced funnel plot:
Results (original data; incl. outliers) • Cumulative meta-analysis by precision:
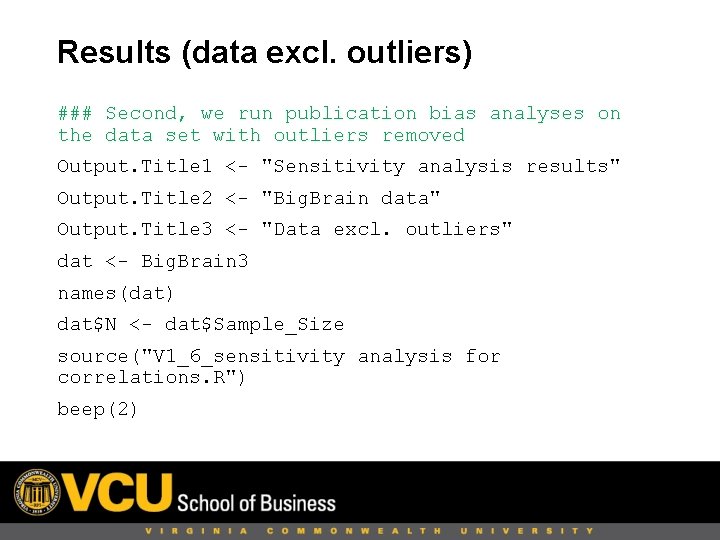
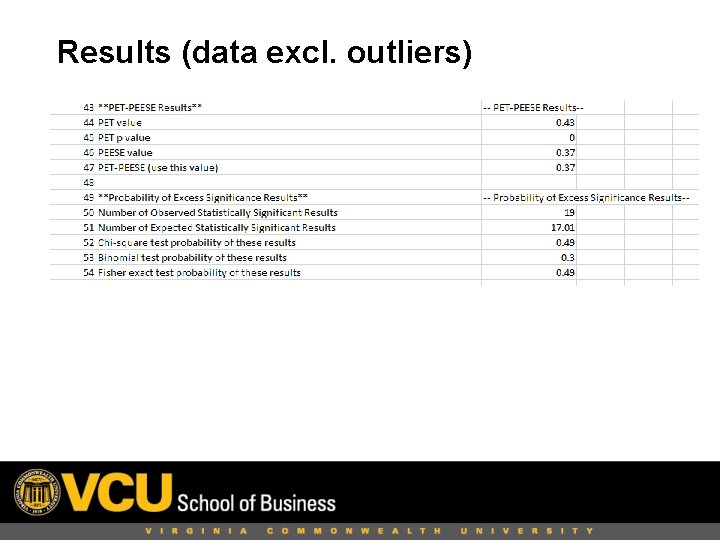
Results (data excl. outliers) ### Second, we run publication bias analyses on the data set with outliers removed Output. Title 1 <- "Sensitivity analysis results" Output. Title 2 <- "Big. Brain data" Output. Title 3 <- "Data excl. outliers" dat <- Big. Brain 3 names(dat) dat$N <- dat$Sample_Size source("V 1_6_sensitivity analysis for correlations. R") beep(2)
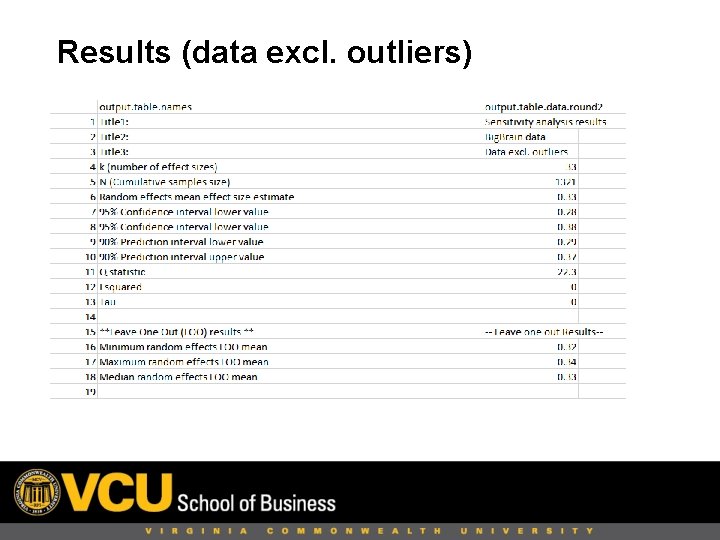
Results (data excl. outliers)
Results (data excl. outliers)
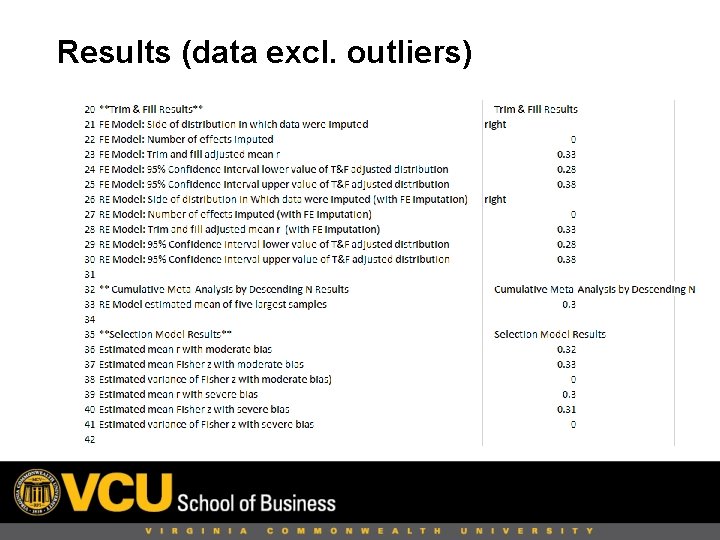
Results (data excl. outliers)
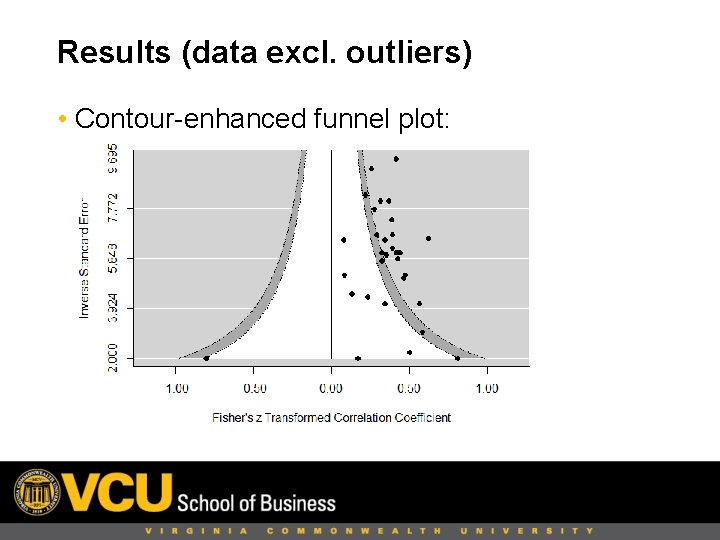
Results (data excl. outliers) • Contour-enhanced funnel plot:
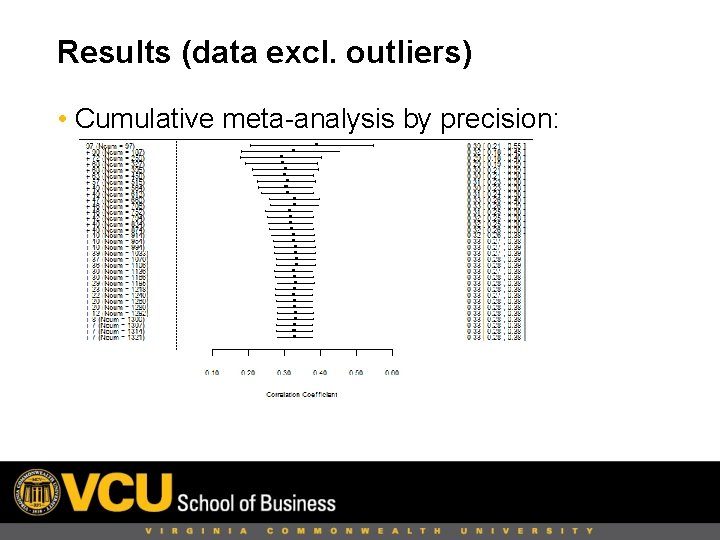
Results (data excl. outliers) • Cumulative meta-analysis by precision:
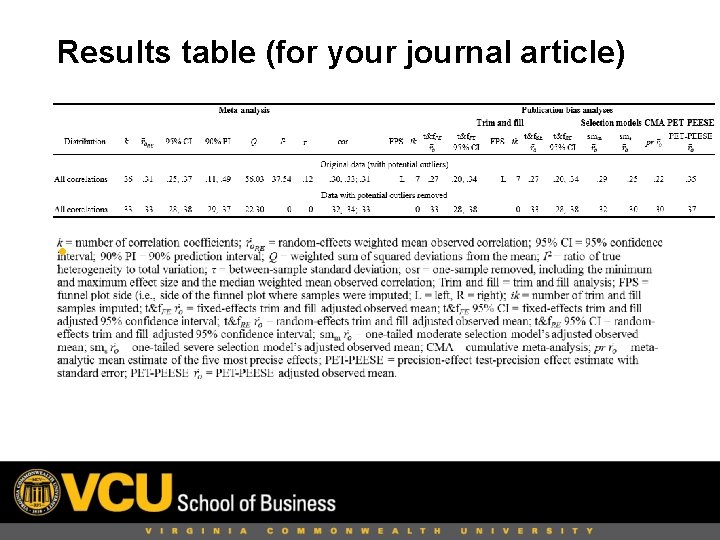
Results table (for your journal article) •
Thanks! • Questions? • Contact information: • Sven Kepes, Ph. D. Associate Professor of Management skepes@vcu. edu • Michael A. Mc. Daniel, Ph. D. Professor of Management mamcdani@vcu. edu
References Aguinis, H. , Dalton, D. R. , Bosco, F. A. , Pierce, C. A. , & Dalton, C. M. (2011). Meta-analytic choices and judgment calls: Implications for theory building and testing, obtained effect sizes, and scholarly impact. Journal of Management, 37, 5 -38. doi: 10. 1177/0149206310377113 Banks, G. C. , Kepes, S. , & Mc. Daniel, M. A. (2012). Publication bias: A call for improved meta-analytic practice in the organizational sciences. International Journal of Selection and Assessment, 20, 182 -196. doi: 10. 1111/j. 1468 -2389. 2012. 00591. x Borenstein, M. , Hedges, L. V. , Higgins, J. P. , & Rothstein, H. R. (2009). Introduction to meta-analysis. West Sussex, UK: Wiley. Duval, S. J. (2005). The “trim and fill” method. In H. R. Rothstein, A. J. Sutton & M. Borenstein (Eds. ), Publication bias in meta-analysis: Prevention, assessment, and adjustments (pp. 127 -144). West Sussex, UK: Wiley. Ferguson, C. J. , & Brannick, M. T. (2012). Publication bias in psychological science: Prevalence, methods for identifying and controlling, and implications for the use of meta-analyses. Psychological Methods, 17, 120 -128. doi: 10. 1037/a 0024445 Francis, G. (2014). The frequency of excess success for articles in Psychological Science. Psychonomic Bulletin & Review, 21, 1180 -1187. doi: 10. 3758/s 13423 -014 -0601 -x Greenhouse, J. B. , & Iyengar, S. (2009). Sensitivity analysis and diagnostics. In H. Cooper, L. V. Hedges & J. C. Valentine (Eds. ), The handbook of research synthesis and meta-analysis (2 nd ed. ). (pp. 417 -433). New York, NY: Russell Sage Foundation. Grubbs, F. E. (1969). Procedures for detecting outlying observations in samples. Technometrics, 11, 121. doi: 10. 1080/00401706. 1969. 10490657 Ioannidis, J. P. , & Trikalinos, T. A. (2007). An exploratory test for an excess of significant findings. Clinical Trials, 4, 245 -253. doi: 10. 1177/1740774507079441
References Kepes, S. , Banks, G. , C. , Mc. Daniel, M. A. , & Whetzel, D. L. (2012). Publication bias in the organizational sciences. Organizational Research Methods, 15, 624 -662. doi: 10. 1177/1094428112452760 Kepes, S. , Mc. Daniel, M. A. , Brannick, M. T. , & Banks, G. C. (2013). Meta-analytic reviews in the organizational sciences: Two meta-analytic schools on the way to MARS (the Meta-analytic Reporting Standards). Journal of Business and Psychology, 28, 123 -143. doi: 10. 1007/s 10869 -013 -9300 -2 Peters, J. L. , Sutton, A. J. , Jones, D. R. , Abrams, K. R. , & Rushton, L. (2008). Contour-enhanced metaanalysis funnel plots help distinguish publication bias from other causes of asymmetry. Journal of Clinical Epidemiology, 61, 991 -996. doi: 10. 1016/j. jclinepi. 2007. 11. 010 Stanley, T. D. , & Doucouliagos, H. (2014). Meta-regression approximations to reduce publication selection bias. Research Synthesis Methods, 5, 60 -78. doi: 10. 1002/jrsm. 1095 Vevea, J. L. , & Woods, C. M. (2005). Publication bias in research synthesis: Sensitivity analysis using a priori weight functions. Psychological Methods, 10, 428 -443. doi: 10. 1037/1082 -989 X. 10. 4. 428 Viechtbauer, W. (2015). Meta-analysis package for R: Package ‘metafor. ’ R package version 1. 9 -5 Viechtbauer, W. , & Cheung, M. W. L. (2010). Outlier and influence diagnostics for meta-analysis. Research Synthesis Methods, 1, 112 -125. doi: 10. 1002/jrsm. 11