
Semivariance Significance Baishi Wu 41608 Outline Motivation Background
Semivariance Significance Baishi Wu, 4/16/08
Outline Motivation Background Math Data Information Summary Statistics Correlation Summary Regression Summary
Introduction Want to examine predictive regressions for realized variance by using realized semi-variance as a regressor Test significance of realized semi-variance and realized up-variance by correlation with daily openclose returns Regressions are of the HAR-RV form from Corsi (2003) Semi-variance from Barndorff-Nielsen, Kinnebrock, and Shephard (2008)
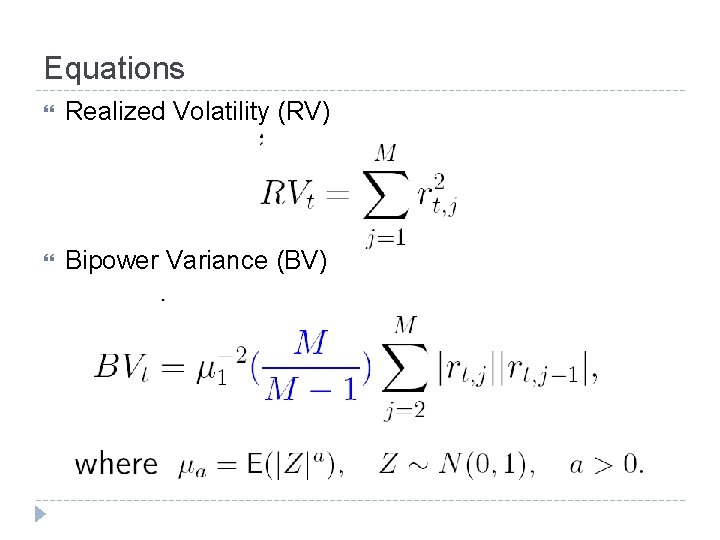
Equations Realized Volatility (RV) Bipower Variance (BV)

Equations Realized Semivariance (RS) Realized up. Variance (up. RV) up. RV = RV - RS Bipower Downard Variance (BPDV)

Equations Daily open to close returns (ri) ri = log(priceclose) – log(priceopen) The daily open to close returns are correlated with the RV, up. RV, and RS to determine whether market volatility is dependent on direction This statistic is also squared to determine if the size of the open to close price shift correlates with the magnitude of realized volatility
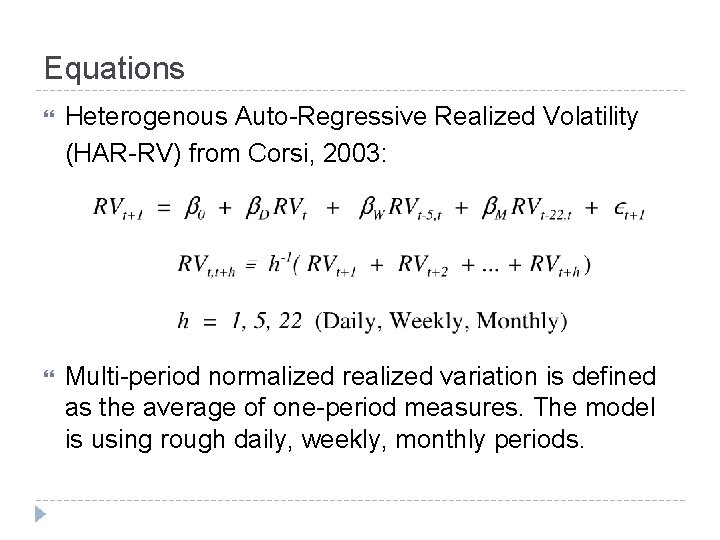
Equations Heterogenous Auto-Regressive Realized Volatility (HAR-RV) from Corsi, 2003: Multi-period normalized realized variation is defined as the average of one-period measures. The model is using rough daily, weekly, monthly periods.

Equations Extensions of HAR-RV Created different regressions using lagged RS and lagged up. RV in predicting RV creating HAR-RS and HAR-up. RV Compared to original HAR-RV model Created combined regressions of a combination of both RS and up. RV to predict RV using HAR-RSup. RV
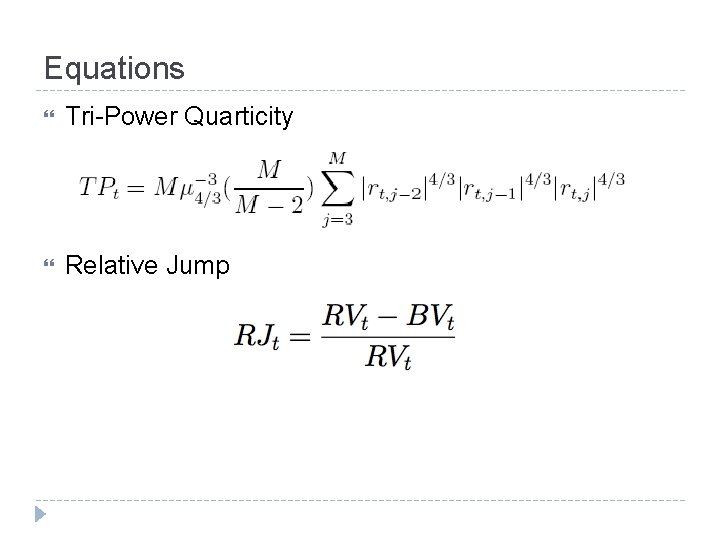
Equations Tri-Power Quarticity Relative Jump

Equations Max Version z-Statistic (Tri-Power) The max version Tri-Power z-Statistic is used to measure jumps in the data in this case Take one sided significance at. 999 level, or z = 3. 09

Data Preparation Collected at five minute intervals S&P 500 Data Set: 2000 to late 2007 (1959 Observations) Exxon Mobile Corp: 2000 to 2008 (1967 Observations) Intel Corp: 2000 to 2008 (1720 Observations) Pfizer Inc: 2000 to 2008 (1968 Observations) Allegheny Technologies Inc: 2000 to 2008 (1964 Observations) Chose different stocks to view consistency in previous conclusions as well as dissect any errors found this week

Statistical Summary x 10 -4 rd rd 2 RV up. RV RS BV BPDV ATI XOM PFE INTC SP 500 -1. 05 -3. 11 -14. 06 . 37 270. 99 128. 63 141. 69 232. 13 96. 80 7. 35 1. 65 2. 01 5. 41 0. 94 14. 96 4. 74 4. 53 10. 91 2. 27 8. 30 1. 89 2. 37 5. 64 0. 94 8. 92 2. 03 2. 85 6. 45 1. 26 4. 15 0. 94 1. 18 2. 83 0. 47 4. 88 1. 08 1. 46 3. 52 0. 71 4. 14 0. 95 1. 19 2. 81 0. 46 4. 91 1. 05 1. 56 3. 20 0. 65 6. 82 1. 80 2. 20 5. 02 0. 88 7. 21 2. 00 2. 56 6. 21 1. 20 0. 70 0. 04 0. 09 0. 15 0. 03 2. 38 0. 34 0. 63 1. 04 0. 24 -11. 89

Statistical Summary When looking at up. RV vs. RS, notice that they are approximately same in terms of mean and std Individual stocks are expectedly less volatile than the market as a whole Daily returns are negative on average

Correlations with Daily Returns RS and up. RV are much more highly correlated with daily returns than RV is upon average - positive daily returns tend to indicate greater positive returns as a whole Anticipate positive correlations of realized upvariance with daily returns, negative correlations of semi-variance Expected to see a higher correlation with semivariance and daily squared returns in order to indicate higher volatility in a down market (not the case) – price movements do not coincide with

Correlations with Daily Returns Semi-variance and realized up-variance are not better correlated with themselves (shown by earlier autocorrelations ran through correlograms) Larger daily returns in magnitude do not correlate with higher market volatility (if measured through semi-variance)

Correlations with Daily Returns corr RV up. RV RS ATI XOM PFE INTC SP 500 -0. 0773 -0. 0242 0. 0775 0. 0093 0. 0020 0. 2053 0. 2089 0. 2909 0. 2284 0. 2310 -0. 3444 -0. 2621 -0. 1311 -0. 2322 -0. 2494 PFE is unique: RV magnitude is higher than average RS magnitude is lower than average ATI is unique: RV magnitude is higher than average RS magnitude is higher than average

Combined Regressors Summary Highest R 2 values were found for the HAR-RS-up. RV regression combination of using both the semivariances and the realized-upvariances Much of this is due to the strength of the regression coefficient in the HAR-RS regression In general, semi-variance is a better predictor of RV than realized up-variance and RV itself; this indicates that the down market predicts overall volatility best

Regression Summary R 2 values ATI XOM PFE INTC SP 500 HAR-RV 0. 4426 0. 5594 0. 3938 0. 6783 0. 4965 HAR-RS 0. 4467 0. 5738 0. 3705 0. 6959 0. 5126 HAR-up. RV 0. 3807 0. 5139 0. 3952 0. 6273 0. 4389 HAR-RS-up. RV 0. 4509 0. 5732 0. 3976 0. 7040 0. 5180 PFE – seen as an exception in an earlier circumstance; unreliable low correlations? Boost in predictive power comes from up. RV XOM – HAR-RS is very comparable to HAR-RSup. RV; is this difference negligible?

F-Test Summary F stat RS up. RV ATI XOM PFE INTC SP 500 44. 45 12. 07 0. 5 26. 74 12. 31 0 0 0. 648 0 0 7. 83 0. 13 3. 57 3. 69 1. 68 0 0. 9417 0. 0135 0. 0115 0. 1698 PFE does not seem to find either RS or up. RV predictions significant Generally, the predictive power arrives from the HAR -RS regression with up. RV only stronger in a weak predictive case

A Look into Pfizer
- Slides: 20