Selecting The Ideal Option Strike Price Using Fibonacci

Selecting The Ideal Option Strike Price Using Fibonacci Part I – Oct 1 st, 2015

Warning IMPORTANT NOTICE! No representation is being made that the use of this strategy or any system or trading methodology will generate profits. Past performance is not necessarily indicative of future results. There is substantial risk of loss associated with trading securities and options on equities. Only risk capital should be used to trade. Trading securities is not suitable for everyone. Disclaimer: Futures, Options, and Currency trading all have large potential rewards, but they also have large potential risk. You must be aware of the risks and be willing to accept them in order to invest in these markets. Don’t trade with money you can’t afford to lose. This website is neither a solicitation nor an offer to Buy/Sell futures, options, or currencies. No representation is being made that any account will or is likely to achieve profits or losses similar to those discussed on this web site. The past performance of any trading system or methodology is not necessarily indicative of future results. CFTC RULE 4. 41 – HYPOTHETICAL OR SIMULATED PERFORMANCE RESULTS HAVE CERTAIN LIMITATIONS. UNLIKE AN ACTUAL PERFORMANCE RECORD, SIMULATED RESULTS DO NOT REPRESENT ACTUAL TRADING. ALSO, SINCE THE TRADES HAVE NOT BEEN EXECUTED, THE RESULTS MAY HAVE UNDER-OR-OVER COMPENSATED FOR THE IMPACT, IF ANY, OF CERTAIN MARKET FACTORS, SUCH AS LACK OF LIQUIDITY. SIMULATED TRADING PROGRAMS IN GENERAL ARE ALSO SUBJECT TO THE FACT THAT THEY ARE DESIGNED WITH THE BENEFIT OF HINDSIGHT. NO REPRESENTATION IS BEING MADE THAT ANY ACCOUNT WILL OR IS LIKELY TO ACHIEVE PROFIT OR LOSSES SIMILAR TO THOSE SHOWN.

“God does not play dice with the universe. ” - Albert Einstein

The Growth Ratio • Helps to understand seemingly random occurrences, such as social progress. Social progress is NOT random, but unquestionably patterned. • Social progress determines market performance • Neither social progress or market performance are random • Recurring growth ratio and patterns consistently observed in both

FIBONACCI RATIOS 0. 382 0. 618 squared 0. 500 2 nd N / 3 rd N 0. 618 Inverse of Golden Ratio 0. 707 Square root of 2 0. 786 Square root of 0. 618 1. 000 1. 618 x 0. 618 1. 272 Square root of 1. 618 Golden Ratio (Phi) 2. 000 1 st N x 2 nd N 2. 618 1. 618 squared

Fibonacci Ratio Analysis The Answer To “HOW MUCH LONGER UNTIL WE’RE THERE”

Retracements The primary goal of trading can be summed as the following: To buy weakness in rising markets and to sell strength in falling markets… Fibonacci retracements help us do just that. Rising and falling markets are determined by the slope of the 55 EMA.

55 EMA Determines The Trend Are we trying to pullbacks to a moving average? NO – that’s horseshoes and hand grenades! This is trading, baby. We need to be more precise.

Trend Identification

Retracements

Fibonacci Retracements ratio’s are used to analyze corrective Waves 38. 2% …. by measuring previous trend waves 61. 8% 100%

Fibonacci Retracements • Helps determine the completion of a CORRECTION by measuring the prior TREND wave • Serves as potential Entry levels for trades in the direction of the larger trend. Key Ratios – 23. 6% – 38. 2% – 50. 0% – 61. 8% – 78. 6%

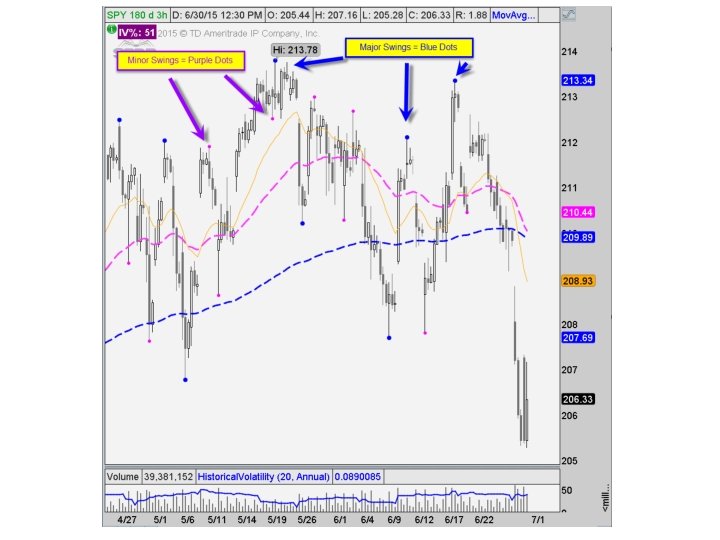
Major and Minor Swing Waves • Minor swing wave – a brief reversal in the trend that IS NOT EXCEEDED in the 5 bars prior and the 5 bars following. • Major swing wave – a significant reversal in trend that is NOT EXCEEDED in the 13 bars prior and 13 bars following.

Minor Swing Wave A brief reversal in the trend that IS NOT EXCEEDED in the 5 bars prior and the 5 bars following. Minor Swing Wave High

Major Swing Wave A significant reversal in trend that is NOT EXCEEDED in the 13 bars prior and 13 bars following. Major Swing Wave High Major Swing Wave Low

55 EMA Determines The Trend Are we trying to pullbacks to a moving average? NO – that’s horseshoes and hand grenades! This is trading, baby. We need to be more precise.

The 3 Tools of Fibonacci Analysis Retracements External Retracements Projections

Retracements The primary goal of trading can be summed as the following: To buy weakness in rising markets and to sell strength in falling markets… Fibonacci retracements help us do just that. Rising and falling markets are determined by the slope of the 55 EMA.

Retracements

Retracements – Short Crude 3 HR 1. Isolate a trend 2. Wait for the trend to exhaust itself and begin to pullback 3. Identify the most recent MAJOR swing wave low. Use the lowest swing wave 4. Find the most recent MAJOR swing wave high

Retracements – Short Crude 3 Hr 1. 2. 3. Identify the most recent MAJOR swing wave low and MAJOR swing wave high Using your Fibonacci retracement tool, click the higher swing wave and then the lower swing wave to draw the retracement levels Monitor the pullback looking for swing waves against your retracement levels – these serve as entries*

Retracements – Short Crude 3 Hr • Shorts -Entries occur after a 3 wave swing. – Swing wave high – Swing wave low – Swing wave high to new highs – ENTRIES – entries occur after 3 swing wave swings

Retracements – Long SBUX 1 HR 1. Isolate a trend 2. Wait for the trend to exhaust itself and begin to pullback 3. Identify the most recent MAJOR swing wave high. Use the highest swing wave 4. Find the most recent MAJOR swing wave low

Retracements – Long SBUX 1 HR 5 - Using your Fibonacci retracement tool, click the earlier swing wave and then the latter swing wave to draw the retracement levels 6 - Monitor the pullback looking for swing waves against your retracement levels – these serve as entries*

Retracements – Long SBUX 1 HR • ENTRIES – entries occur after a 3 wave swing. • LONGS – – Swing wave low – Swing wave high – Swing wave low to new lows. • A 3 -wave swing will ideally terminate between 38. 2% and 61. 8%. In certain circumstances, you will allow for 78. 6%

SBUX Trade June 16 th – Long VIA ATM CDS

SBUX Trade June 16 th – Long VIA ATM CDS

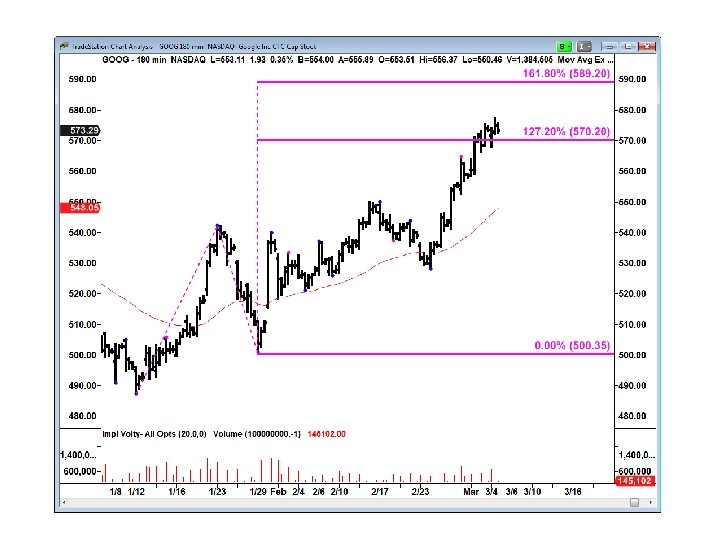
External Retracements 127. 2% 261% Ext. Ret. ratio’s are used to analyze trend waves …. by measuring previous corrective waves.

External Retracements • Helps determine the completion of a trend wave • Serves as potential Exit levels for trades in the direction of the larger trend • Serves as potential entry for contra-trend trades Key Ratios 127. 2 % 161. 8 % 200. 0 % 261. 8 % 423. 6%

External Retracements 2. 00 1. 618 1. 272 1. 00 0. 618 0. 000 Extensions for Exit 1. Identify a completed correction & anticipate a new trend wave 2. Measure corrective wave to define extension levels 3. Watch for the end of correction for entry

External Retracements Quick Tip You are going to use the retracement tool for this study. It’s simply a retracement that is more than 100%

External Retracements Quick Tip Below the 100% is retracement territory. Above 100% is extension territory

External Retracements

External Retracements

External Retracements

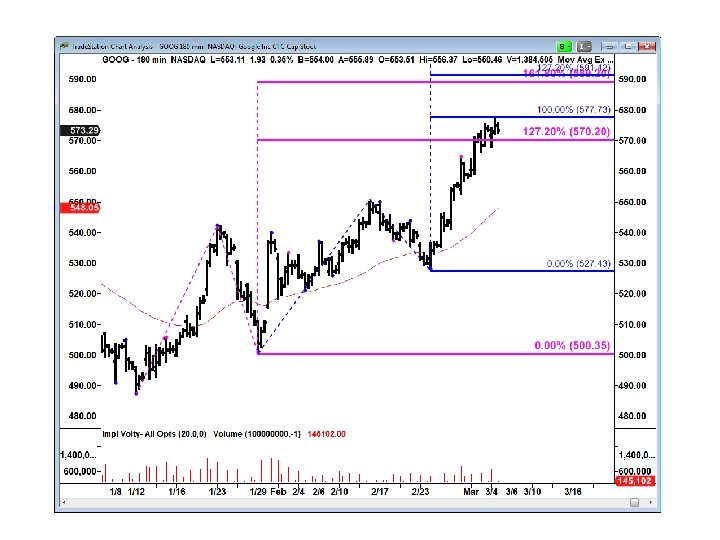
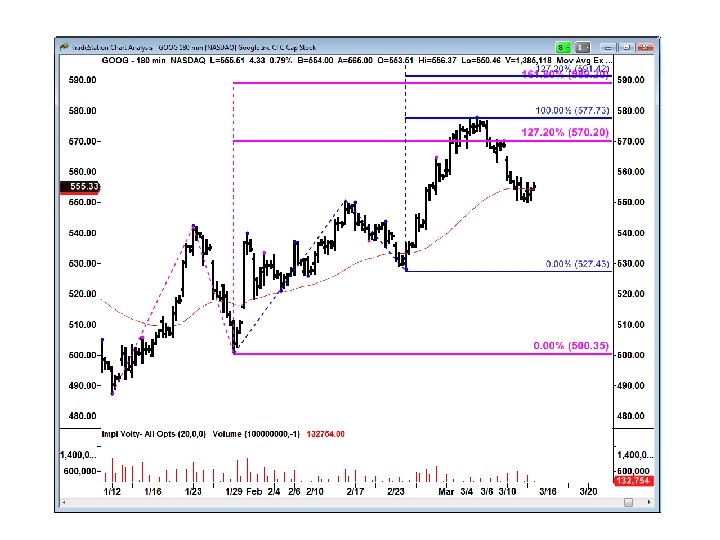
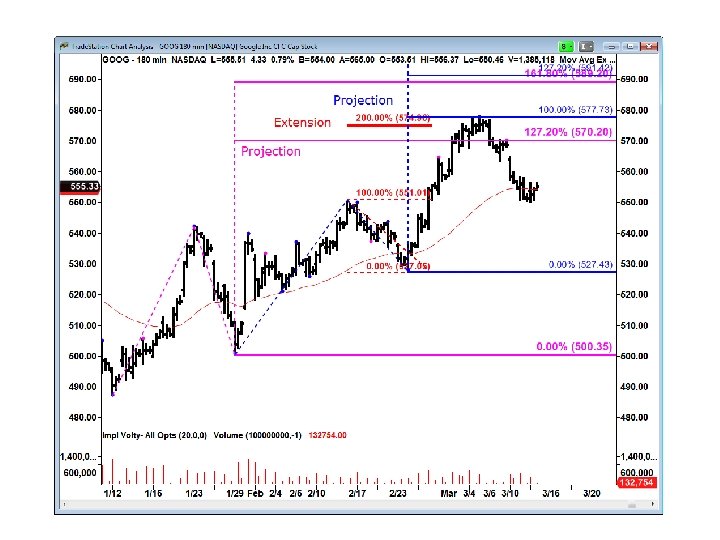
Fibonacci Projections 200% Projections are used to measure trend waves …. by measuring previous trend & corrective waves.

Fibonacci projections 1. 618 1. 000 0. 618 5 Click 2 B 3 1 4 2 Click 1 A Click 3 C 0. 000 projections for Exit 1. Identify a completed trend & Correction & anticipate a new 5 -wave trend. 2. Measure (click) the 3 end points of the trend & Corrective Wave. 3. Watch for the end of the trend wave at projections ratios for exit.

Projections – Crude Oil

Projections – Crude Oil

End of PART 1 – Oct 1 st, 2015 Fibonacci Strategies For Trading Options

• PICKUP SLIDE
- Slides: 46