
Seismic Data Quality Control Rick Benson IRIS DMC
Seismic Data Quality Control Rick Benson IRIS DMC October 21 -26, 2007 Data Management Workshop Kuala Lumpur, Malaysia
Why Routine Quality Control ? The sooner problems are detected the sooner they can be fixed • • Sensor malfunctions, misconfigurations, aging Digitizer & recorder malfunctions Vault problems: tilting, settling, etc Cable & connection problems Telemetry issues Timing problems Many, many other potential issues October 21 -26, 2007 Data Management Workshop Kuala Lumpur, Malaysia

QC at the IRIS-DMC The Challenge: A small number of analysts tasked to perform QC on hundreds of stations and thousands of channels (without routine event review). The Solution: Minimize manual analyst work (obviously) by automating as many measurements and monitoring systems as possible and making manual analysis as efficient as possible. October 21 -26, 2007 Data Management Workshop Kuala Lumpur, Malaysia
Manual QC at the DMC • Visual review of raw data for selected events and, importantly, selections with no events • Visual review of filtered (e. g. 30 -300 seconds) data where sensor problems can sometimes be detected before they are evident in the unfiltered data • Polarity checks using large events and the quadrant method • Check residuals between reviewed phase picks and predicted arrivals for gross time or location errors • Review of measurements and alerts from automated systems • Etc. October 21 -26, 2007 Data Management Workshop Kuala Lumpur, Malaysia
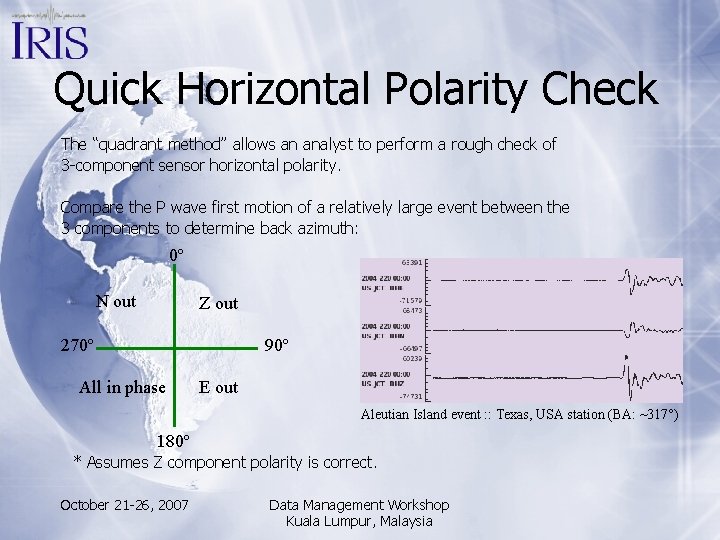
Quick Horizontal Polarity Check The “quadrant method” allows an analyst to perform a rough check of 3 -component sensor horizontal polarity. Compare the P wave first motion of a relatively large event between the 3 components to determine back azimuth: 0º N out Z out 270º 90º All in phase E out Aleutian Island event : : Texas, USA station (BA: ~317°) 180º * Assumes Z component polarity is correct. October 21 -26, 2007 Data Management Workshop Kuala Lumpur, Malaysia
Automated QC at the DMC Quality Analysis Control Kit (QUACK) • Automated QC measurements for incoming real-time data at the DMC • Tracks a number of simple parameters (signal RMS, mean, gaps, overlaps, etc. ) in addition to more complicated analyses (PSD/PDF, STA/LTA) • Generates daily reports, using thresholds to control what information is included in the report in order to reduce the number of issues that need attention October 21 -26, 2007 Data Management Workshop Kuala Lumpur, Malaysia
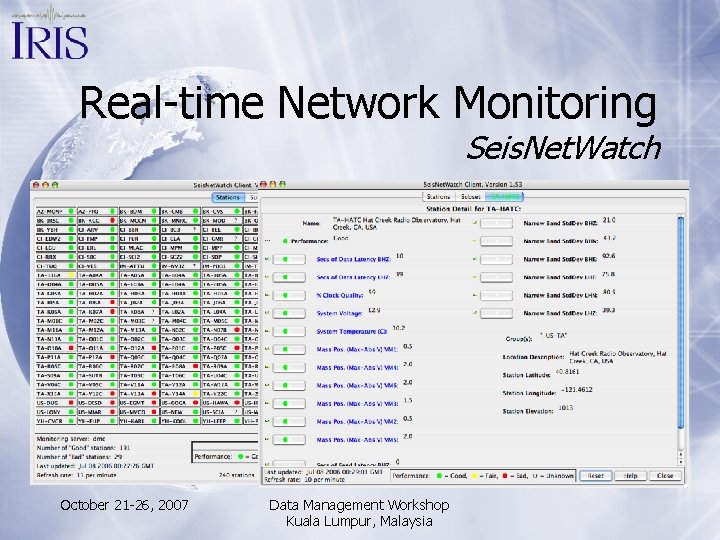
Real-time Network Monitoring Seis. Net. Watch October 21 -26, 2007 Data Management Workshop Kuala Lumpur, Malaysia

Seis. Net. Watch Details • Monitors multiple parameters in real-time from a station and combines them with user determined thresholds into an overall station performance • Open-source software available from http: //www. isti. com/ Seis. Net. Watch parameters monitored at the DMC: • Data & feed latency, mass position, clock quality, voltage & temperature • Narrow band dead channel detection (bandpass filter incoming data segments to select ~6 second microseisms and calculate standard deviation) October 21 -26, 2007 Data Management Workshop Kuala Lumpur, Malaysia
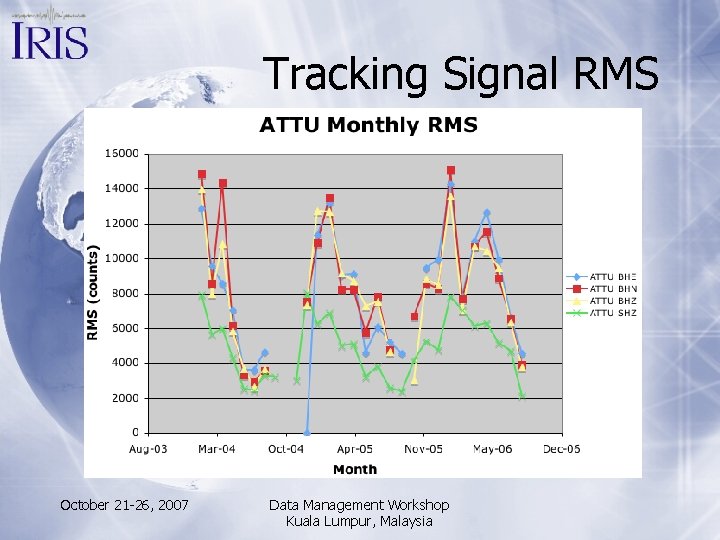
Tracking Signal RMS October 21 -26, 2007 Data Management Workshop Kuala Lumpur, Malaysia
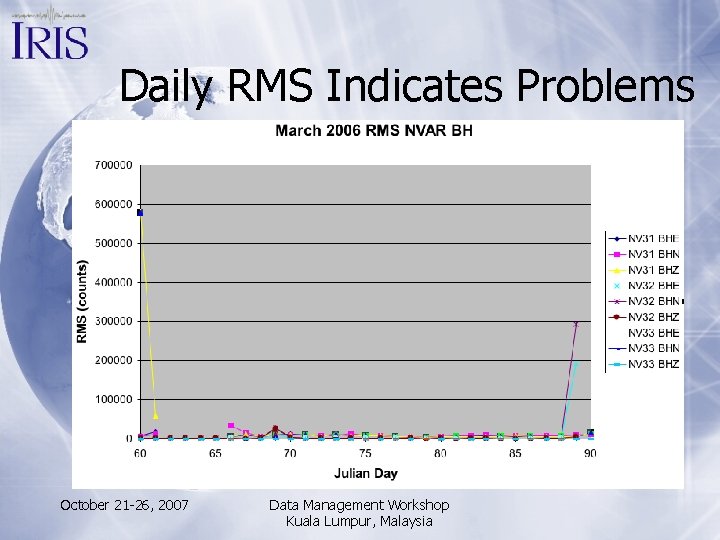
Daily RMS Indicates Problems October 21 -26, 2007 Data Management Workshop Kuala Lumpur, Malaysia
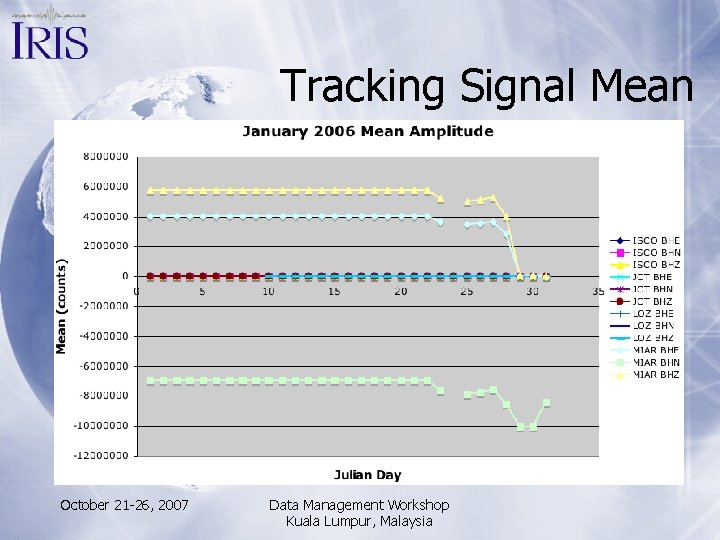
Tracking Signal Mean October 21 -26, 2007 Data Management Workshop Kuala Lumpur, Malaysia
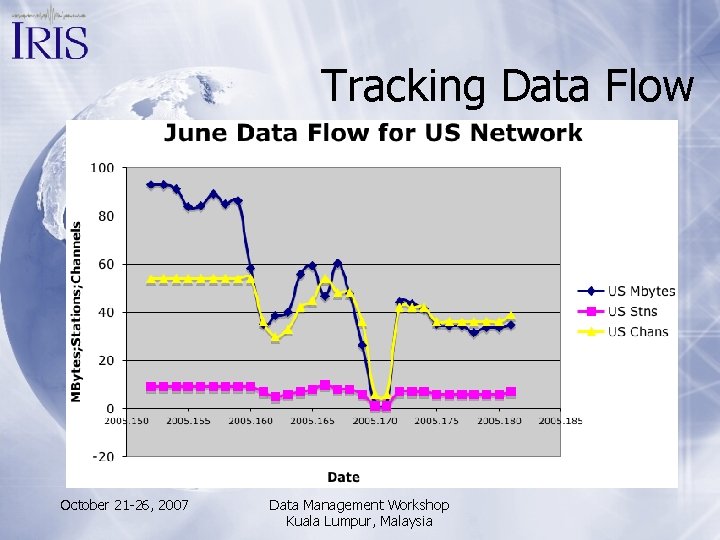
Tracking Data Flow October 21 -26, 2007 Data Management Workshop Kuala Lumpur, Malaysia
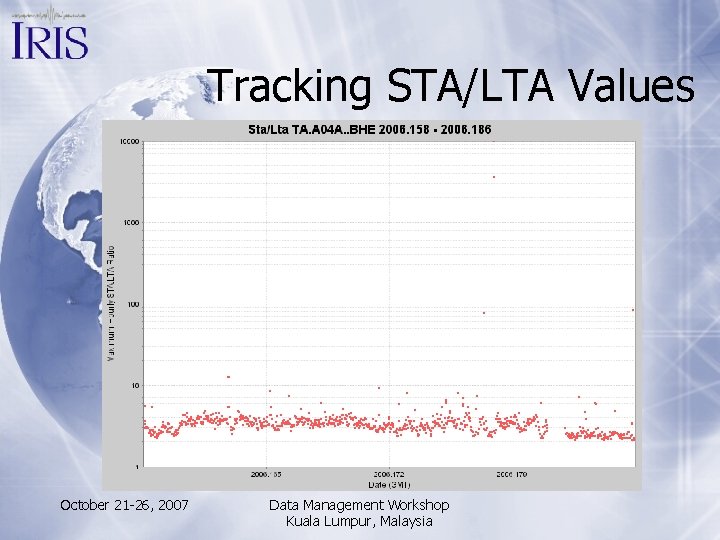
Tracking STA/LTA Values October 21 -26, 2007 Data Management Workshop Kuala Lumpur, Malaysia
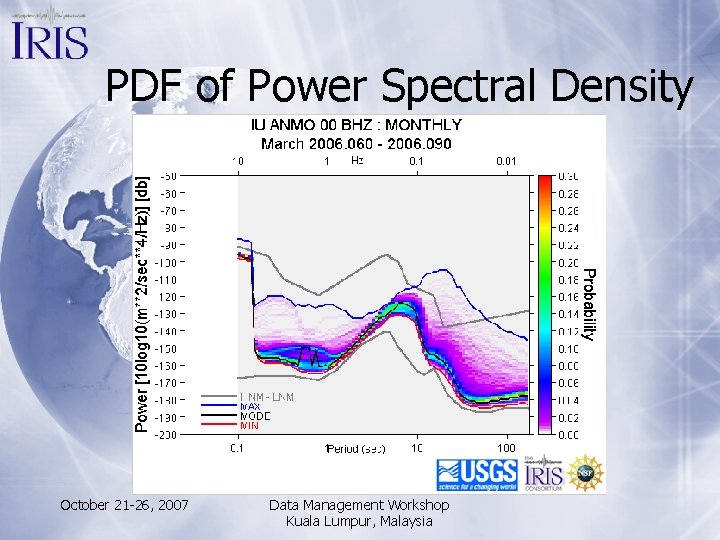
PDF of Power Spectral Density October 21 -26, 2007 Data Management Workshop Kuala Lumpur, Malaysia
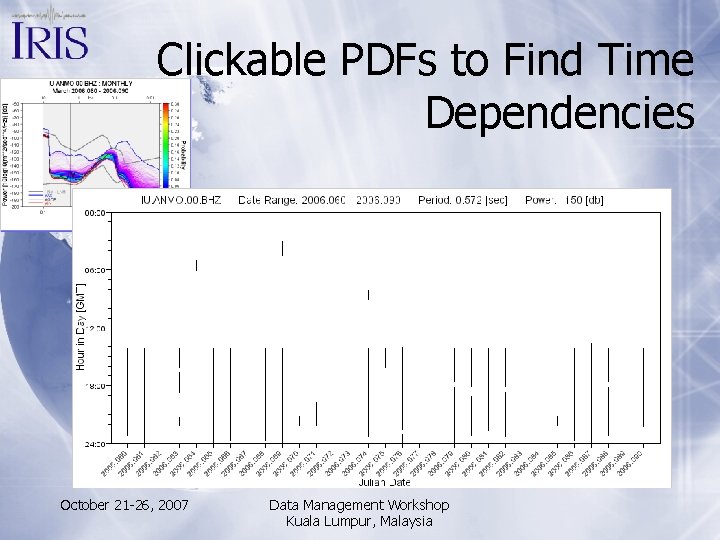
Clickable PDFs to Find Time Dependencies October 21 -26, 2007 Data Management Workshop Kuala Lumpur, Malaysia
PDF Calculation • Current implementations require Mini-SEED and SEED (RESP) system response information • PDF calculation available in the new PQLX analysis package • An older stand-alone PDF package is available: http: //geohazards. cr. usgs. gov/staffweb/mcnamara/S oftware/PDFSA. html • PDFs calculated daily for real-time data received at the IRIS-DMC, stored in database October 21 -26, 2007 Data Management Workshop Kuala Lumpur, Malaysia
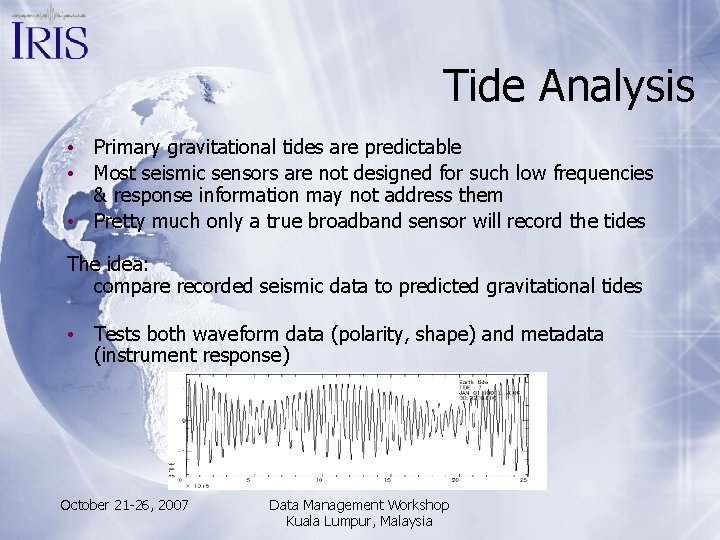
Tide Analysis • Primary gravitational tides are predictable • Most seismic sensors are not designed for such low frequencies & response information may not address them • Pretty much only a true broadband sensor will record the tides The idea: compare recorded seismic data to predicted gravitational tides • Tests both waveform data (polarity, shape) and metadata (instrument response) October 21 -26, 2007 Data Management Workshop Kuala Lumpur, Malaysia
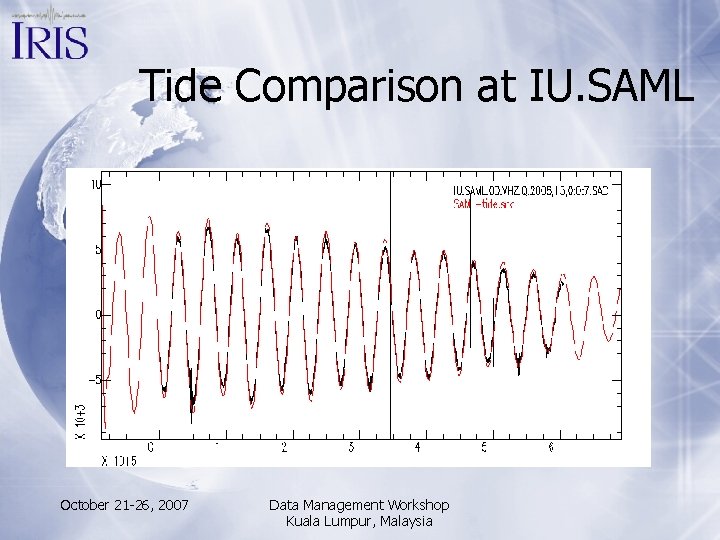
Tide Comparison at IU. SAML October 21 -26, 2007 Data Management Workshop Kuala Lumpur, Malaysia
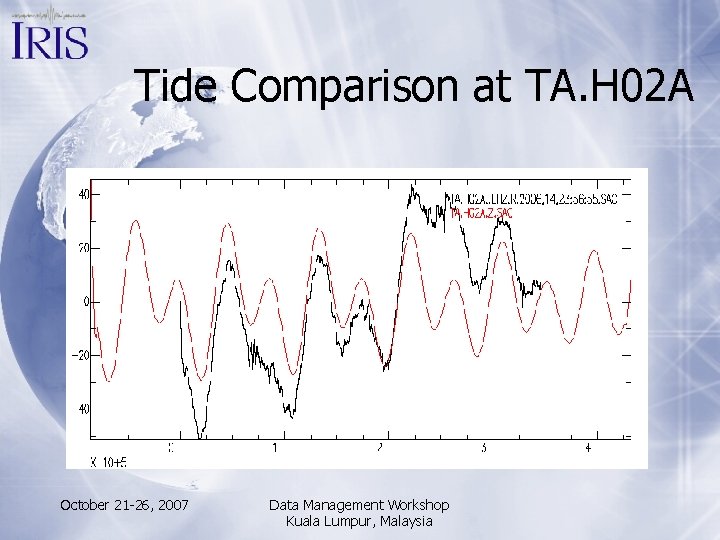
Tide Comparison at TA. H 02 A October 21 -26, 2007 Data Management Workshop Kuala Lumpur, Malaysia
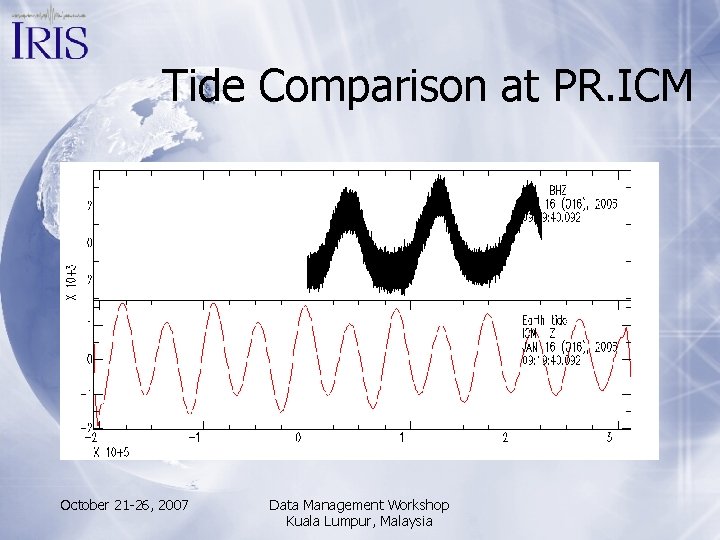
Tide Comparison at PR. ICM October 21 -26, 2007 Data Management Workshop Kuala Lumpur, Malaysia
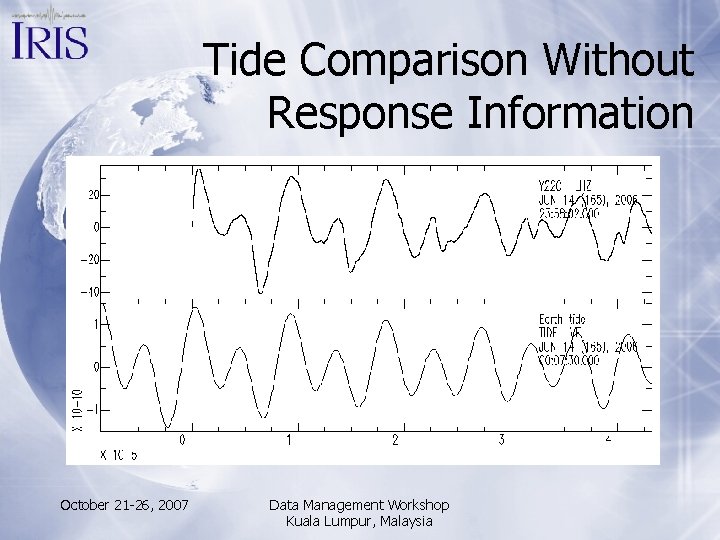
Tide Comparison Without Response Information October 21 -26, 2007 Data Management Workshop Kuala Lumpur, Malaysia
Tide Prediction Software • syntides - Synthetic Earth Gravity Tides (IRIS-DMC) • Output: Mini-SEED, SAC or ASCII tide synthetics • Convolves instrument response (SAC format) • Tide calculation a port of the SPOTL ‘ertid’ program • SPOTL - Some Programs for Ocean-Tide Loading • Output: ASCII text • Includes software to calculate solid earth gravity tide, ocean loading components, etc. • Written by Duncan Agnew, UCSD October 21 -26, 2007 Data Management Workshop Kuala Lumpur, Malaysia

SEED Metadata Verfication verseed - verifies base SEED data structure and formatting (IRIS-DMC) • Works with full SEED, dataless and Mini-SEED combined with dataless SEED (verseed -a) • Includes multiple levels (1 -4) of diagnostic information • Basic metadata verification but not response evaluation • C program that runs on Solaris, Linux and Mac OSX October 21 -26, 2007 Data Management Workshop Kuala Lumpur, Malaysia
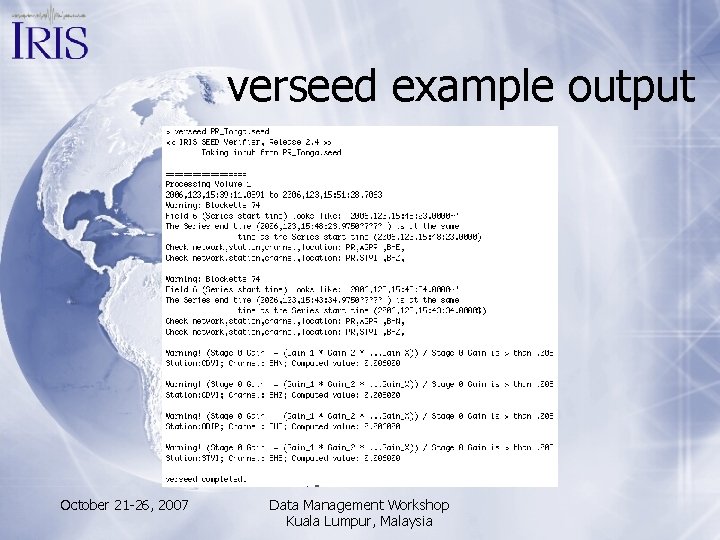
verseed example output October 21 -26, 2007 Data Management Workshop Kuala Lumpur, Malaysia
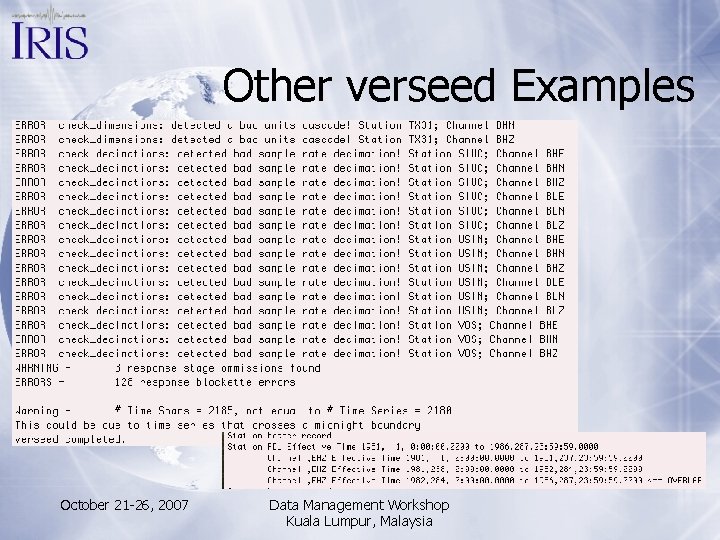
Other verseed Examples October 21 -26, 2007 Data Management Workshop Kuala Lumpur, Malaysia
SEED Response Evaluation evalresp - evaluates system amplitude and phase response using SEED RESP format. C program that runs on Solaris, Linux & Mac OSX. JEval. Resp - Java version of evalresp, runs anywhere Java is available. Reads either SEED RESP format or fetches response information from a DHI server. JPlot. Resp - evaluates and plots system amplitude and phase response using SEED RESP format. Reads either SEED RESP format or fetches response information from a DHI server. October 21 -26, 2007 Data Management Workshop Kuala Lumpur, Malaysia
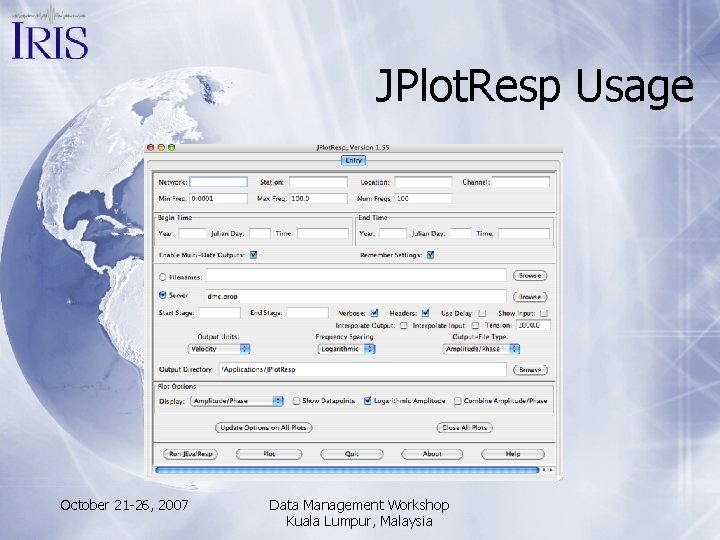
JPlot. Resp Usage October 21 -26, 2007 Data Management Workshop Kuala Lumpur, Malaysia
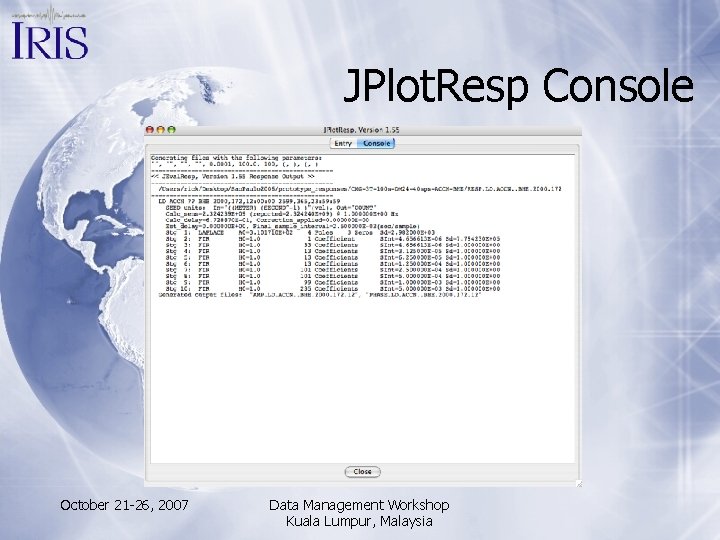
JPlot. Resp Console October 21 -26, 2007 Data Management Workshop Kuala Lumpur, Malaysia
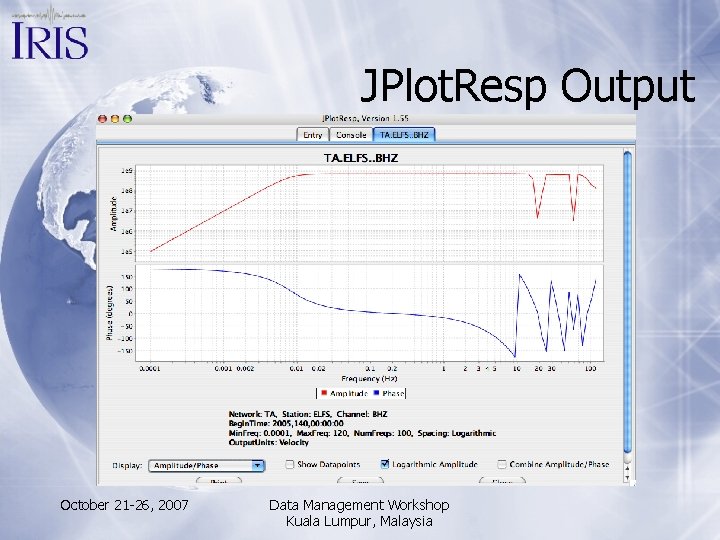
JPlot. Resp Output October 21 -26, 2007 Data Management Workshop Kuala Lumpur, Malaysia
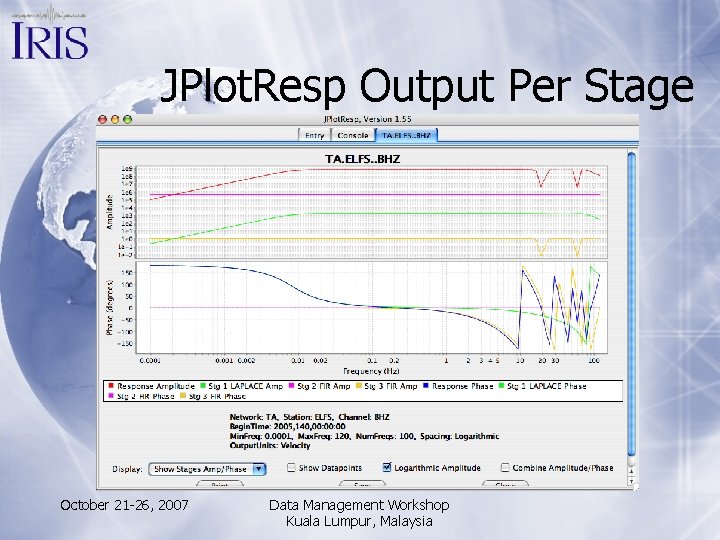
JPlot. Resp Output Per Stage October 21 -26, 2007 Data Management Workshop Kuala Lumpur, Malaysia
Other Quality Control Resources • QC Forum collaborative web site: http: //www. iris. edu/QCForum • General use QC mailing list: qc-issues@iris. washington. edu • New Manual of Seismological Observatory Practice (NMSOP) from IASPEI: http: //www. gfz-potsdam. de/bib/nmsop_formular. html • PQLX data analysis system (waveforms & PDFs): http: //geohazards. cr. usgs. gov/staffweb/mcnamara/Software/PQLX. html October 21 -26, 2007 Data Management Workshop Kuala Lumpur, Malaysia
- Slides: 31