Secular stagnation and growth in EU periphery and
 Ivana Prica")


 4. 0 3. 0 2. 0")


 = b(o) + b(1) * G")

![Autonomous growth potential [b(0)] Germany Italy Denmark Finland Estonia Sweden Portugal France Netherlands Austria](https://slidetodoc.com/presentation_image_h/19ef2b8a362468d7257d7fb7487b6c2f/image-12.jpg "Autonomous growth potential [b(0)] Germany Italy Denmark Finland Estonia Sweden Portugal France Netherlands Austria")
![Growth dependency on EU-27 market [b(1)] Greece Poland Portugal Macedonia Spain Serbia Belgium France](https://slidetodoc.com/presentation_image_h/19ef2b8a362468d7257d7fb7487b6c2f/image-13.jpg "Growth dependency on EU-27 market [b(1)] Greece Poland Portugal Macedonia Spain Serbia Belgium France")
![Impact of the crisis on growth [b(2)] Greece Croatia Romania Bulgaria Serbia Slovenia Montenegro](https://slidetodoc.com/presentation_image_h/19ef2b8a362468d7257d7fb7487b6c2f/image-14.jpg "Impact of the crisis on growth [b(2)] Greece Croatia Romania Bulgaria Serbia Slovenia Montenegro")

-periphery • Structural reforms: – Reducing labour rights • Only UK")


 100% 90% 80% 70%")


- Slides: 56
Secular stagnation and growth in EU periphery and super-periphery Will Bartlett (LSE) Ivana Prica (Faculty of Economics, Belgrade)
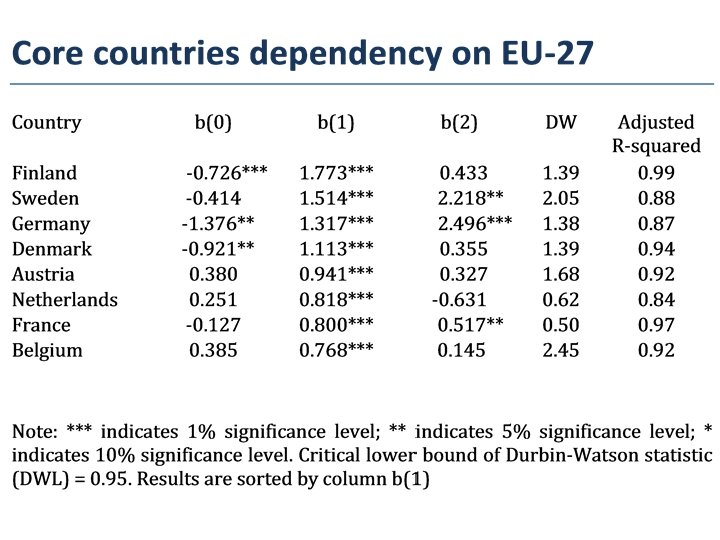
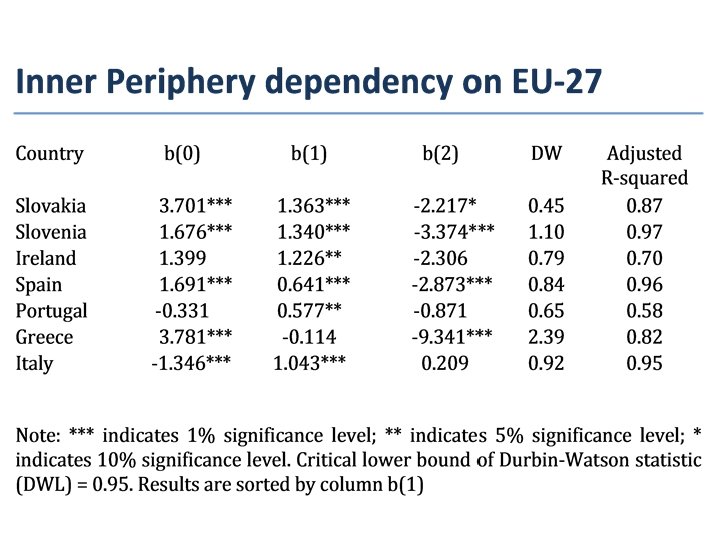
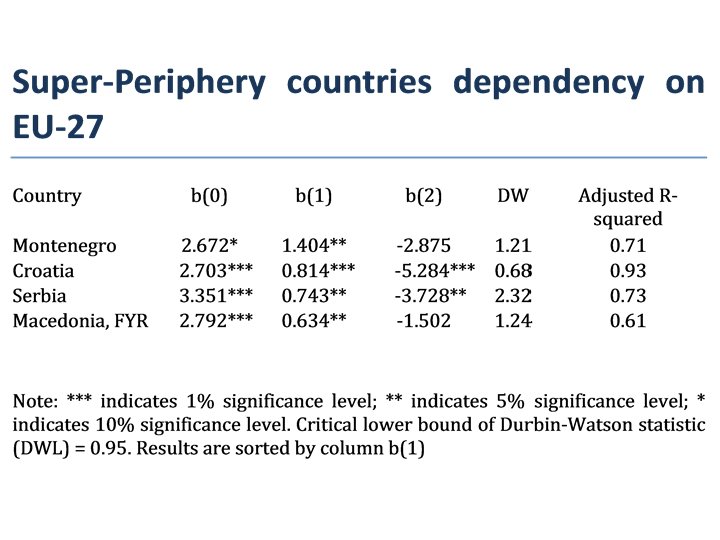
Core, periphery and super-periphery • Eurozone crisis as a structural imbalance between core and periphery countries – Germany at centre of “core” group of countries – Greece, Italy, Portugal and Spain as “inner periphery” – Western Balkans as “super-periphery” (Martin Sokol, 2001)
Spillover of the Eurozone crisis • The SEE countries have suffered from the spillover effects of the eurozone crisis • Just like the EU periphery, they cannot devalue their way out of recession due to euroisation – But bailouts are unavailable to these countries except through IMF stand-by arrangements which impose austerity programmes – Therefore, the only option is internal devaluation and structural reform
Secular stagnation • Insufficient sources of aggregate demand • Escaping stagnation – Government expenditure – Exports and competitiveness – Financialisation • Eurozone core and periphery – Structural imbalances of the eurozone • Western Balkans as super-periphery
Secular stagnation trend in EU-28 (real GDP %) 4. 0 3. 0 2. 0 1. 0 0. 0 -1. 0 -2. 0 -3. 0 -4. 0 -5. 0 2005 2006 2007 2008 2009 2010 2011 2012 2013 2014
Core and periphery • Eurozone core-periphery model • “Core” growth is propelled by exports to the EU – Generates trade surplus in the core countries • “Peripheral” countries act as consumers of corecountry exports – Generates trade deficits in the periphery – These deficits are financed by borrowing from banking sector in the core countries largely through sale of government bonds – These have now been largely absorbed by ECB and ESFS, communalising the debt
Unstable equilibrium • This is an unstable equilibrium as debts in the periphery grow ever higher and eventually cannot be financed – The periphery cannot export its way out of debt through devaluation, due to the fixed currency – The only alternatives are (a) bailouts or (b) internal devaluation through cutting unit labour costs and government expenditure (i. e. austerity programmes) – But austerity leads to a further drop in aggregate domestic demand prolongation of the recession
Core-periphery model
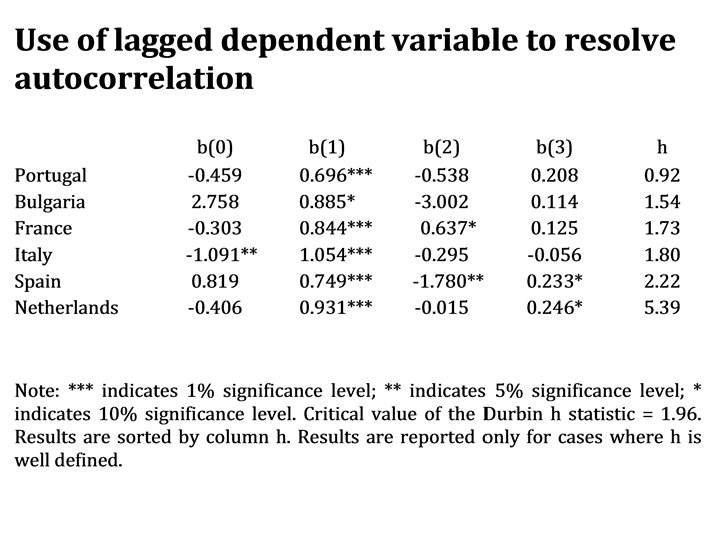
Empirical evidence - Growth dependency between core and periphery • Hypothesis: growth in the periphery is dependent on the growth in the core, and vice versa • Without the demand for exports from the periphery, the core would be subjected to secular stagnation • Without financial transfer from the core, the periphery would be subject to unsustainable balance of payments crises • Research question: – To what extent are the core, periphery and superperiphery dependent on each other?
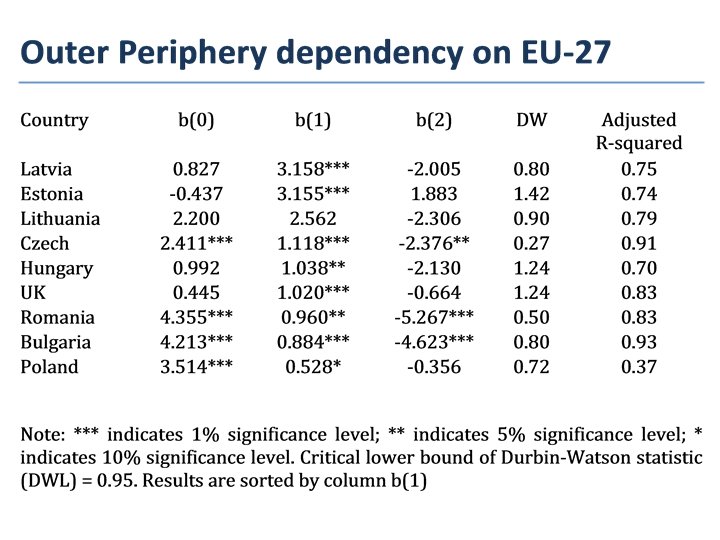
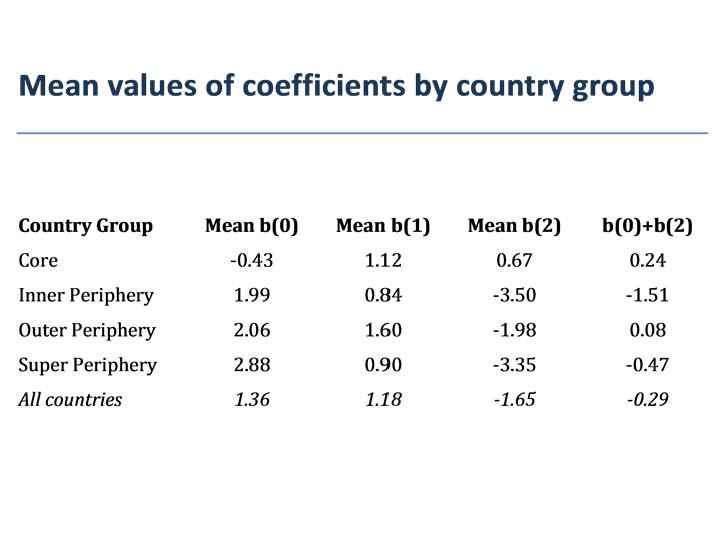
Core-periphery dependency model • Model: – G (cit) = b(o) + b(1) * G (EU 27 t) + b(2) * Crisis dummy (cit) + ε (cit) • Where – b(0) represents autonomous growth capacity – b(1) represents dependency on EU-27 – b(2) represents the effect of the crisis on autonomous growth • Data are taken from Eurostat
Country groups • We divide countries into four groups: – Core countries – EU Periphery countries within the Eurozone (Inner Periphery) – EU Periphery countries outside the Eurozone within the EU (Outer Periphery) – Super Periphery countries outside the Eurozone and the EU but with currencies tied to the Euro
Autonomous growth potential [b(0)] Germany Italy Denmark Finland Estonia Sweden Portugal France Netherlands Austria Belgium UK Latvia Hungary Ireland Slovenia Spain Lithuania Czech Montenegro Croatia Macedonia Serbia Poland Slovakia Greece Bulgaria Romania -2. 00 -1. 38 -1. 35 -0. 92 -0. 73 -0. 44 -0. 41 -0. 33 -0. 13 -1. 00 0. 25 0. 38 0. 39 0. 45 0. 00 0. 83 0. 99 1. 00 1. 40 1. 68 1. 69 2. 00 2. 20 2. 41 2. 67 - Montenegro 2. 70 - Croatia 2. 79 - Macedonia 3. 35 - Serbia 3. 51 3. 70 3. 78 4. 21 - Bulgaria 4. 36 - Romania 3. 00 4. 00 5. 00
Growth dependency on EU-27 market [b(1)] Greece Poland Portugal Macedonia Spain Serbia Belgium France Croatia Netherlands Bulgaria Austria Romania UK Hungary Italy Denmark Czech Ireland Germany Slovenia Slovakia Montenegro Sweden Finland Lithuania Estonia Latvia -0. 1 -0. 5 0. 6 - Macedonia 0. 6 0. 7 - Serbia 0. 8 - Croatia 0. 8 0. 9 - Bulgaria 0. 9 1. 0 - Romania 1. 0 1. 1 1. 2 1. 3 - Germany 1. 3 1. 4 - Montenegro 1. 5 1. 8 0 0. 5 1 1. 5 2 2. 6 2. 5 3. 2 3 3. 5
Impact of the crisis on growth [b(2)] Greece Croatia Romania Bulgaria Serbia Slovenia Montenegro Spain Czech Ireland Lithuania Slovakia Hungary Latvia Macedonia Portugal UK Netherlands Poland Belgium Italy Austria Denmark Finland France Estonia Sweden Germany -9. 3 -10 -5. 3 - Croatia -5. 3 - Romania -4. 6 - Bulgaria -3. 7 - Serbia -3. 4 -2. 9 Montenegro -2. 9 -2. 4 -2. 3 -2. 2 -2. 1 -2. 0 -1. 5 - Macedonia -8 -6 -4 -2 -0. 9 -0. 7 -0. 6 -0. 4 0. 1 0. 2 0. 3 0. 4 0. 5 0 1. 9 2. 2 2. 5 2 4
Policies - stimulating the core • Despite the rhetoric of austerity and structural reform, the core countries have avoided such policies – Germany comes 28 th out of 34 countries ranked by OECD for reform progress since onset of crisis – In early stage of crisis, policy to subsidise new car purchases • More recently: – Cuts in pension age to 63 or even 61 in certain cases – Minimum wage at relatively high levels – Energiewende (Energy change) provides massive subsidies to renewable energy producers
Austerity in the (super)-periphery • Structural reforms: – Reducing labour rights • Only UK and France now have lower level of severance pay in case of redundancy than the Western Balkan countries • Further labour market reforms envisaged in Serbia – Many countries seek to reform pensions though reductions in entitlements (Bi. H, Serbia) – Most countries try to meet ambitious targets for public sector deficits (Bi. H and Macedonia down to 2% of GDP) • Cuts in public sector employment and public sector wages • Introduction of tax reforms – flat taxes now in place in several countries (Macedonia, Albania)
Effects of the crisis on inner periphery, outer periphery and super-periphery of EU
GROWTH
GDP per capita, inner periphery, EURO 26, 000 24, 000 22, 000 Italy Spain Portugal Greece 20, 000 18, 000 16, 000 14, 000 12, 000 2004 2005 2006 2007 2008 2009 2010 2011 2012 2013
10, 000 GDP per capita, outer and superperiphery, EURO 9, 000 8, 000 Romania Bulgaria Croatia Macedonia Serbia 7, 000 6, 000 5, 000 4, 000 3, 000 2004 2005 2006 2007 2008 2009 2010 2011 2012 2013
GDP per capita growth rates, inner periphery, % 10 8 6 4 2 0 Italy Spain Portugal Greece -2 -4 -6 -8 2004 2005 2006 2007 2008 2009 2010 2011 2012 2013
GDP per capita growth rates, outer and super-periphery, % 10 8 6 4 2 0 Romania Bulgaria Croatia Macedonia Serbia -2 -4 -6 -8 2004 2005 2006 2007 2008 2009 2010 2011 2012 2013
UNEMPLOYMENT, AVERAGE INCOME AND POVERTY
Unemployment rates, inner periphery, % 30 25 2008 2013 20 20 pp 12 pp 15 10 8 pp 6 pp 5 0 Italy Portugal Greece Spain
35 Unemployment rates, outer and super -periphery, % 2008 30 -5 pp 2013 4 pp 25 20 3 pp 9 pp 15 9 pp 10 8 pp 3 pp 1 pp 5 ia ia on sn ed ac M ne te on M Bo gr o ia rb Se ni a ba Al tia oa Cr ia an m Ro Bu lg a ria 0
Mean equivalised income, EURO, 2005 -2013 20, 000 18, 000 16, 000 14, 000 12, 000 10, 000 8, 000 6, 000 4, 000 2, 000 0 Italy Spain Portugal Greece Romania Bulgaria Croatia 2005 2006 2007 2008 2009 2010 2011 2012 2013
Mean and median equivalised income, EURO, 2013 18, 000 16, 000 Mean 14, 000 Median 12, 000 10, 000 8, 000 6, 000 4, 000 2, 000 ia * ed ac M Ro m on an ia ia rb Se Bu lg a ria tia oa Cr ce ee Gr ga l rtu Po ai n Sp Ita ly 0
At-risk of poverty rates at 40% of median equivalised income, 2004 -2013, % 18 16 14 12 10 8 6 4 2 0 Italy Spain Portugal Greece Romania Bulgaria Croatia* Macedonia 2004 2005 2006 2007 2008 2009 2010 2011 2012 2013
At-risk of poverty rates at 60% of median equivalised income, 2004 -2013, % 27 25 23 21 19 17 15 Italy Spain Portugal Greece Romania Bulgaria Croatia Macedonia 13 2004 2005 2006 2007 2008 2009 2010 2011 2012 2013
* ia ia on ac ed M rb Se ia an ria lg a tia oa m Ro Bu Cr ce ai n ee Gr Sp ly 25 Ita l ga rtu Po At-risk-of-poverty rates, 2013, % 30 at 40% at 60% 20 15 10 5 0
Severely materially deprived, % of total population, 2013 45 40 35 30 25 20 15 10 5 ria Bu lg a a* ni do ac e M Ro m an ia ia rb Se ce ee Gr tia oa Cr ly Ita l ga rtu Po Sp ai n 0
Severely materially deprived, % of total population, 2005 -2014 60 50 Italy Spain Portugal Greece Romania Bulgaria Croatia Macedonia Serbia 40 30 20 10 0 2005 2006 2007 2008 2009 2010 2011 2012 2013 2014
TRADE
Trade balance, goods and services, inner periphery, EURO per capita 500 0 -500 -1, 000 -1, 500 -2, 000 Italy -2, 500 Spain -3, 000 Portugal -3, 500 Greece 2004 2005 2006 2007 2008 2009 2010 2011 2012
Trade in goods, inner periphery, EURO per capita EXPORTS 7000 IMPORTS 6000 5000 4000 2012 2011 2010 Greece 2009 Portugal 2008 Spain 2007 2005 2013 2012 2011 2010 2009 2008 2007 2006 2005 2004 0 2004 1000 Italy 2006 2000 2013 3000
Trade in services, inner periphery, EURO per capita EXPORTS IMPORTS 3000 2500 Italy Spain Portugal Greece 2000 1500 1000 2013 2012 2011 2010 2009 2008 2007 2006 2005 2004 0 2004 500
Trade balance, goods and services, outer and super-periphery, EURO per capita 500 0 -500 -1, 000 -1, 500 -2, 000 -2, 500 -3, 000 Romania Bulgaria Croatia Montenegro* Macedonia** Serbia 2004 2005 2006 2007 2008 2009 2010 2011 2012 2013
Trade in goods, outer and super-periphery, EURO per capita EXPORTS IMPORTS 6000 Romania Bulgaria 5000 Croatia Montenegro Macedonia Serbia* 4000 3000 2000 1000 2013 2012 2011 2010 2009 2008 2007 2006 2005 2004 0
Trade in services, outer and superperiphery, EURO per capita IMPORTS EXPORTS 2500 2000 Romania Bulgaria Croatia Montenegro Macedonia Serbia 1500 1000 500 2013 2012 2011 2010 2009 2008 2007 2006 2005 2004 0
Exports as % GDP, p. p. difference between 2012 and 2008 12 services 10 goods 8 6 4 2 0 -2 ia rb Se ia on ed ac M M on te ne gr o tia oa Cr ria Bu lg a ia an Ro m ce Gr ee l ga rtu Po ai n Sp Ita ly -4
NON-PERFORMING LOANS AND FOREIGN BANK OWNERSHIP
Financialisation in the Western Balkans • Takeover of domestic banking system by foreign (mainly EU) banks – Took place between 2000 and 2005 • Less sophisticated banking system than in the core – Inflow of foreign capital • Led to rapid credit growth – Widespread euroisation • Both among households and companies
Share of banks assets under foreign ownership, 1998 -2011 (%) 100% 90% 80% 70% 60% 50% 40% 30% 20% 10% Albania Bi. H Croatia Macedonia Montenegro Serbia 0% 1998 1999 2000 2001 2002 2003 2004 2005 2006 2007 2008 2009 2010 2011
NPLs, % of total bank loans, 20042014, inner periphery 35 Portugal 30 Spain 25 Italy 20 Greece 15 10 5 0 2004 2005 2006 2007 2008 2009 2010 2011 2012 2013 2014
NPLs, % of total bank loans, 2006 -2014, outer and super-periphery 25 20 Macedonia Croatia Bulgaria Serbia Bosnia Montenegro Romania Albania 15 10 5 0 2006 2007 2008 2009 2010 2011 2012 2013 2014
Policy Responses
IFI policy responses • 2009 - IMF Stand-By Arrangements – € 3. 5 bn Romania; € 1. 1 bn Bi. H; € 402. 5 m Serbia • "Vienna Initiative" – IFIs provide € 24. 5 bn loans to 17 foreign parent banks of banks operating CEE/SEE region • “Vienna Plus”agreement – to encourage substitution of foreign borrowing by local currency borrowing – More efficient absorption of EU structural funds • But no further support is available – Eurozone banks are focused on building core domestic capital and have been “deleveraging” from the Western Balkans – In 2012, for example, Bulgaria, Croatia and Serbia were affected with losses from withdrawals of foreign bank funds in excess of 5 percent of GDP.
IMF Fiscal Policy recommendations 2015 Albania Fiscal consolidation through revenue measures and phasing out energy subsidies Bi. H Contain wages and benefits; improve targeting of public spending; improve revenue collection and administration Kosovo Wage and benefit moderation; improve tax compliance; shaft taxes to domestically collected ones Macedonia Fiscal consolidation embedded in a comprehensive expenditure review Montenegro Fundamental expenditure reform, including pensions and public sector wages Serbia Ambitious and sustained fiscal adjustment by cuts to public wages and pensions, reduce state aid to state-owned enterprises
Serbia • Rapid increase in budget deficit to 7% of GDP in 2013 • 2014: 10% cut in public sector wages, 22% cut in pensions between 25, 000 -40, 000 din. per month • IMF Stand by Arrangement 2015: € 1. 2 bn – "Scaling down" the pubic wage and pension bills – Reduce government employment by 5% in 2015 – Labour market reforms to reduce severance pay – Eliminate agricultural subsidies – Reduce state aid to socially owned and state owned enterprises and privatise 500 such SOEs
Teachers demonstrate in Belgrade Tuesday 16 March 2015