Section 9 3 Sample Means Sample proportions arise


- Slides: 19
Section 9. 3 Sample Means
• Sample proportions arise most often when we are interested in categorical variables – What % of adults attended church last week? – What proportion of U. S. adults have watched 24? • When we record quantitative variables we are interested in other statistics, such as the median or mean or standard deviation – Household income – Patient’s blood pressure AP Statistics, Section 9. 3 2
• Because sample means are just averages of observations, they are among the most common statistics • This section describes the sampling distribution of the mean of the responses in an SRS AP Statistics, Section 9. 3 3
Sample Means • Averages are less variable than individual observations • Averages are more normal than individual observations • These two facts contribute to the popularity of sample means in statistical inference 4
The mean and the standard deviation of x-bar • The sampling distribution of x-bar is the distribution of the values of x-bar in all possible samples of the same size from the population AP Statistics, Section 9. 3 5
Mean and standard deviation of a sample mean • Suppose that x-bar is the mean of an SRS of size n drawn from a large population with mean and standard deviation • Then the mean of the sampling distribution of x-bar is and its standard deviation is AP Statistics, Section 9. 3 6
• The behavior of x-bar in repeated samples is much like that of the sample proportion p : – The sample mean x-bar is an unbiased estimator of the population mean – The values of x-bar are less spread out for larger samples • Their standard deviation decreases at the rate of so you must take a sample four times as large to cut the standard deviation of x-bar in half AP Statistics, Section 9. 3 7
• You should only use the formula for the standard deviation of x-bar when the population is at least 10 times as large as the sample – This is almost always the case in practice • These facts about the mean and standard deviation of x-bar are true no matter what the shape of the population distribution is. AP Statistics, Section 9. 3 8
Distribution of x-bar • The shape of the distribution of xbar depends on the shape of the population distribution • If the population distribution is normal, then so is the distribution of the sample mean AP Statistics, Section 9. 3 9
Sampling distribution of a sample mean from a normal population • Draw an SRS of size n from a population that has the normal distribution with mean and standard deviation • Then the sample mean x-bar has the normal distribution N( , ) AP Statistics, Section 9. 3 10
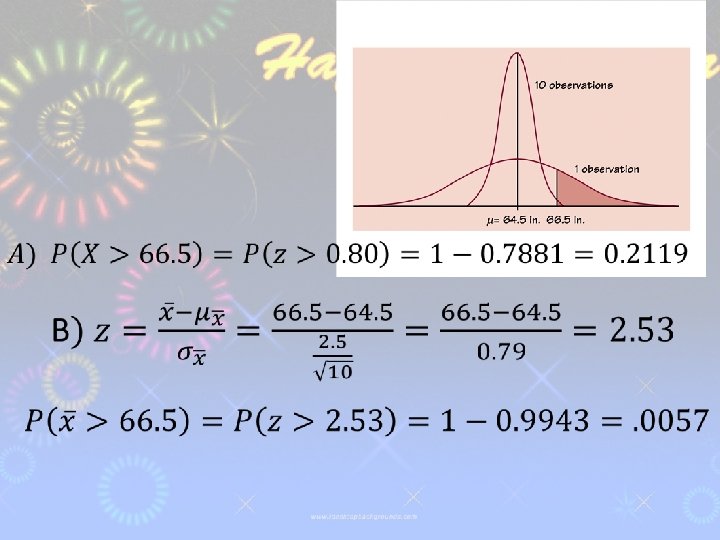
Example 9. 11 page 517 • The height of young women varies approximately according to the N(64. 5, 2. 5). • A) What is the probability that a randomly selected young woman is taller than 66. 5 inches? • B) What is the probability that the mean height of a simple random sample of 10 women is greater than 66. 5 inches? AP Statistics, Section 9. 3 11
****Central Limit Theorem**** • Draw an SRS of size n from any population whatsoever with mean μ and finite standard deviation σ. When n is large, the sampling distribution of the sample mean x-bar is close to the normal distribution N(µ, ), with the mean µ and standard deviation . Use when the question asks you to calculate a probability about an average or a mean. AP Statistics, Section 9. 3 13
Why is this useful? • The central limit theorem allows us to use normal probability calculations to answer questions about sample means from many observations even when the population distribution is not normal AP Statistics, Section 9. 3 14
Example 9. 12 page 521 AP Statistics, Section 9. 3 15
Example 9. 13 • The time that a technician requires to perform preventive maintenance on an air-conditioning unit is governed by the exponential distribution whose density curve has mean 1 hour and standard deviation 1 hour. • Your company operates 70 of these units. • What is the probability that their average maintenance exceeds 50 minutes? AP Statistics, Section 9. 3 16
• AP Statistics, Section 9. 3 17
The big idea of a sampling distribution • Keep taking random samples of size n from a population with mean • Find the sample mean for each sample • Collect all the ‘s and display their distribution • That’s the sampling distribution of • Sampling distributions are the key to understanding statistical inference AP Statistics, Section 9. 3 18
Exercises • 9. 35 -9. 41 all AP Statistics, Section 9. 3 19