Section 8 4 Significance Test for the Difference


 After millions of repetitions, we would expect and to")


- Slides: 24
Section 8. 4 Significance Test for the Difference of Two Proportions
• Quiz 8. 3 – 8. 4 tomorrow – 1 side of a note card
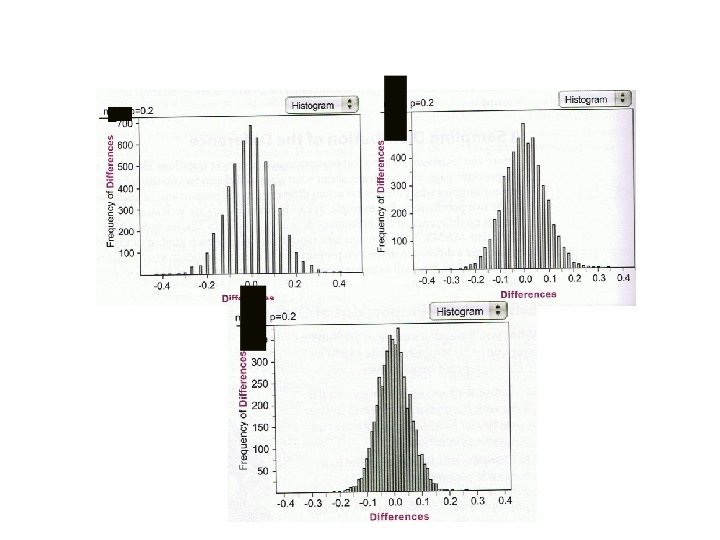
Suppose: • We have two populations.
Suppose: • We have two populations. • The proportion of successes for each population is 0. 2 so …
Suppose: • We have two populations • The proportion of successes for each population is 0. 2 so p 1 = p 2
Suppose: • We take a pair of samples of size 30 from each population and calculate the difference in their proportions,
Suppose: • We take a pair of samples of size 30 from each population and calculate the difference in their proportions, – We repeat this process 5000 times
Suppose: • We take a pair of samples of size 30 from each population and calculate the difference in their proportions, – We repeat this process 5000 times • Next, we do this same process for samples of size 50 and 100
Suppose: • We take a pair of samples of size 30 from each population and calculate the difference in their proportions, – We repeat this process 5000 times • Next, we do this same process for samples of size 50 and 100 Where do we expect the center of the distribution to be?
Where do we expect the center of the distribution to be? 0 because p 1 = p 2 Recall, the mean of the differences is equal to the difference of the means.
As n 1 and n 2 increase? Shape: Center: Spread:
As n 1 and n 2 increase? Shape: more normal Center: Spread:
As n 1 and n 2 increase? Shape: more normal Center: stays at 0 Spread:
As n 1 and n 2 increase? Shape: more normal Center: stays at 0 Spread: decreases
Standard Error As n 1 and n 2 increase, the standard error decreases. To find standard error, use formula: SE =
Standard Error
Page 536, P 48
Page 536, P 48 (a) After millions of repetitions, we would expect and to both equal 0. 12. Thus, the expected value of the difference of would be 0. 12 - 0. 12 = 0.
Page 536, P 48
Page 536, P 48
Page 536, P 48 d. Using the calculator, normalcdf(. 05, 1 E 99, 0, . 0154) gives approximately 0. 00058. Note: This is not a standard normal distribution so must also use mean and standard error.
Time to go to work on Fathom Lab 8. 4 a! Due: Wednesday
Questions?