Section 8 2 Estimating a Population Proportion Section


 Random: The data should come from")


 Suppose a similar survey will be given to vaccine-eligible")

- Slides: 20
Section 8. 2 Estimating a Population Proportion
Section 8. 2 Estimating a Population Proportion After this section, you should be able to… ü CONSTRUCT and INTERPRET a confidence interval for a population proportion ü DETERMINE the sample size required to obtain a level C confidence interval for a population proportion with a specified margin of error ü DESCRIBE how the margin of error of a confidence interval changes with the sample size and the level of confidence C
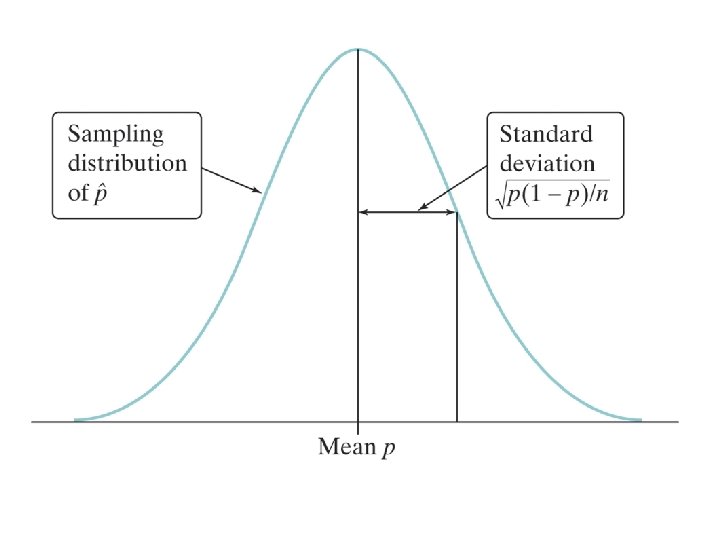
Estimating p & Constructing a CI: Conditions 1) Random: The data should come from a well-designed random sample or randomized experiment. 3) Independent: Individual observations are independent. When sampling without replacement, the sample size n should be no more than 10% of the population size N (the 10% condition).
Formula: Confidence Interval for p
The Process: Confidence Intervals Parameter: p = true proportion…. Assess Conditions: Random: SRS or random assignment Sample Size: be sure to show both np ≥ 10 and n(1 – p) ≥ 10, the formula plugged and a sentence stating the values are greater than 10, therefore normal. Independent: 10% rule Name Interval: 1 -proportion z-Interval: Use your calculator. “We are ____% confident that the interval from ____ to ____ will capture the true proportion of (context)…” Conclude in Context: Answer the question being asked.
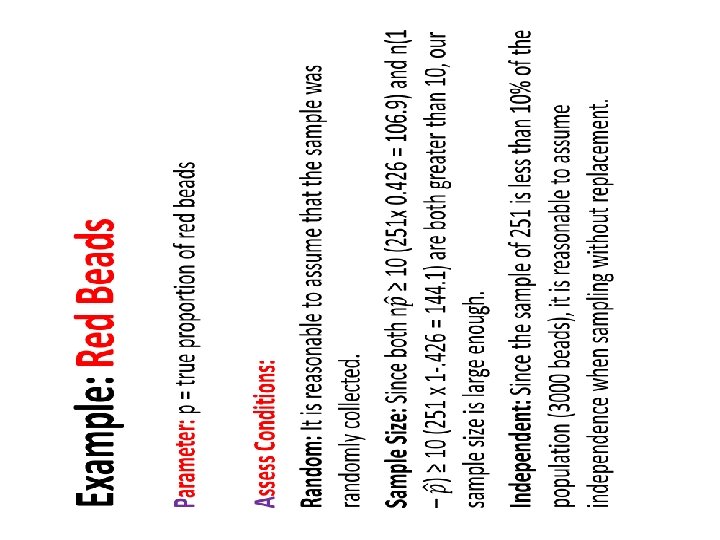
Example: Red Beads Calculate and interpret a 90% confidence interval for the proportion of red beads in the container of 3000 beads. Mrs. Daniel claims 50% of the beads are red. Use your interval to comment on this claim. The sample proportion you found was 0. 426 with a sample of 251 beads. z . 03 . 04 . 05 – 1. 7 . 0418 . 0409 . 0401 – 1. 6 . 0516 . 0505 . 0495 – 1. 5 . 0630 . 0618 . 0606 ü For a 90% confidence level, z* = 1. 645
Example: Red Beads Name Interval: 1 -proportion z-Interval: We are 90% confident that the interval from 0. 375 to 0. 477 will capture the true proportion of red beads. statistic ± (critical value) • (standard deviation of the statistic) 0. 426 +/- 1. 645 *
Example: Red Beads Name Interval: 1 -proportion z-Interval: We are 90% confident that the interval from 0. 375 to 0. 477 will capture the true proportion of red beads.
Example: Red Beads Conclude in Context: It is pretty doubtful that Mrs. Daniel’s claim in true that 50% of the beads are red because 0. 50 is not included within the interval.
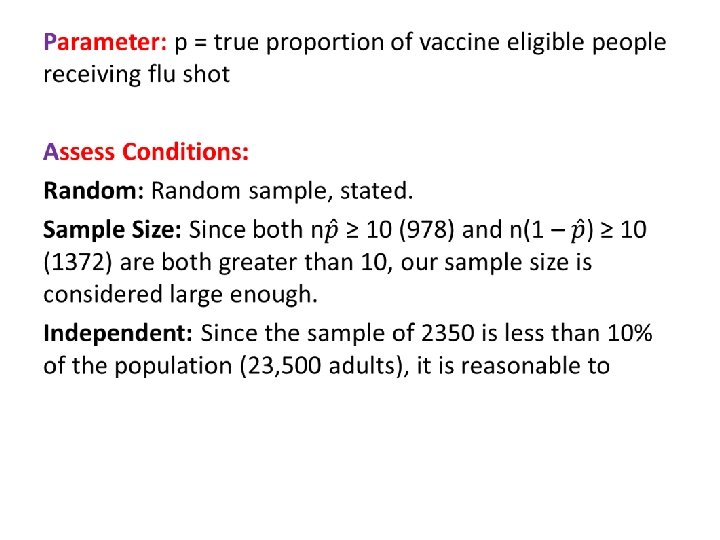
2011 B #5 During a flu vaccine shortage in the United States, it was believed that 45 percent of vaccine-eligible people received flu vaccine. The results of a survey given to a random sample of 2, 350 vaccine-eligible people indicated that 978 of the 2, 350 people had received flu vaccine. (a) Construct a 99 percent confidence interval for the proportion of vaccine-eligible people who had received flu vaccine. Use your confidence interval to comment on the belief that 45 percent of the vaccine-eligible people had received flu vaccine.
Name Interval: 1 -proportion z-Interval: We are 99% confident that the interval from 0. 38998 to 0. 44236 will capture the true proportion of vaccine eligible adults receiving the flu shot. Conclude in Context: Since 0. 45 (45%) is not contained within the interval, we have reasonable evidence that 45% of eligible adults did not get vaccinated.
Scoring Part a: 1 point: • Name interval • Check random condition • Check sample size condition 1 point: • Correct interval with sentence 1 point: • Correct conclusion about 45% vaccination claim
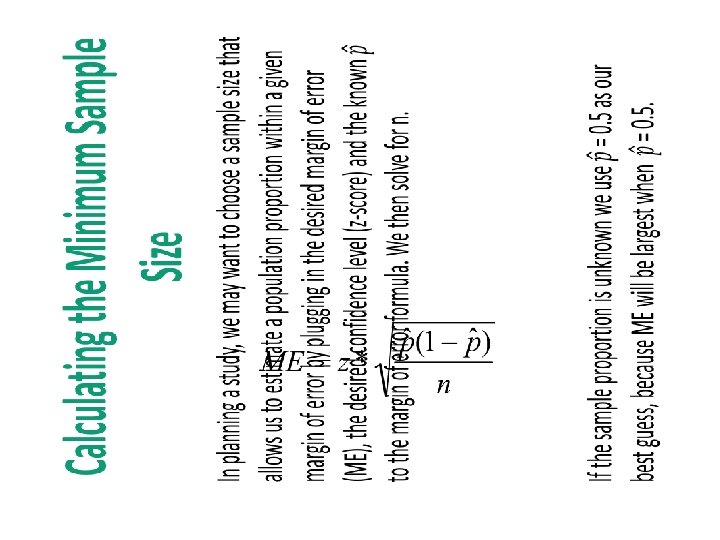
Example: Customer Satisfaction Mc. Donald's wants to determine customer satisfaction with its new BBQ Chicken Burger. The VP of New Products has hired you to conduct a survey. At a minimum how many people do you need to survey, if the company is requiring a margin of error of 0. 03 at 95% confidence?
Example: Customer Satisfaction Mac. Donald's wants to determine customer satisfaction with its new BBQ Chicken Burger. The VP of New Products has hired you to conduct a survey. At a minimum how many people do you need to survey, if the company is requiring a margin of error of 0. 03 at 95% confidence? Multiply both sides by square root n and divide both sides by 0. 03. Square both sides. Substitute 0. 5 for the sample proportion to find the largest ME possible. We round up to 1068 respondents to ensure the margin of error is no more than 0. 03 at 95% confidence.
2011 B #5 b (b) Suppose a similar survey will be given to vaccine-eligible people in Canada by Canadian health officials. A 99 percent confidence interval for the proportion of people who will have received flu vaccine is to be constructed. What is the smallest sample size that can be used to guarantee that the margin of error will be less than or equal to 0. 02 ?
Solution The sample-size calculation uses 0. 5 as the value of the proportion in order to provide the minimum required sample size to guarantee that the resulting interval will have a margin of error no larger than 0. 02. A sample of at least 4, 148 vaccine-eligible people should be taken in Canada.