SECTION 7 2 Estimating a Population Proportion Where


 of values")


 is the positive z")

 for a 95%")


 #9 -10 (Expressing/Interpreting CI) #17")


 The 95% confidence interval: 0. 6768 < p < 0. 7232 (0.")
 Based on the confidence interval obtained in part (b), it does appear")


 Use To be 95% confident that our sample percentage is within three")
 Use To be 95% confident that our sample percentage is within three")


 #25 -28 (Determining Sample Size)")
- Slides: 66
SECTION 7. 2 Estimating a Population Proportion
Where Have We Been? In Chapters 2 and 3 we used “descriptive statistics”. We summarized data using tools such as graphs, mean, and standard deviation.
Where Are We Going? In Chapter 6 we began using “inferential statistics”. � We will be using sample data to make inferences about population parameters.
Learning Targets In this section… • we present methods for using a sample proportion to estimate the value of a population proportion. • The sample proportion is the best point estimate of the population proportion. • We can use a sample proportion to construct a confidence interval to estimate the true value of a population proportion, and we should know how to interpret such confidence intervals. • We should know how to find the sample size necessary to estimate a population proportion.
Goals – Ideas to Understand 1. 2. 3. How to find the best point estimate of the population proportion. How to construct and interpret confidence intervals. How to find the sample size necessary to estimate a population proportion.
Topic 1 - Definitions A point estimator is a statistic that provides an estimate of a population parameter. Point estimators that we will be using are The value of that statistic from a sample is called a point estimate. Ideally, a point estimate is our “best guess” at the value of an unknown parameter. The sample proportion is the best point estimate of the population proportion p. (Section 6. 7 – unbiased, most consistent) The sample mean is the best point estimate of the population mean µ.
Topic 1 - Example In a Pew Research Center poll, respondents were asked “From what you’ve read and heard, is there solid evidence that Robert Bell is missed in his 1 st hour class whenever he goes to see his counselor? 95% of 1501 randomly selected adults in the U. S answered yes. Find the best point estimate of the proportion of all adults in the U. S who believe in The best estimate is 95%. missing Robert.
Topic 1 - Example In a Pew Research Center poll, respondents were asked “From what you’ve read and heard, is there solid evidence that the average temperature on earth has been increasing over the past few decades, or not? 70% of 1501 randomly selected adults in the U. S answered yes. Find the best point estimate of the proportion of all adults in the U. S who believe in Warming. The. Global best estimate is 70%.
Example: In the Chapter Problem we noted that in a Pew Research Center poll, 70% of 1501 randomly selected adults in the United States believe in global warming, so the sample proportion is = 0. 70. Find the best point estimate of the proportion of all adults in the United States who believe in global warming. Because the sample proportion is the best point estimate of the population proportion, we conclude that the best point estimate of p is 0. 70. When using the sample results to estimate the percentage of all adults in the United States who believe in global warming, the best estimate is 70%.
Topic 1 - Flaws 70% was our best point estimate of the population proportion p, but we have no idea of just how GOOD our best estimate is. THINK: I could give you my best estimate for how awesome cats are. However, given my experience is based on only two cats, how good of a estimate is that for every cat?
Introducing … TOPIC 2 – CONFIDENCE INTERVALS
Topic 2 – Confidence Intervals Definition Confidence Interval: A range (or interval) of values used to estimate the true value of a population parameter. Abbreviated CI. Important Notes A confidence level is expressed as the probability or area 1 – , where is the complement of the confidence level, that the confidence interval actually does contain the population parameter, assuming that the estimation process is repeated a large number of times. � Most common choices are 90%, 95%, or 99%. This means (α = 10%), (α = 5%), (α = 1%) � CL = 1 – , or = 1 – CL
Topic 2 - Interpreting a Confidence Interval We must be careful to interpret confidence intervals correctly. There is a correct interpretation and many different and creative incorrect interpretations of the confidence interval 0. 677 < p < 0. 723. “We are 95% confident that the interval from 0. 677 to 0. 723 actually does contain the true proportion of [the topic]. ” This means that if we were to select many different samples of size 1501 (from example 2) and construct the corresponding confidence intervals, 95% of them would actually contain the value of the population proportion p. (Note that in this correct interpretation, the level of 95% refers to the success rate of the process being used to estimate the proportion. )
Topic 2 – Interpreting Confidence Intervals Correct – The Robert Bell Way � “We are 95% confident that the interval from 0. 677 to 0. 723 actually does contain the true value of the population proportion p. ” � This means that if we were to select many different samples of size n and construct the corresponding confidence intervals, 95% of them would actually contain the value of the population proportion p. � Refers to the process.
Topic 2 – Interpreting Confidence Intervals Incorrect – Anything that is NOT Robert Bell � “There is a 95% chance that the true value of p will fall between 0. 677 and 0. 723. ” � “ 95% of sample proportions fall between 0. 677 and 0. 723. ” A confidence interval either contains p or it does not. That is why it is incorrect to say there is a 95% chance that p will fall between 0. 677 and 0. 723.
Caution Know the correct interpretation of a confidence interval. Confidence intervals can be used informally to compare different data sets, but the overlapping of confidence intervals should not be used for making formal and final conclusions about equality of proportions.
Topic 2 – Critical Values A standard z score can be used to distinguish between sample statistics that are likely to occur and those that are unlikely to occur. Such a z score is called a critical value. Definition Critical Value: The number on the borderline separating sample statistics that are likely to occur from those that are unlikely to occur.
Topic 2 – Critical Clarification The number z /2 is a critical value that is a z score with the property that it separates an area of /2 in the right tail of the standard normal distribution.
Critical Values 1. Under certain conditions, the sampling distribution of sample proportions can be approximated by a normal distribution.
Critical Values 2. A z score associated with a sample proportion has a probability of /2 of falling in the right tail.
Critical Values 3. The z score separating the right-tail region is commonly denoted by z /2 and is referred to as a critical value because it is on the borderline separating z scores from sample proportions that are likely to occur from those that are unlikely to occur.
Notation for Critical Value The critical value z /2 (z*) is the positive z value that is at the vertical boundary separating an area of /2 in the right tail of the standard normal distribution. (The value of –z /2 is at the vertical boundary for the area of /2 in the left tail. ) The subscript /2 is simply a reminder that the z score separates an area of /2 in the right tail of the standard normal distribution.
The Critical Valuez 2 Found from TI 83/84 Graphing Calculator
Topic 2 – Critical Example 1. 2. 3. Finding zα/2 (z*) for a 95% Confidence Level Find /2 Subtract the result from 1. Find the corresponding z score.
Finding z 2 for a 95% Confidence Level = 5% 2 = 2. 5% =. 025 z 2 -z 2 Critical Values
Finding z 2 for a 95% Confidence Level - cont = 0. 05 Use Table A-2 to find a z score of 1. 96 z 2 = ± 1. 96
Topic 2 – Critical Practice Confidence Level 90% 95% 99% 0. 10 0. 05 0. 01 Critical Value, z /2 1. 6449 1. 96 2. 5758 = (1 – 0. 9)/2 = 0. 05, inv. Norm(1 – 0. 05, 0, 1) = 1. 6449 = (1 – 0. 99)/2 = 0. 005, inv. Norm(1 – 0. 005, 0, 1) = 2. 5758 Your turn. Complete the table.
Your Turn: Find the appropriate critical value for the given confidence level. Round to four decimals. a) 92% = 1 – 0. 92 = 0. 08, /2 = 0. 08/2 = 0. 04, z = inv. Norm(1 – 0. 04, 0, 1) = 1. 7507 b) 84% = 1 – 0. 84 = 0. 16, /2 = 0. 16/2 = 0. 08, z = inv. Norm(1 – 0. 08, 0, 1) = 1. 4051 c) 78% = 1 – 0. 78 = 0. 22, /2 = 0. 22/2 = 0. 11, z = inv. Norm(1 – 0. 11, 0, 1) = 1. 2265
Topic 2 – Margin of Error for Proportions
Topic 2 – Margin of Error Formula Important Notes The margin of error E is also called the maximum error of the estimate and can be found by multiplying the critical value and the standard deviation of the sample proportions:
Topic 2 – Margin of Error Example Assume that a sample is used to estimate a population proportion p. Find the margin of error, E, that corresponds to the given statistics and confidence level. Round the margin of error to three decimal places. A. 90% confidence, sample size is 500, of 20% are successes. 99% confidence, sample size is 300, of 25% are successes. B.
Topic 2 – Margin of Error Example
Topic 2 – Margin of Error Example
Your Turn: Assume that a sample is used to estimate a population proportion p. Find the margin of error, E, that corresponds to the given statistics and confidence level. Round the margin of error to three decimal places. a) 95% confidence, sample size is 600, of 32% are successes. b) 98% confidence, sample size is 1142, of 24% are successes.
Brief Summary Learned about point estimate. Defined confidence intervals. Discovered how to find critical values and the margin of error. Now the MAIN EVENT: CONSTRUCTING CONFIDENCE INTERVALS
Homework Pg. 340 -341 #5 -8 (Finding Critical Values) #9 -10 (Expressing/Interpreting CI) #17 -20 (Finding Margin of Error)
Confidence Interval for Estimating a Population Proportion p
Topic 2 – Expressing A Margin of Error 3 different ways to write a confidence interval All three expressions are the same. In colleges, the teachers will requires the students to express the C. I. in the INTERVAL NOTATION. Now express your answers from before as an interval.
Round-Off Rule for Confidence Interval Estimates of p Round the confidence interval limits for p to four significant digits.
Procedure for Constructing a Confidence Interval for p 1. Verify that the required assumptions are satisfied. (The sample is a simple random sample, the conditions for the binomial distribution are satisfied, and the normal distribution can be used to approximate the distribution of sample proportions because np 5, and nq 5 are both satisfied. ) 2. Refer to graphing calculator to find the critical value zα/2 that corresponds to the desired confidence level. 3. Evaluate the margin of error
Procedure for Constructing a Confidence Interval for p - cont 5. Round the resulting confidence interval limits to four significant digits.
Topic 2 – Putting it All Together 1. 2. 3. 4. 5. How To Guide: Constructing a Confidence Interval Verify the sample is a simple, random sample and that the conditions for a binomial distribution are met. Find the critical value zα/2 Evaluate the margin of error. Find the values of the confidence interval limits. Round the resulting confidence interval limits to three significant figures.
Topic 2 – Example Constructing a Confidence Interval: Poll Results A poll of 1501 randomly selected U. S adults showed that 70% of the respondents believe in global warming. 1. Find the margin of error that corresponds to a 95% confidence interval. 2. Find the 95% confidence interval estimate of the population proportion p. 3. Based on the results, can we safely conclude that the majority of adults believe in global warming?
Example: Requirement check: simple random sample; fixed number of trials, 1501; trials are independent; two categories of outcomes (believes or does not); probability remains constant. Note: number of successes and failures are both at 5. formula to find the margin of error. 1)least Use the
Example: 2) The 95% confidence interval: 0. 6768 < p < 0. 7232 (0. 6768, 0. 7232)
Example: 3) Based on the confidence interval obtained in part (b), it does appear that the proportion of adults who believe in global warming is greater than 0. 5 (or 50%), so we can safely conclude that the majority of adults believe in global warming. Because the limits of 0. 6768 and 0. 7232 are likely to contain the true population proportion, it appears that the population proportion is a value greater than 0. 5.
Your Turn: In a random sample of 203 college students, 75 had part-time jobs. Find the margin of error for the 90% confidence interval used to estimate the population proportion.
Your Turn: Use the given degree of confidence and sample data to construct a confidence interval for the population proportion p. n = sample size, x = number of successes a) n = 741, x = 274; 95% confidence b) n = 267, x = 194; 88% confidence
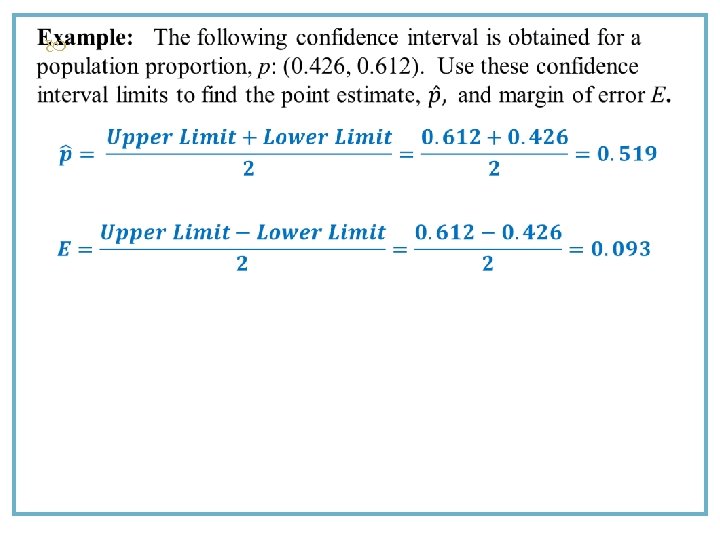
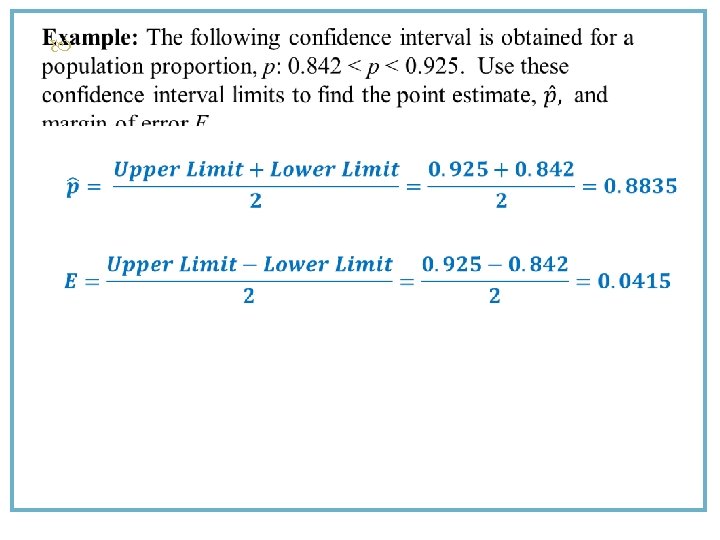
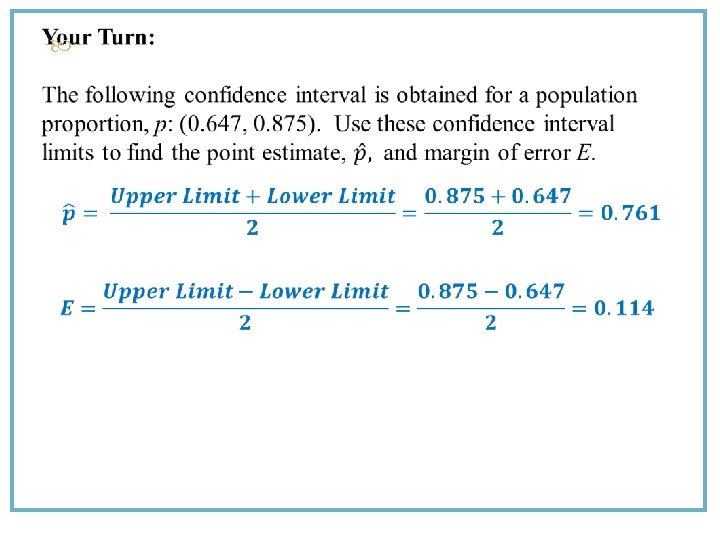
Topic 2 – Point Estimate and E When the C. I. is given, to find the Point Estimate and E from a Confidence Interval
Your Turn: The following confidence interval is obtained for a population proportion, p: 0. 542 < p < 0. 714. Use these confidence interval limits to find the margin of error, E.
Topic 3 – Determining Sample Size Objective Determine how large the sample should be in order to estimate the population proportion p.
Analyzing Polls When analyzing polls consider: 1. The sample should be a simple random sample, not an inappropriate sample (such as a voluntary response sample). 2. The confidence level should be provided. (It is often 95%, but media reports often neglect to identify it. ) 3. The sample size should be provided. (It is usually provided by the media, but not always. ) 4. Except for relatively rare cases, the quality of the poll results depends on the sampling method and the size of the sample, but the size of the population is usually not a factor.
Caution Never follow the common misconception that poll results are unreliable if the sample size is a small percentage of the population size. The population size is usually not a factor in determining the reliability of a poll.
Sample Size Suppose we want to collect sample data in order to estimate some population proportion. The question is how many sample items must be obtained?
Topic 3 – Determining Sample Size
Topic 3 – Determining Sample Size Important Note Round-off Rule for Determining Sample Size If the computed sample size n is not a whole number, round the value of n up to the next larger whole number.
Topic 3 – Determining Sample Size Example: The Internet is affecting us all in many different ways, so there are many reasons for estimating the proportion of adults who use it. Assume that a manager for E-Bay wants to determine the current percentage of U. S. adults who now use the Internet. How many adults must be surveyed in order to be 95% confident that the sample percentage is in error by no more than three percentage points? a) In 2006, 73% of adults used the Internet. b) No known possible value of the proportion.
Example: a) Use To be 95% confident that our sample percentage is within three percentage points of the true percentage for all adults, we should obtain a simple random sample of 842 adults.
Example: b) Use To be 95% confident that our sample percentage is within three percentage points of the true percentage for all adults, we should obtain a simple random sample of 1068 adults.
Your Turn: Use the given data to find the minimum sample size required to estimate the population proportion. a) Margin of error: 0. 08; confidence level: 96%; from a prior study, is estimated by 0. 24. b) Margin of error: 0. 04; confidence level: 92%; from a prior study, is estimated by 0. 123.
Your Turn: Use the given data to find the minimum sample size required to estimate the population proportion. a) Margin of error: 0. 045; confidence level: 90%; unknown. b) Margin of error: 0. 033; confidence level: 94%; unknown.
Recap In this section we have discussed: Point estimates. Confidence intervals. Confidence levels. Critical values. Margin of error. Determining sample sizes.
Homework Pg. 340 -341 #21 -24 (Constructing Confidence Intervals) #25 -28 (Determining Sample Size) #31, 32 (Application Problems)