Section 7 1 Graphing Exponential Functions Objectives 1

Section 7 -1 Graphing Exponential Functions Objectives: 1. Graph exponential growth functions. 2. Graph exponential decay functions.

Example 1 Graph y = 3 x. x -3 y 0. 04 -2 0. 1 -1 0. 3 0 1 1 3 2 9 Complete the table. Substitute -3 for x y = 3 -3 y = 1/27 or 0. 04 Write 0. 04 in the table Substitute -2 for x y = 3 -2 y = 1/9 or 0. 1 Write 0. 1 in the table Continue substituting numbers for x until the table is complete Plot the points on the graph and connect the points with a smooth curve with arrows at both ends – DO NOT CROSS THE x-axis!

Practice. 1. Graph y = 4 x. x -3 y 0. 02 -2 0. 06 -1 0. 25 0 1 1 4 2 16
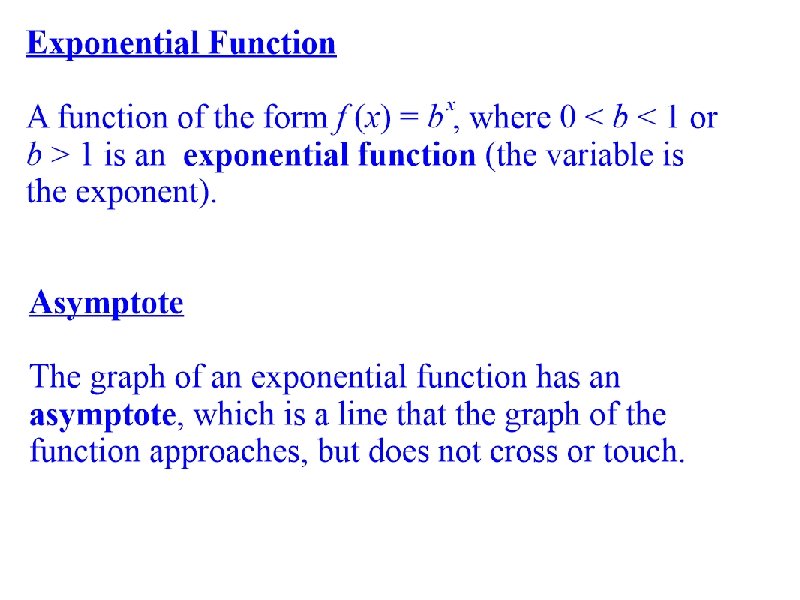
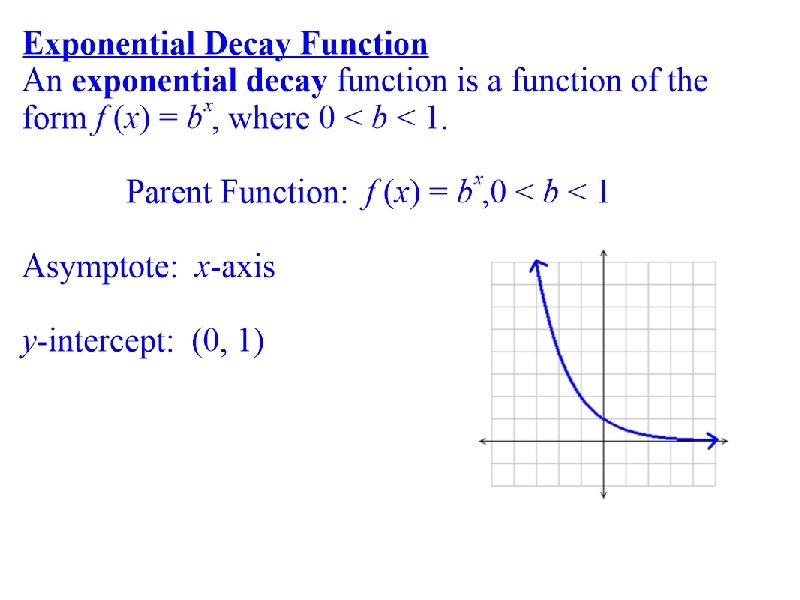
 = b represents a parent graph of the")
Transformations x The graph of f(x) = b represents a parent graph of the exponential functions. The same techniques used to transform the graphs of other functions we have studied can be applied to the graphs of exponential functions.

Example 2 Complete the table. Graph each function. Substitute -3 for x a. y = 2 x + 1 y = 2 -3 + 1 y = 1. 125 x y -3 1. 1 -2 1. 25 -1 1. 5 0 2 1 3 2 5 3 9 Write 1. 1 in the table Substitute -2 for x y = 2 -2 + 1 y = 1. 25 Write 1. 25 in the table Continue substituting numbers for x until the table is complete then graph the points and draw the graph This graph has a horizontal asymptote at y = 1 because of the +1 after the 2 x in the equation, so draw a dashed line at 1 – The graph can NOT cross or touch this line

Complete the table. Example 2 Graph each function. Substitute -1 for x x y -1 -0. 004 0 -0. 02 1 2 -0. 1 -0. 5 3 -2. 5 4 -12. 5 y = -0. 004 Continue substituting numbers for x until the table is complete then graph the points and draw the graph This graph is reflected because the ½ is negative – the graph does NOT cross or touch the x-axis

Practice. Graph each function. x -5 -4 -3 -2 -1 0 1 y x -2 -1 0 1 2 3 y

Practice. Graph each function. x -5 -4 -3 -2 -1 0 1 y -4. 75 -4 -3 -1 3 11 There is a horizontal asymptote at y = -5 (This is the dashed line on the graph) x y -2 -3 -1 -2. 98 0 -2. 9 1 -2. 4 2 0. 6 3 18. 6 There is a horizontal asymptote at y = -3 (This is the dashed line on the graph)

x -2 y 9 -1 3 0 1 1 0. 3 2 0. 1 Complete the table. Substitute -2 for x y=9 Continue substituting numbers for x until the table is complete then graph the points and draw the graph

x -3 y 5 -2 -1 -1 -2. 5 0 -2. 9 1 -2. 97 Complete the table and sketch the graph. This graph has a horizontal asymptote at y = -3
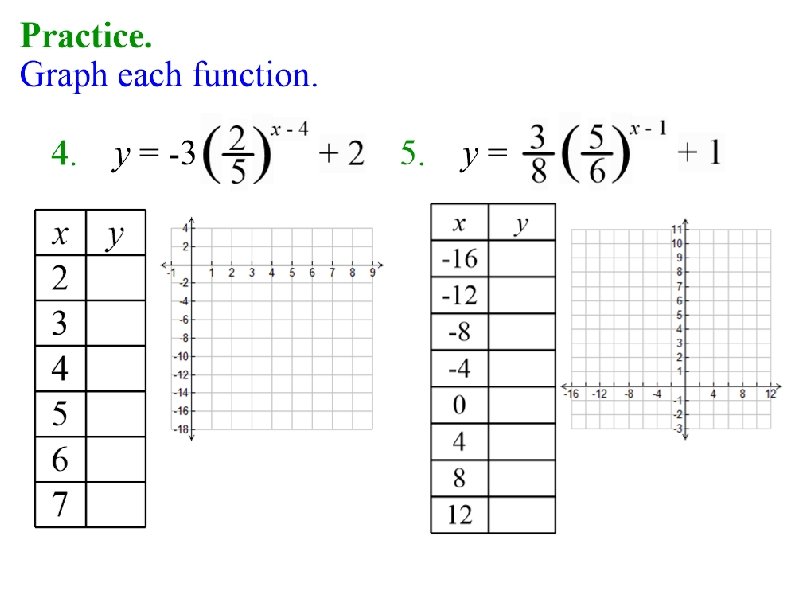

-16. 75 -5. 5 -1 0. 8 1. 52 1. 808 There is a horizontal asymptote at y = 2 9. 3 5. 01 2. 9 1. 45 1. 2 1. 1 There is a horizontal 1. 05 asymptote at y = 1
- Slides: 17