Section 7 1 Graphing Exponential Functions Objectives 1

Section 7 -1 Graphing Exponential Functions Objectives: 1. Graph exponential growth functions. 2. Graph exponential decay functions.
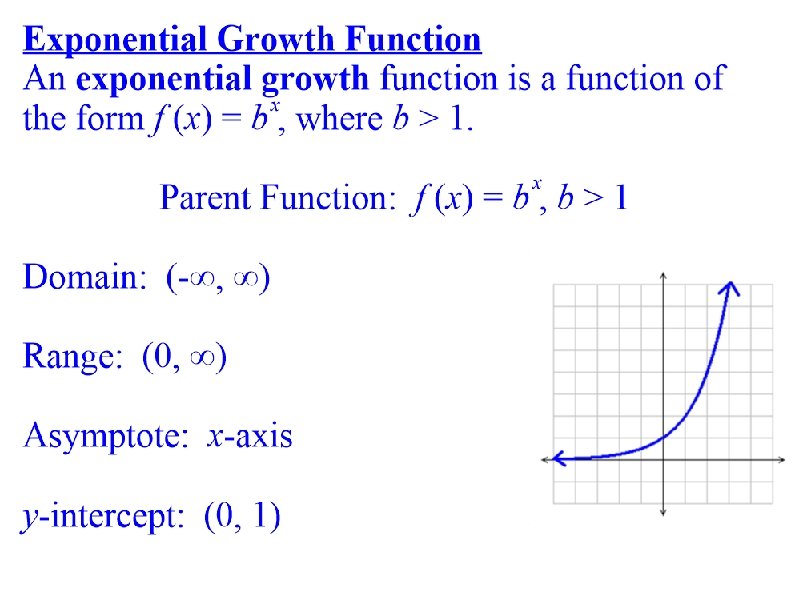

Graph the equation on a graphing calculator Use the table to plot some points Connect the points and put arrows on both ends of the graph – do NOT cross the x-axis The domain is the x values Domain: (-∞, ∞) The range is the y values Range: (0, ∞)

Standard Exponential Equation:

Standard Exponential Equation:

The +1 moves the graph UP 1 and the horizontal asymptote is y = 1, this is represented by a dashed line on the graph Graph the equation on a graphing calculator, use the table to plot points, draw the graph with arrows on both ends, do NOT cross the line y = 1 The domain is the x values Domain: (-∞, ∞) The range is the y values Range: (1, ∞)

Transformations: • The negative sign reflects the graph over the x-axis • The graph shrinks by ½ • The graph moves right 2 Graph the equation on a graphing calculator, use the table to plot points, draw the graph with arrows on both ends, do NOT cross the x-axis The domain is the x values Domain: (-∞, ∞) The range is the y values Range: (-∞, 0)
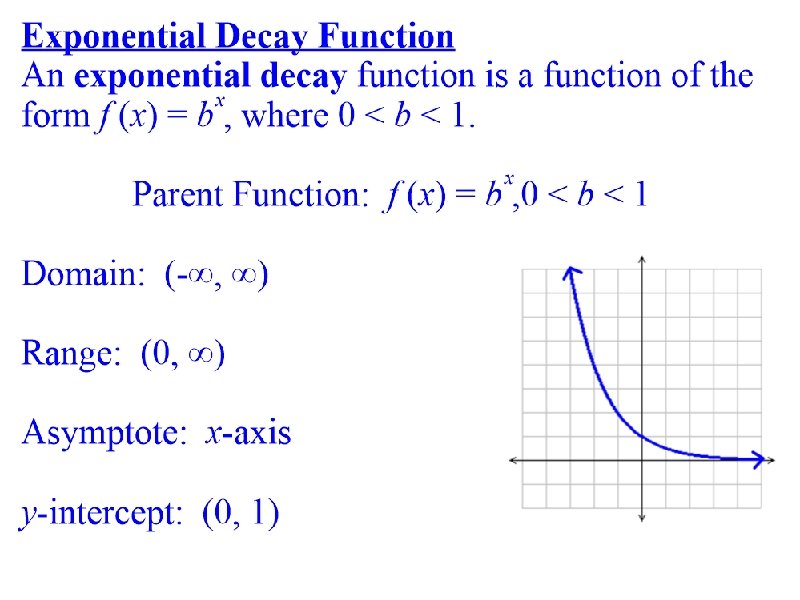

The graph is exponential decay because the 1/3 is a number between 0 and 1 Graph the equation on a graphing calculator, use the table to plot points, draw the graph with arrows on both ends, do NOT cross the x-axis Domain: (-∞, ∞) Range: (0, ∞)

This graph has a Horizontal Asymptote at y = -3 Graph the equation on a graphing calculator, use the table to plot points, draw the graph with arrows on both ends, do NOT cross the line y = -3 Transformations: • Stretch by 2 • Left 2 • Down 3 Domain: (-∞, ∞) Range: (-3, ∞)
- Slides: 12