Section 6 5 The Central Limit Theorem Learning


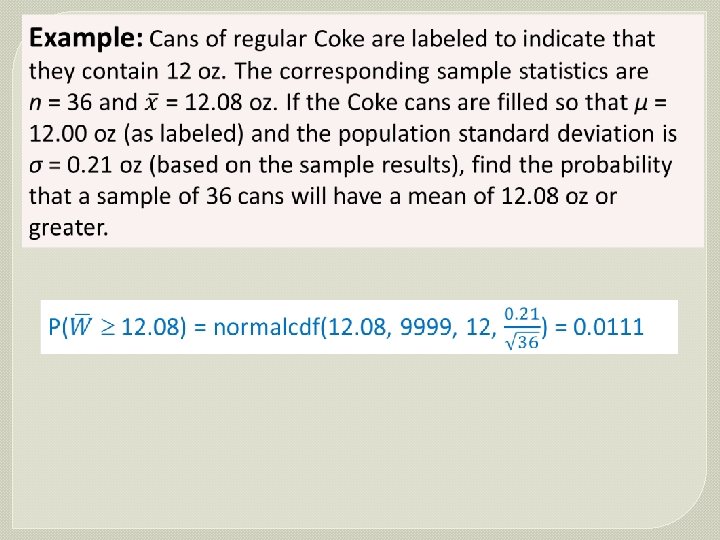
 Find the probability that if an individual man is randomly")


- Slides: 30
Section 6. 5 The Central Limit Theorem
Learning Targets The Central Limit Theorem tells us that for a population with any distribution, the distribution of the sample means approaches a normal distribution as the sample size increases. The procedure in this section form the foundation for estimating population parameters and hypothesis testing.
Given 1. 2. The random variable X has a distribution (which may or may not be normal) with mean and standard deviation . Simple random samples all of the same size n are selected from the population. (The samples are selected so that all possible samples of the same size n have the same chance of being selected. )
Conclusions
Practical Rules Commonly Used 1. 2. For a population with any distribution, if n > 30, then the distribution of the sample means can be approximated reasonably well by a normal distribution. The approximation gets closer to a normal distribution as the sample size n becomes larger. If the original population is normally distributed, then for any sample size n, the sample means will be normally distributed.
Practical Rules Commonly Used 3. If n ≤ 30 and the original distribution does not have a normal distribution the methods of this section do not apply.
The Central Limit Theorem: In Pictures As the sample size increases, the distribution of sample means approaches a normal distribution.
The Central Limit Theorem: In Pictures As the sample size increases, the distribution of sample means approaches a normal distribution.
Important Points to Note • As the sample size increases, the distribution of sample means tends to approach a normal distribution. • The mean of the sample means is the same as the mean of the original population.
Important Points to Note • As the sample size increases, the width of the graph becomes narrower, showing that the standard deviation of the sample mean becomes smaller.
Example - Normal Distribution As we proceed from n = 1 to n = 50, we see that the distribution of sample means is approaching the shape of a normal distribution.
Example - Uniform Distribution As we proceed from n = 1 to n = 50, we see that the distribution of sample means is approaching the shape of a normal distribution.
Example - U-Shaped Distribution As we proceed from n = 1 to n = 50, we see that the distribution of sample means is approaching the shape of a normal distribution.
Important Point As the sample size increases, the sampling distribution of sample means approaches a normal distribution. **Take away from Section 6. 5 – when n > 30, the distribution is calculated as a normal distribution even if it was initially not normally distributed (ie. Uniform Distribution, U-Shape Distribution, or even a Skewed Distribution with Outliers).
Cool … So Why Do We Care? Think of what happens when we have a normal distribution. What can we do? • Calculate any area, therefore any probability. The central limit theorem shows us that most samples can fit a normal distribution. So our calculation power (and therefore understanding) is endless!!!
Notation the mean of the sample means µx = µ the standard deviation of sample mean x = n (often called the standard error of the mean)
Notation the mean of the sample means µx = µ the standard deviation of sample mean x = n (often called the standard error of the mean)
The Fundamental Difference INDIVIDUAL VALUE When working with an individual value from a normally distributed population, use the methods of Section 6. 3. SAMPLE OF VALUES When working with a mean for some sample be sure to use the value of for the standard deviation of the sample mean.
Method for Finding Nonstandard Normal Distribution Areas or Probabilities a b a a
Water Taxi Safety � Previously, we talked about the Baltimore water taxi that sank because of old weight limit standards. The water taxi assumed that the average person weight was 140 lbs. � Given that today the weights of men are normally distributed with a mean of 172 lbs and a standard deviation of 29 lbs. Find the probability that if an individual man is randomly selected, his weight will be greater than 175 lbs.
To find the probability of an individual man is randomly selected, we need to use the command in the calculator: normalcdf(175, 9999, 172, 29) = 0. 4588. P(W > 175) = 0. 4588 175 s = 29 µ = 172,
Water Taxi Safety � Previously, we talked about the Baltimore water taxi that sank because of old weight limit standards. The water taxi assumed that the average person weight was 140 lbs. � Given that today the weights of men are normally distributed with a mean of 172 lbs and a standard deviation of 29 lbs. Find the probability that 20 randomly selected men will have a mean weight that is greater than 175 lbs (so that their total weight exceeds the current safe capacity of 3500 lbs).
µ = 172, 175 s = 29 It is much easier for an individual to deviate from the mean than it is for a group of 20 to deviate from the mean.
Example - cont a) Find the probability that if an individual man is randomly selected, his weight is greater than 175 lb. P(x > 175) = 0. 4588 b) Find the probability that 20 randomly selected men will have a mean weight that is greater than 175 lb (so that their total weight exceeds the safe capacity of 3500 pounds). P(x > 175) = 0. 3218 It is much easier for an individual to deviate from the mean than it is for a group of 20 to deviate from the mean.
Interpretation of Results Given that the safe capacity of the water taxi is 3500 pounds, there is a fairly good chance (with probability 0. 3218) that it will be overloaded with 20 randomly selected men.
Example: When women were allowed to become pilots of fighter jets, engineers needed to redesign the ejection seats because they had originally been designed for men only. The ACES-II ejection seats were designed for men weighing between 140 lb and 211 lb. The weights of women have a mean of 143 lb and a standard deviation of 29 lb. (based on data from the National Health Survey. ) If 36 different women are randomly selected, find the probability that their mean weight is between 140 lb and 211 lb.
Reminder!!! The central limit theorem works if the sample size is greater than 30, or if the original population is normally distributed.
Recap In this section we have discussed: 1. Central limit theorem. 2. Practical rules. 3. Effects of sample sizes. 4. Correction for a finite population.
Homework Pg. 295 -296 #2, 5 -7