Section 6 4 Inferences for Variances Chisquare probability

Section 6. 4 Inferences for Variances

Chi-square probability densities

Use of Chi-square distribution Sample variance S 2 is used to estimate the population variance 2 Assume that the population is normal. has a chi-squared distribution with v=n-1 degrees of freedom. Chi-square probabilities can be found in table B. 5.

Confidence interval for 2 Then we get a 95% confidence interval:

Example The soft-drink company wants to control the variability in the amount of fill. A sample of size 28 was drawn and the sample variance s 2=0. 0007. Give a 95% confidence interval about the variance 2.

Solution • v=n-1=27. • • What is the CI for ?

Example The soft-drink company wants to control the variability in the amount of fill. A sample of size 28 was drawn and the sample variance s 2=0. 0007. Use the five-step significance testing format to assess the evidence that the variance is greater than 0. 0005.

• 1 &2. • 3. The test statistic is • 4. The sample gives • 5. The observed level of significance is P(a chisquare random variable with 27 d. f>37. 8) 0. 05<P-value<0. 1

Inference for the Ratio of two variances • For two independent samples from normal distributions, sometimes we want to compare two variances. • A new distribution called F distribution can be of use here.

F distribution

F-distribution • A F-distribution has two degrees of freedom: – Numerator degrees of freedom v 1 – Denominator degrees of freedom v 2 – Tables B. 6 give quantiles of F-distributions

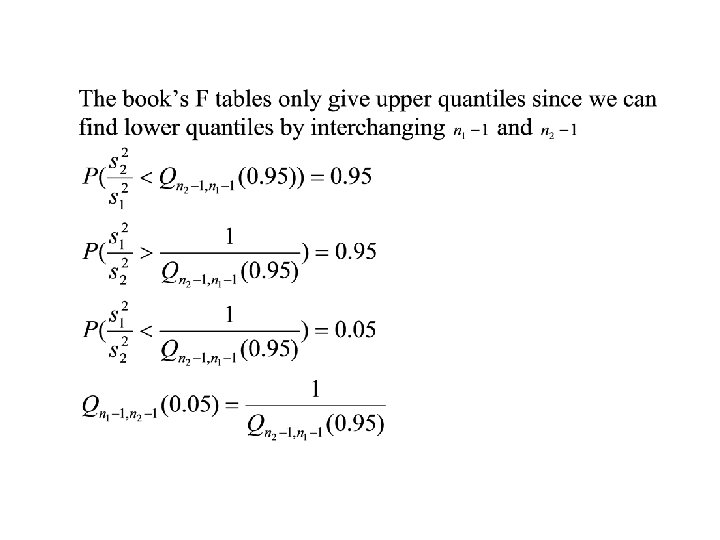
• For F-distribution So • This is particularly useful since in table B. 6 only quantiles for p larger than 0. 5 are given.

The ratio of two variances • When s 12 and s 22 come from independent samples from normal distributions, the variable where n 1 -1 and n 2 -1 are associated degrees of freedom for s 1 and s 2.

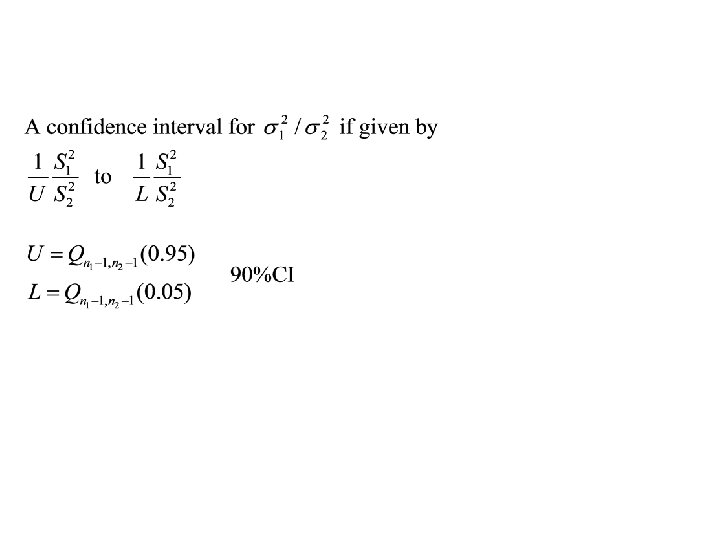
Confidence interval for 12 / 22


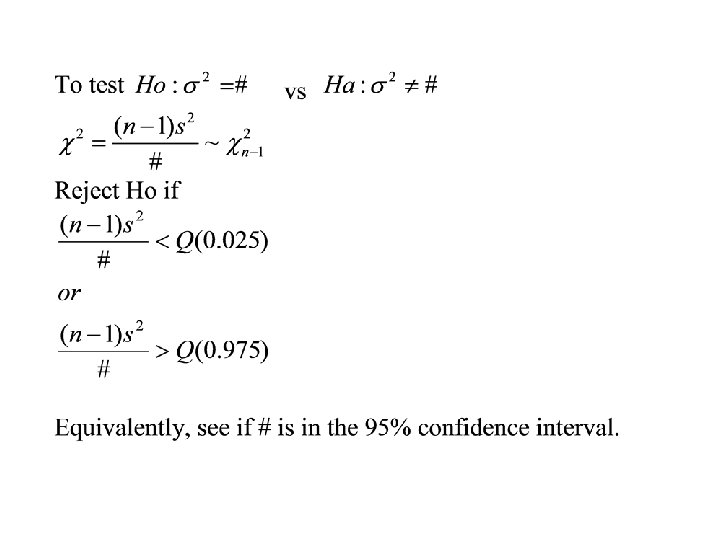
A five step significance test of equality of variances:
- Slides: 20