Section 4 Carbon Stock Measurement Methods 4 3

Section 4. Carbon Stock Measurement Methods 4. 3. Plot Design for Carbon Stock Inventory USAID LEAF Regional Climate Change Curriculum Development Module: Carbon Measurement and Monitoring (CMM)

Carbon Measurement and Monitoring Development Team Acknowledgements Name Affiliation Deborah Lawrence, Co-lead University of Virginia Megan Mc. Groddy, Co-lead University of Virginia Bui The Doi, Co-lead Vietnam Forestry University Ahmad Ainuddin Nuruddin Universiti Putra Malaysia Prasit Wang, Co-lead Chiang Mai University, Thailand Mohd Nizam Said Universiti Kebangsaan Malaysia Sapit Diloksumpun Kasetsart University, Thailand Pimonrat Tiansawat Chiang Mai University, Thailand Pasuta Sunthornhao Kasetsart University, Thailand Panitnard Tunjai Chiang Mai University, Thailand Wathinee Suanpaga Kasetsart University, Thailand Lawong Balun University of Papua New Guinea Jessada Phattralerphong Kasetsart University, Thailand Mex Memisang Peki PNG University of Technology Pham Minh Toai Vietnam Forestry University Kim Soben Royal University of Agriculture, Cambodia Nguyen The Dzung Vietnam Forestry University Pheng Sokline Royal University of Phnom Penh, Cambodia Nguyen Hai Hoa Vietnam Forestry University Seak Sophat Royal University of Phnom Penh, Cambodia Le Xuan Truong Vietnam Forestry University Choeun Kimseng Royal University of Phnom Penh, Cambodia Phan Thi Quynh Nga Vinh University, Vietnam Rajendra Shrestha Asian Institute of Technology, Thailand Erin Swails Winrock International Ismail Parlan FRIM Malaysia Sarah Walker Winrock International Nur Hajar Zamah Shari FRIM Malaysia Sandra Brown Winrock International Samsudin Musa FRIM Malaysia Karen Vandecar US Forest Service Ly Thi Minh Hai USAID LEAF Vietnam Geoffrey Blate US Forest Service David Ganz USAID LEAF Bangkok Chi Pham USAID LEAF Bangkok
 II III OVERVIEW: CLIMATE CHANGE AND FORESTCARBON")
I Carbon Measurement and Monitoring Module (CMM) II III OVERVIEW: CLIMATE CHANGE AND FORESTCARBON 1. 1 Overview: Tropical Forests and Climate Change 1. 2 Tropical forests, the global carbon cycle and climate change 1. 3 Role of forest carbon and forests in global climate negotiations 1. 4 Theoretical and practical challenges forest-based climate mitigation FOREST CARBON STOCKS AND CHANGE 2. 1 Overview of forest carbon pools (stocks) 2. 2 Land use, land use change, and forestry (LULUCF) and CO 2 emissions and sequestration 2. 3 Overview of Forest Carbon Measurement and Monitoring 2. 4 IPCC approach for carbon measurement and monitoring 2. 5 Reference levels – Monitoring against a baseline (forest area, forest emissions) 2. 6 Establishing Lam Dong’s Reference Level for Provincial REDD+ Action Plan : A Case Study CARBON MEASUREMENT AND MONITORING DESIGN 3. 1 IV V Considerations in developing a monitoring system CARBON STOCK MEASUREMENT METHODS 4. 1 Forest Carbon Measurement and Monitoring 4. 2 Design of field sampling framework for carbon stock inventory 4. 3 Plot Design for Carbon Stock Inventory 4. 4 Forest Carbon Field Measurement Methods 4. 5 Carbon Stock Calculations and Available Tools 4. 6 Creating Activity Data and Emission Factors 4. 7 Carbon Emission from Selective Logging 4. 8 Monitoring non-CO 2 GHGs NATIONAL SCALE MONITORING SYSTEMS

Learning objectives By the end of this session, learners will be able to: § Determine minimum plots to be established in each forest type and pool § Design plot shape and size for each forest type and pool § Identify appropriate methods to locate sample plots.
 § Overview § Sampling in forest inventory § Plot shape")
Outline Lecture (45 minutes) § Overview § Sampling in forest inventory § Plot shape and size § Number and distribution of plots § Three Activities ( 2 at 5 minutes each one 25 minutes) § References

Overview § Plot design for tree, non-tree vegetation, litter, soil, and deadwood pools § Impact of plot number; plot, shape and size on carbon stock inventory § Selection of plot locations

Reminder: Value of sampling § It is impractical to take measurements that would result in an estimate of the entire mass of the vegetation in a landscape The goal of a carbon inventory is to estimate the mass of the vegetation and soil to determine carbon stocks

Sampling in carbon inventories § Sampling in carbon inventories involves repeated measurements to estimate the mass of vegetation in a known, standardized area (“sampling unit” or “plot”) § Standardized plots are used to ensure all samples represent the same area

Sampling in carbon inventories PLOTS: WHICH SHAPE? HOW BIG? HOW MANY? 1 VEGETATION TYPE 2 ACCURACY 3 PRECISION 4 TIME (COST) OF MEASUREMENT 5

Learning activity What do accuracy and precision mean?

Learning activity § Accuracy of a relative measure of the exactness of the value of an inferred variable for a population. § Precision is the closeness of agreement between independent results of measurements obtained under stipulated conditions.
 Shape: maximize")
Plot design: Shape § Various plot shapes can be used (circles, rectangles) Shape: maximize efficiency and minimize measurement error § Need to decide whether tree is inside or outside of plot § Circles: lowest edge – to – area ratio

Plot design: Shape § Area of shape must be known and measured § So if square/rectangle used-must ensure 90°angles § Plot sides must be straight

Plot design: Shape Answers: 3 m 9 m 5 m 0 m 4 m 12 m 4 m

Plot design: Size § Plot size needs to balance § Rule of thumb: area large enough to sample ~10 individuals

Plot design: Trees Relatively Uniform Forest – e. g. Plantation § Trees are similar size range/homogeneous § Planting lines are visible

Plot design: Trees Relatively Uniform Forest – e. g. Plantation § Need to avoid setting square plots up along planting lines § Must choose appropriate size plot

Plot design: Trees Non-uniform sized trees - Natural Forest § § In most natural forests: § Large trees - few, very spread out § Small trees – many, close together Plot design needs to adequately sample all sizes

Plot design: Trees Non-uniform sized trees - Natural Forest Plots can be single fixed size or “nested” plots containing smaller sub-units § Nested plots are efficient forests with trees of different sizes § Rule of thumb – each nested plot should include ~10 trees §

Nested Plots

Nested Plots

Nested Plots
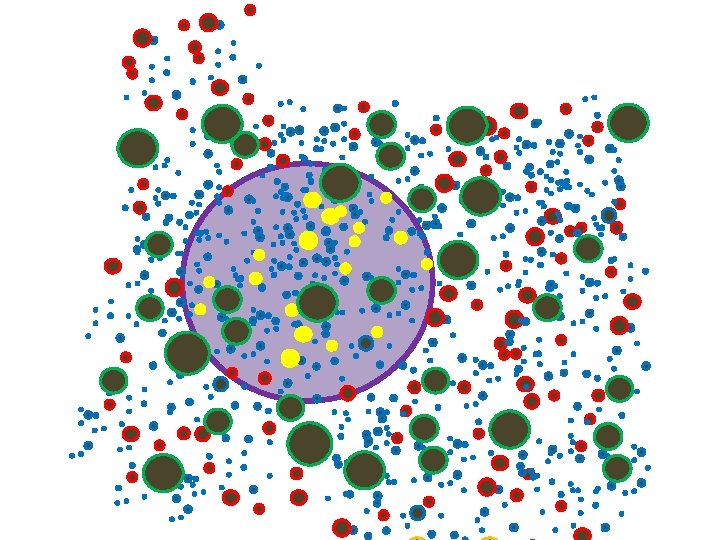
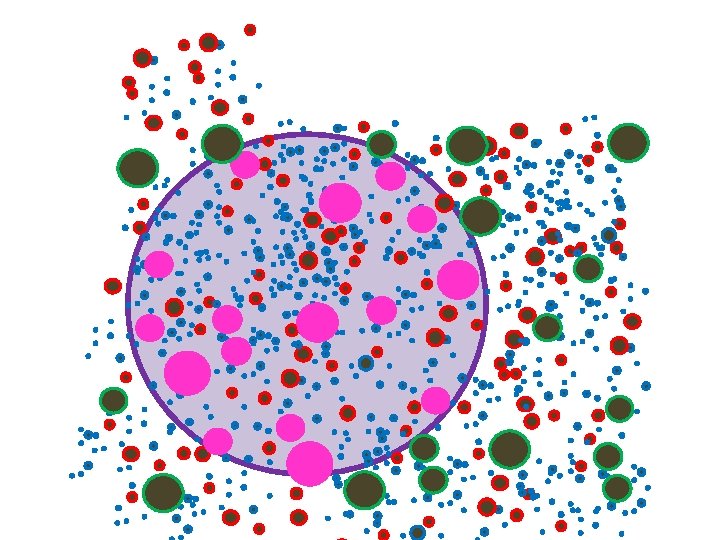
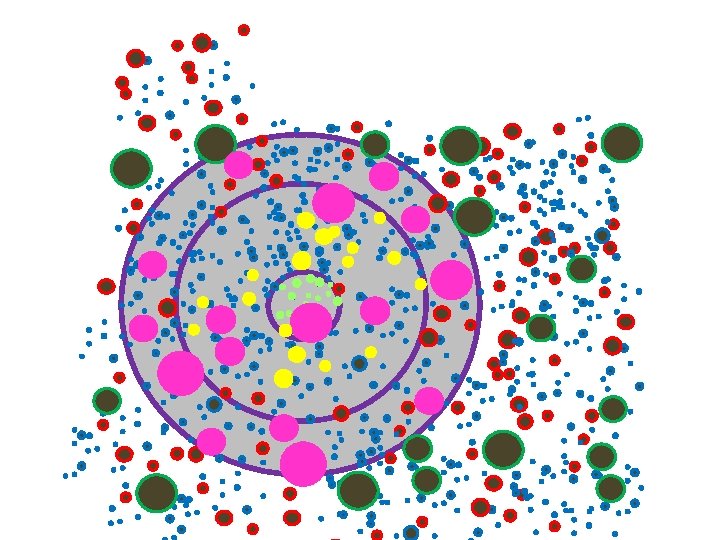

Plot design: Trees § Non-uniform sized trees - Natural Forest Source: Winrock International, 2012

Plot design: Non-tree pools Standing dead wood, palms, bamboo, lianas, shrubs § As for trees, large single size or nested plots are used to capture spatial variability of carbon stocks in large-scale non-tree vegetation § For efficiency, these vegetation types may be measured in the same plots as trees

Learning exercise § On the following slide there are two plot designs for sampling shrubs. Pick which one is better and write down why you think it is a better design
 would best sample the shrubs in this landscape?")
Which plot size (A or B) would best sample the shrubs in this landscape? A B

B is correct because plots should be big enough to capture > 10 individuals

Plot design: Non-tree pools Herbaceous vegetation, litter, lying dead wood, shrubs § Smaller plots are adequate and efficient for capturing spatial variability in small scale vegetation, litter, soil.

Plot design: Herbaceous vegetation and litter § Herbaceous vegetation and litter is sampled in small circular or square plots § Typically plot size of ~1 m 2 is adequate and efficient

Plot design: Fallen dead wood § Fallen dead wood is typically measured using a transect § A transect length of 100 m per plot is usually adequate and efficient

Plot design: Soil Both these photos need sources or to be replaced § Soil carbon is measured by collecting core samples from the top 30 cm of soil

Number of plots § § Depends on targeted level of precision in inventory, common targets are: § ± 10% of the mean at 90% CI § ± 5% of the mean at 95% CI The more variable the carbon stocks in pool or stratum, the more plots needed to achieve the targeted level of precision in carbon stock estimates

Number of plots § Calculate number of plots needed to achieve targeted level of precision in estimate of dominant carbon pool (i. e. trees) by the following equation:

Number of plots: Non-tree pools § Smaller plot size greater variation in carbon stocks between plots § Rule of thumb: Number of non-tree plots proportional to number of tree plots § May result in large variance, but overall carbon in non-tree pools is small compared to tree pool

Location of plots: Tree plots § To maintain statistical rigor, plots must be located without bias § Location of tree plots should either be random or located using a fixed grid

Learning exercise: Location of tree sampling plots § Divide students in to groups and provide each group will with a forest cover map with a study area delineated § Have the students choose locations for plots in the study area by two different methods (random and systematic distribution) ( If available you could provide preliminary data and have students calculate the correct number of plots as well) § Total time: 25 minutes

Location of plots: Non-tree plots § For non-tree carbon pools, sub-plot locations may be based on the location of the tree plot § Sub-plots should be outside of tree plots § Measurements at subsequent inventories should occur in new location

Plot types § § Temporary § For one-time measurements and preliminary data § All non-tree pools Permanent § For measurements repeated over time § Statistically more efficient for measuring incremental growth of trees

Review: Plot design Nested plots: Tree pool, standing dead wood, palms, lianas, bamboo, large shrubs Transect: Lying dead wood Sub plots: § Herbaceous vegetation and small shrubs (~4) § Litter (~4) § Soil (~4 carbon content + ~2 bulk density)

TAKE HOME MESSAGE § The size and shape of the sample plots is a trade-off between accuracy, precision, time, and cost for measurement; § The most appropriate size and shape may also be dependent on the vegetation type found in the sampling area; § Nested plots are efficient forests with trees of different sizes; § Plots can be distributed randomly or systematically.

Suggested readings 1. Diaz, D. and M. Delaney, 2011. Carbon stock assessment guidance 2. Goslee, K. and S. Petrova, 2012. LEAF Technical Training on Reference Level Development. USAID and LEAF; 3. Phuong VT et al, 2012. Guidelines on destructive measurement forest biomass estimation (For Technical Staff Use). UN-REDD Vietnam Program 4. Walker, S. et al, 2012. Standard operation procedures for terrestial carbon measurement. USAID, LEAF and WINROCK international; 5. Pearson, TRH, SL Brown, RA Birdsey, 2007. Measurement Guidelines for the Sequestration of Forest Carbon, USDA 6. Pearson, T. , S. Walker and S. Brown, 2005. Sourcebook for land use, land use change and forestry project. Bio. CF and WINROCK International.
- Slides: 44