Section 4 2 Linear Models Building Linear Functions

Section 4. 2 Linear Models: Building Linear Functions from Data


In baseball, the on-base percentage for a team represents the percentage of time that the players safely reach base. The data given is for the National League during the 2008 baseball season.
 Draw a scatter diagram of the data, treating on -base percentage as the")
a) Draw a scatter diagram of the data, treating on -base percentage as the independent variable.
 Use your graphing utility to draw a scatter diagram c) Describe what happens")
b) Use your graphing utility to draw a scatter diagram c) Describe what happens to runs scored as the onbase percentage increases. d) Do you think this relationship is linear?
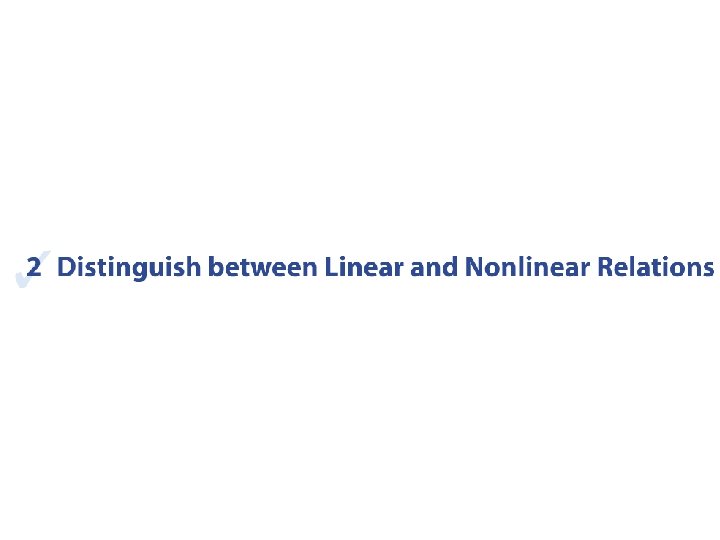

Determine whether the relationship between the two variables is linear or nonlinear. Linear Nonlinear

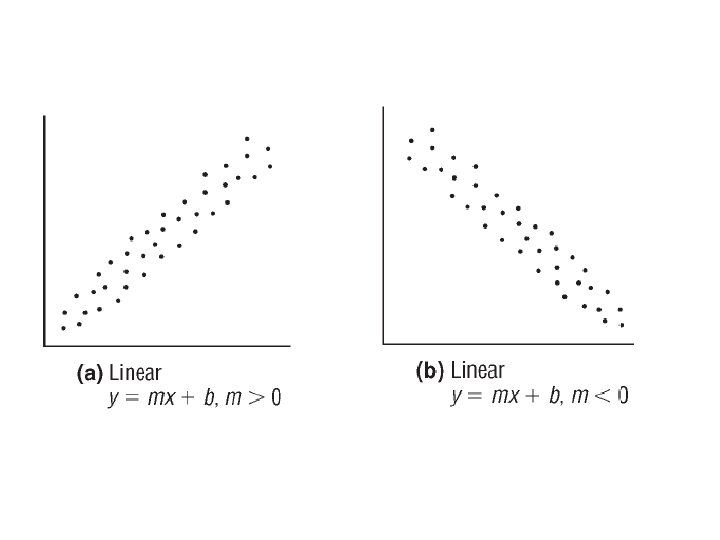
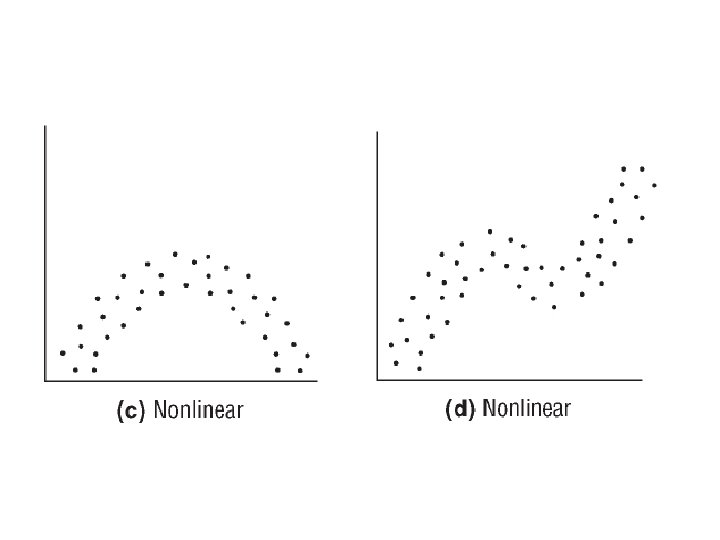
Determine whether the relationship between the two variables is linear or nonlinear. Nonlinear
 Select two points from your data and find an equation of the line")
e) Select two points from your data and find an equation of the line containing the points.
 Graph that line on your scatter diagram (both on paper and in your")
f) Graph that line on your scatter diagram (both on paper and in your calculator. Do you think that there may be a different line that fits the model better? What is a “Line of Best Fit”? The line of best fit can be found using Linear regression (Lin. Reg) in your calculator


Using the data from the previous example: The slope is 40. 85 which means the that for every 1% increase in the on-base percentage, runs scored increase 40. 85, on average (d) Use the line of best fit to predict the number of runs a team will score if their on-base percentage is 34. 1

What is a Correlation Coefficient? The correlation coefficient helps you determine how good is the “line of best fit” On the last example the r=0. 751. This number is called the Correlation Coefficient, r where The closer r is to 0, there is little or no linear relationship between the variables. The closer to 1, the more perfect the linear relationship is between the variables. If r>0 the slope is positive If r<0 the slope is negative Having a correlation coefficient of 0. 751 indicates a linear relationship with positive slope
- Slides: 16