
Section 4 2 Interpolating and Extrapolating Values 6


- Slides: 21
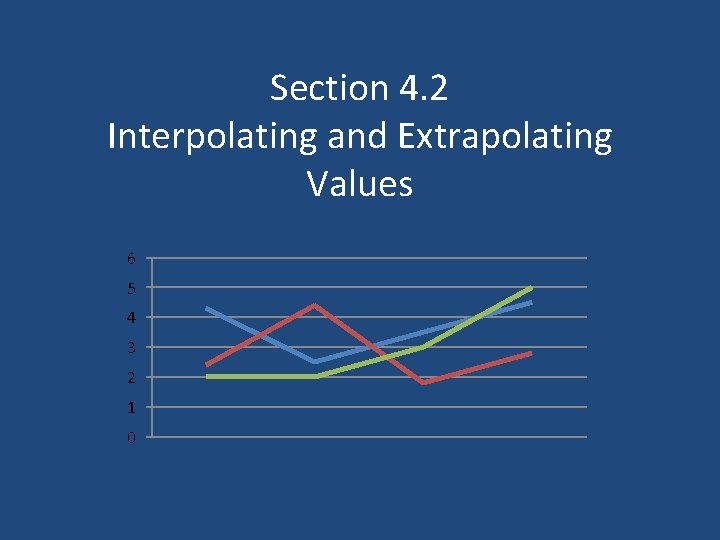
Section 4. 2 Interpolating and Extrapolating Values 6 5 4 3 2 1 0
Warm-up • Complete the warm- up activity - Go over the answers
Definitions • Interpolate: to estimate a value that falls within a known range or graph of values • Extrapolate: to estimate a value that falls outside a known range or graph of values • Trend: the general direction in which values in a data set tend to move
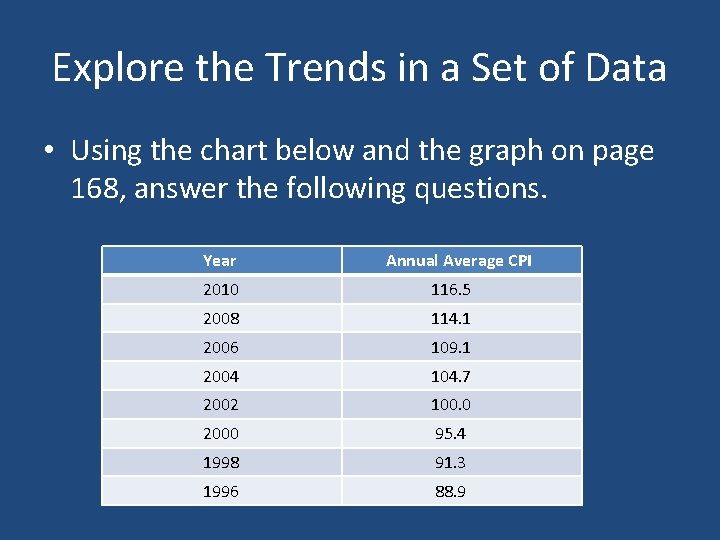
Explore the Trends in a Set of Data • Using the chart below and the graph on page 168, answer the following questions. Year Annual Average CPI 2010 116. 5 2008 114. 1 2006 109. 1 2004 104. 7 2002 100. 0 2000 95. 4 1998 91. 3 1996 88. 9
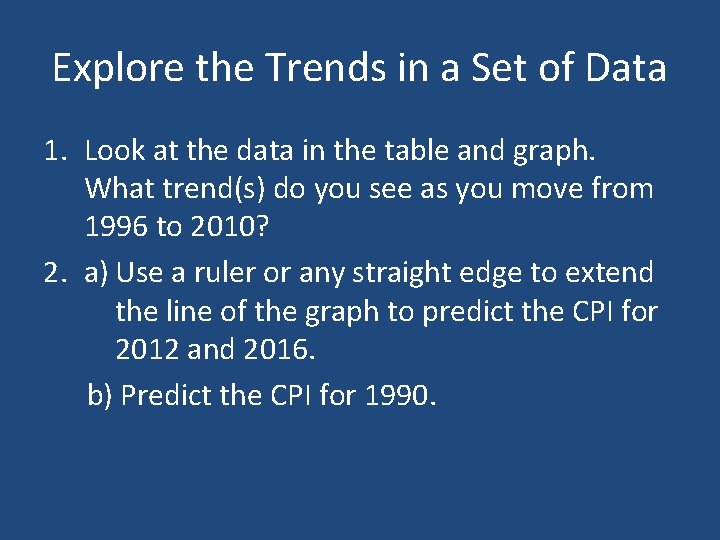
Explore the Trends in a Set of Data 1. Look at the data in the table and graph. What trend(s) do you see as you move from 1996 to 2010? 2. a) Use a ruler or any straight edge to extend the line of the graph to predict the CPI for 2012 and 2016. b) Predict the CPI for 1990.
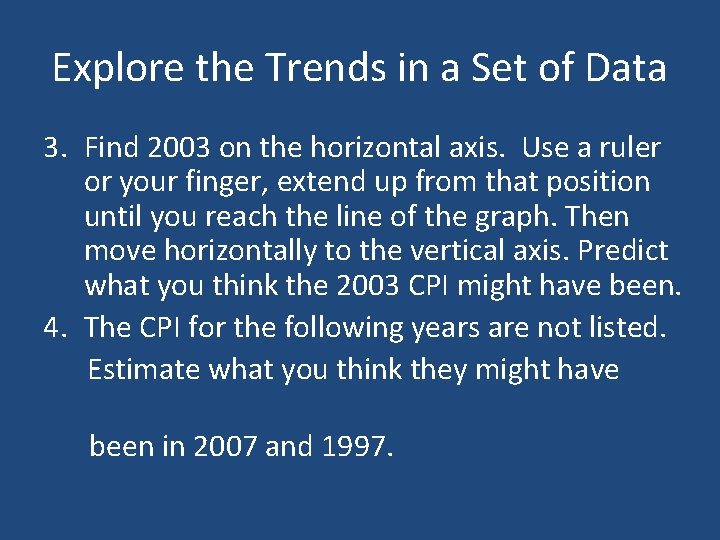
Explore the Trends in a Set of Data 3. Find 2003 on the horizontal axis. Use a ruler or your finger, extend up from that position until you reach the line of the graph. Then move horizontally to the vertical axis. Predict what you think the 2003 CPI might have been. 4. The CPI for the following years are not listed. Estimate what you think they might have been in 2007 and 1997.
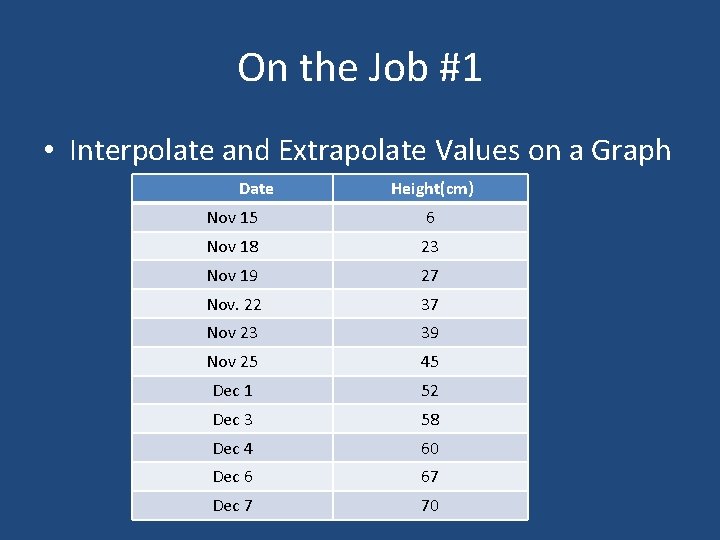
On the Job #1 • Interpolate and Extrapolate Values on a Graph Date Height(cm) Nov 15 6 Nov 18 23 Nov 19 27 Nov. 22 37 Nov 23 39 Nov 25 45 Dec 1 52 Dec 3 58 Dec 4 60 Dec 6 67 Dec 7 70
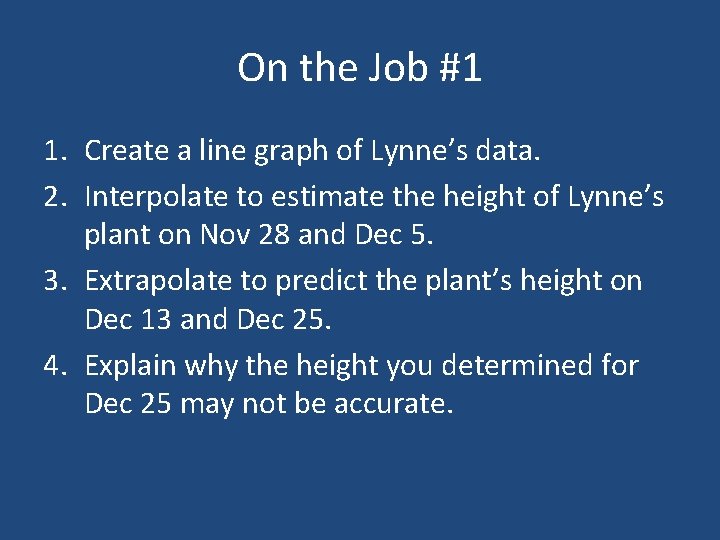
On the Job #1 1. Create a line graph of Lynne’s data. 2. Interpolate to estimate the height of Lynne’s plant on Nov 28 and Dec 5. 3. Extrapolate to predict the plant’s height on Dec 13 and Dec 25. 4. Explain why the height you determined for Dec 25 may not be accurate.
Video Clip • http: //www. youtube. com/watch? v=Y 9 HG 8 q_ Nuh. U
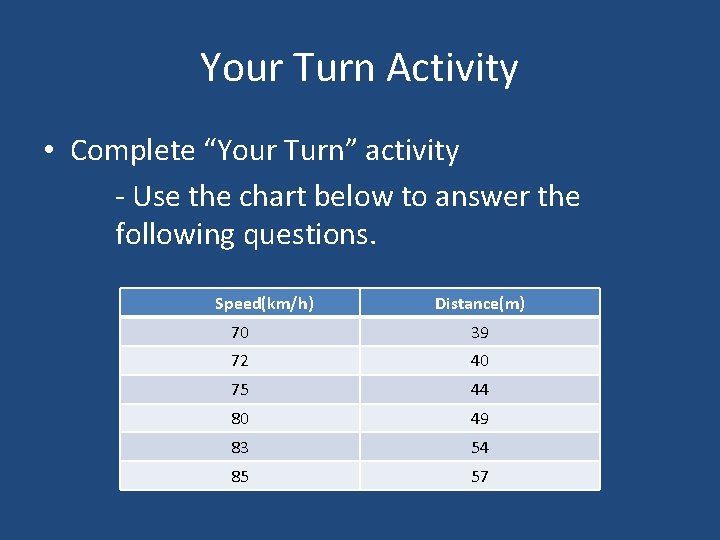
Your Turn Activity • Complete “Your Turn” activity - Use the chart below to answer the following questions. Speed(km/h) Distance(m) 70 39 72 40 75 44 80 49 83 54 85 57
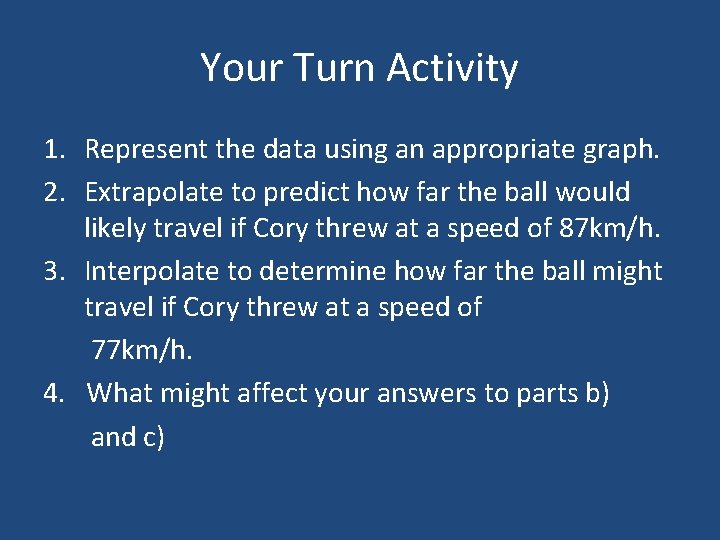
Your Turn Activity 1. Represent the data using an appropriate graph. 2. Extrapolate to predict how far the ball would likely travel if Cory threw at a speed of 87 km/h. 3. Interpolate to determine how far the ball might travel if Cory threw at a speed of 77 km/h. 4. What might affect your answers to parts b) and c)
Check Your Understanding • Complete the following questions. - #er’s: 1 - 4 - Page 174 - 175 - Go over the answers
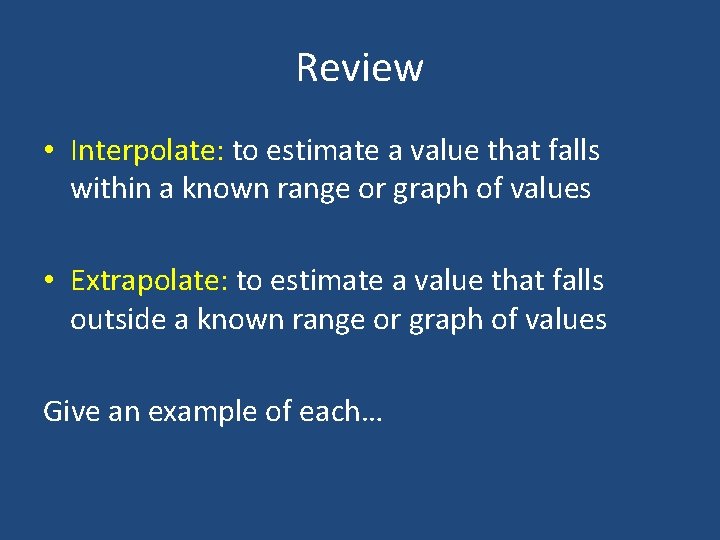
Review • Interpolate: to estimate a value that falls within a known range or graph of values • Extrapolate: to estimate a value that falls outside a known range or graph of values Give an example of each…
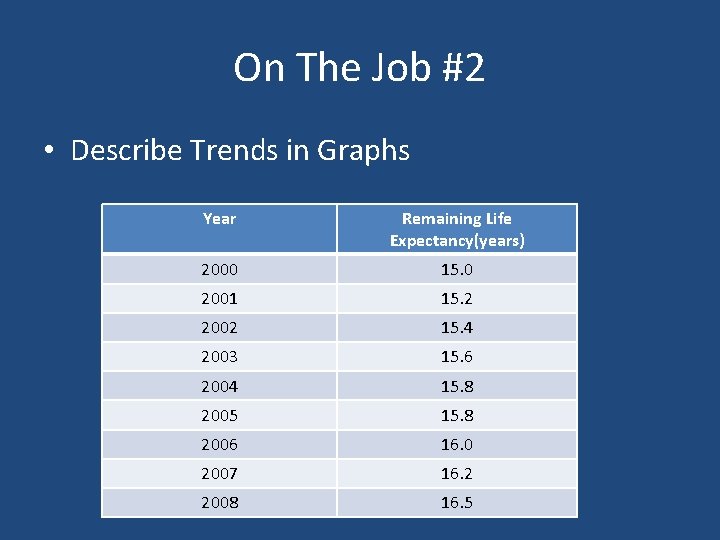
On The Job #2 • Describe Trends in Graphs Year Remaining Life Expectancy(years) 2000 15. 0 2001 15. 2 2002 15. 4 2003 15. 6 2004 15. 8 2005 15. 8 2006 16. 0 2007 16. 2 2008 16. 5
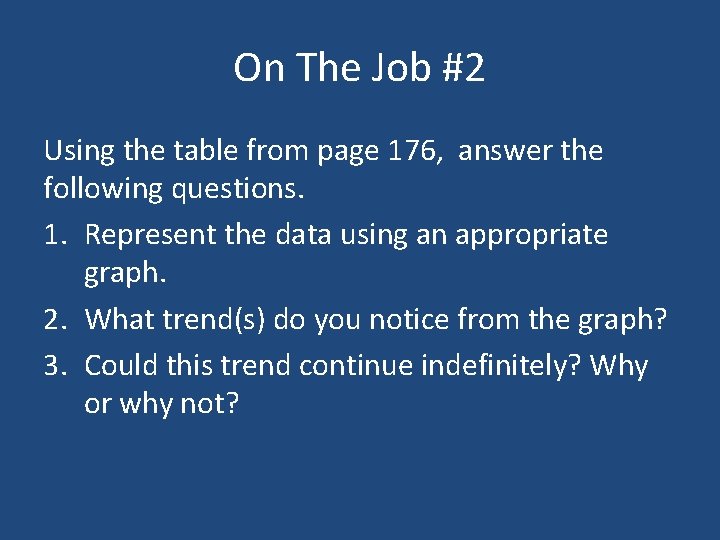
On The Job #2 Using the table from page 176, answer the following questions. 1. Represent the data using an appropriate graph. 2. What trend(s) do you notice from the graph? 3. Could this trend continue indefinitely? Why or why not?
Video Clip • http: //www. youtube. com/watch? v=N 1 u. AIm. H 4 Gw. A
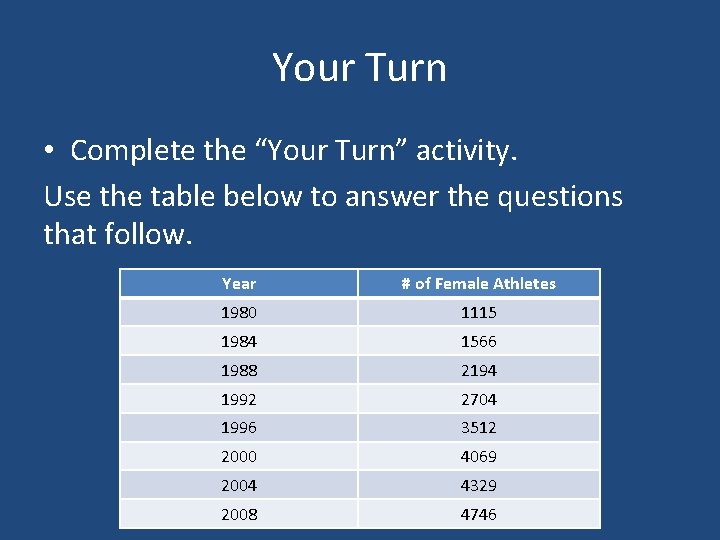
Your Turn • Complete the “Your Turn” activity. Use the table below to answer the questions that follow. Year # of Female Athletes 1980 1115 1984 1566 1988 2194 1992 2704 1996 3512 2000 4069 2004 4329 2008 4746
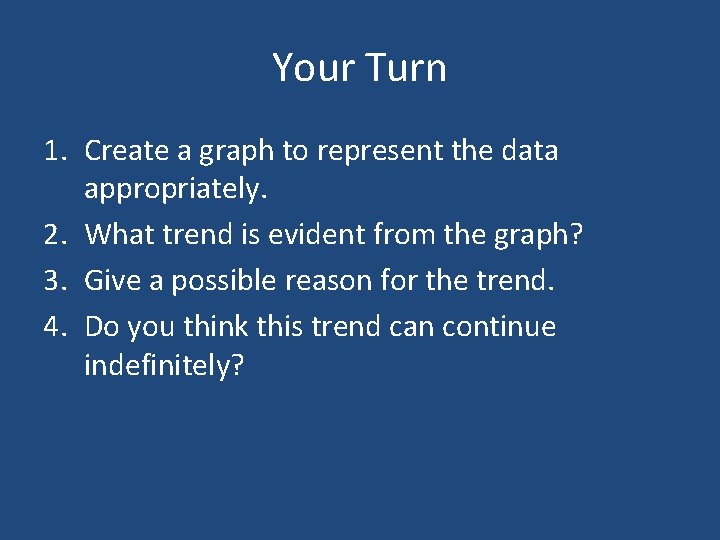
Your Turn 1. Create a graph to represent the data appropriately. 2. What trend is evident from the graph? 3. Give a possible reason for the trend. 4. Do you think this trend can continue indefinitely?
Check Your Understanding • Complete the following questions - Pages 178 – 179 - #er’s: 1 - 5 - Go over the answers
Work With It • Complete the following questions - Pages 180 -181 - #er’s: 1 - 4 - Go over the answers
Assignment • Complete Section 4. 1 & 4. 2 Assignment – Pass in when complete